Electronic Skin Market Size and Share Forecast Outlook 2025 to 2035

The electronic skin market is anticipated to grow significantly from USD 13.6 billion in 2025 to USD 86.2 billion by 2035, advancing at a CAGR of 20.3%. This rapid expansion is driven by increasing adoption of electronic skin technology in healthcare monitoring, robotics, and consumer electronics.
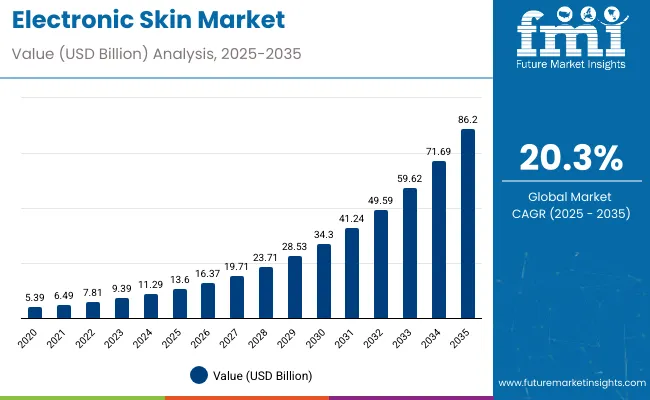
Quick Stats for Electronic Skin Market

  • Electronic Skin Market Value (2025): USD 13.6 billion
  • Electronic Skin Market Forecast Value (2035): USD 86.2 billion
  • Electronic Skin Market Forecast CAGR: 20.3%
  • Leading Component Segment in Electronic Skin Market in 2025: Stretchable Circuits (63%)
  • Key Growth Regions in Electronic Skin Market: North America and Asia Pacific
  • Key Players in Electronic Skin Market: MC10, Xenoma Inc., VivaLNK, Koninklijke Philips N.V., Dialog Semiconductor

Electronic Skin Market

Metric Value
Market Value (2025) USD 13.6 billion
Market Forecast Value (2035) USD 86.2 billion
CAGR 20.3%

The market growth reflects wider clinical acceptance, technological breakthroughs in flexible and stretchable electronics, along with rising prevalence of chronic diseases requiring continuous monitoring.

By 2030, the market is forecasted to reach USD 37.4 billion, showing a strong growth trajectory characterized by ongoing FDA approvals, integration with AI-enabled health platforms, and expansion in remote patient monitoring applications. The absolute dollar opportunity between 2025 and 2035 is expected to be USD 72.6 billion, indicating substantial opportunity in wearable medical devices, telemedicine, and personalized patient care.

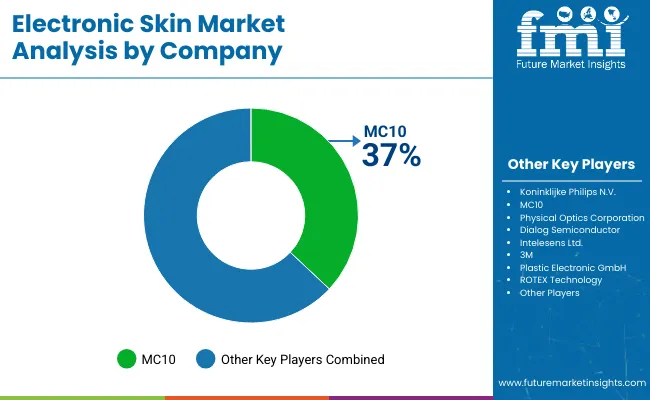
Key market players such as MC10, holding a commanding 37% share, alongside Xenoma, VivaLNK, Koninklijke Philips, and Dialog Semiconductor, are investing heavily in R&D and product innovation. Their advancements in electronic skin patches and biomedical devices are setting new standards for health monitoring solutions.Market performance is closely tied to regulatory approvals, material innovations, and the integration of AI and cloud technologies. These factors are shaping competitive dynamics and fueling adoption across healthcare and consumer technology sectors.

The market holds a significant and growing share in healthcare applications, accounting for about 38% of the electronic skin market in 2025, driven by its critical role in remote patient monitoring, chronic disease management, and wearable health sensors that provide continuous, non-invasive monitoring of vital signs such as heart rate and glucose levels. Electronic skin technologies account for an estimated 40% of the wearable health devices segment, reflecting their growing role in health monitoring solutions.

The market is transforming through integration with AI and IoT, which enhance real-time health data analysis and enable predictive healthcare. Companies are focusing on innovations such as self-healing materials, multifunctional sensors, and biocompatible adhesives to improve user comfort and device reliability. Collaborations with healthcare providers and digital health platforms are expanding the market reach and reshaping patient care delivery.

Why is Electronic Skin Market Growing?

The market is growing rapidly due to several converging technological, demographic, and healthcare trends. Primarily, the rising demand for advanced wearable healthcare devices is driving market expansion. Electronic skin technology enables continuous, non-invasive monitoring of vital signs, enhancing remote patient care and chronic disease management, which is critical given the aging global population and increasing prevalence of ailments like diabetes, cardiovascular diseases, and respiratory disorders.

Technological advances such as stretchable circuits, flexible sensors, and integration with AI and IoT platforms have significantly improved the reliability, sensitivity, and usability of electronic skin devices. This has expanded applications beyond healthcare into consumer electronics, robotics, and prosthetics, contributing to market diversification and growth.

Moreover, increasing healthcare expenditure, supportive government initiatives, and regulatory approvals are fostering innovation and product adoption globally, especially in developed regions like North America and Europe, as well as fast-growing markets in Asia-Pacific. Consumer demand for fitness monitoring, personalized health tracking, and interactive wearable technologies also stimulates investment and market growth.

Electronic Skin Market by Top Investment Segments

The market is segmented by component, application, and region. By component, the market is divided into stretchable circuits, stretchable conductors, electro-active polymers, photovoltaics, and others (MEMS, sensors). Based on application, the market is categorized into consumer electronics, automotive, healthcare, telecommunication, retail, aerospace & defense, and others (robotics, prosthetics). Regionally, the market is classified into North America, Latin America, Western Europe, Eastern Europe, Southeast Asia and others of Asia-Pacific (APAC), China, Japan, and Middle East & Africa.
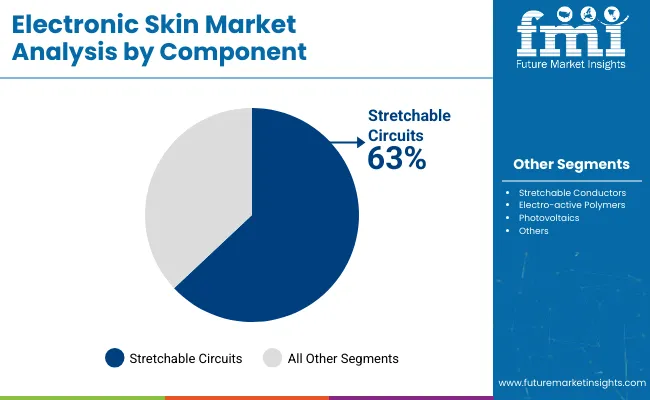
By Component, Stretchable Circuits Account 63% of the Market Share

Electronic Skin Market By Component

Stretchable circuits are the most lucrative segment, accounting for 63% of the market share in 2025. This segment’s growth is fueled by its critical role in enabling flexibility, durability, and high sensitivity in electronic skin devices, which are essential for healthcare applications like remote patient monitoring and wearable health sensors. Advances in material science, including conductive elastomers and nanomaterials, enhance the performance of stretchable circuits, further driving their adoption.

Other components, such as stretchable conductors and electro-active polymers, contribute to the market but hold relatively smaller shares due to ongoing development and integration challenges. Photovoltaics and other components, including micro-electromechanical systems (MEMS) and integrated sensors, are emerging segments expected to grow with technological advancements.Overall, the stretchable circuits segment dominates the electronic skin market, supported by technological innovation, rising healthcare demand, and integration with AI and IoT for smarter, real-time health monitoring solutions.
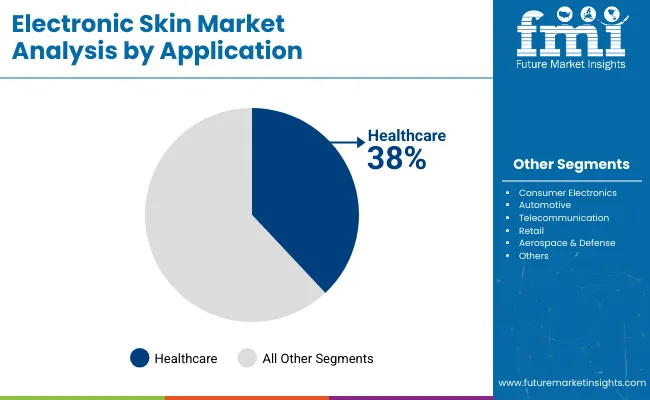
By Application, Healthcare Accounts 38% of the Market Share

Electronic Skin Market By Application

The healthcare segment dominates the market with a substantial 38% share in 2025. This growth is primarily driven by the increasing adoption of remote patient monitoring systems and wearable health sensors, which allow continuous, non-invasive tracking of vital physiological parameters such as heart rate, temperature, and glucose levels. Chronic disease management is another significant factor sweeping the healthcare market, as electronic skin technology provides real-time health data enabling personalized care and timely interventions. These devices enhance patient comfort by mimicking the properties of human skin with flexibility and stretchabilityattributes critical for long-term wear.

Furthermore, technological advancements in materials science, integration with AI and IoT for predictive analytics, and increasing FDA approvals bolster this segment's expansion. The healthcare industry’s push towards telemedicine and home healthcare during and after the COVID-19 pandemic has accelerated acceptance, reduced hospital visits, and improved patient outcomes. Collectively, these factors consolidate healthcare as the dominant application in the electronic skin market, rendering it a key growth driver and a continuing focus for innovation and investment from 2025 to 2035.

What are the Drivers, Restraints, and Key Trends of the Electronic Skin Market?

From 2025 to 2035, rapid advancements in flexible electronics and growing healthcare needs have been driving significant growth in the electronic skin market. Increasing adoption of wearable health monitoring devices, remote patient monitoring systems, and chronic disease management solutions position electronic skin as a key technology for personalized healthcare. Rising consumer awareness about fitness and health, along with the aging global population, fuels demand for continuous, non-invasive health tracking.

Growing Technological Innovation Drives Market Growth

Technological breakthroughs in materials science, including stretchable circuits, conductive elastomers, and nanosensors, have dramatically enhanced electronic skin performanceflexibility, durability, and sensitivitythus expanding applications from healthcare into robotics, prosthetics, and consumer electronics. Integration with AI and IoT platforms improves data analytics and connectivity, offering smarter health solutions.

Innovation and Strategic Collaborations Expand Market Opportunities

Ongoing innovation in bio-compatible materials, self-healing electronics, and multifunctional sensors, along with collaborations between tech companies, healthcare providers, and research institutions, are accelerating market growth. These partnerships facilitate development of advanced products and wider adoption in emerging applications. Regulatory approvals and increasing investments in research and development further support long-term market expansion.
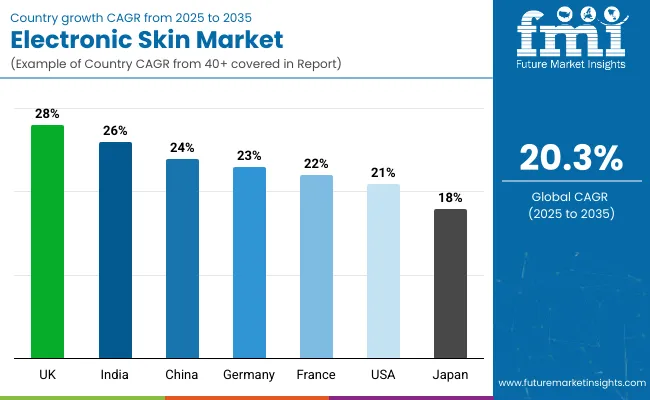
Electronic Skin Market Analysis by Key Countries

Country Wise Electronic Skin Market

Countries CAGR (2025 to 2035)
United Kingdom 28%
India 26%
China 24%
Germany 23%
France 22%
United States 21%
Japan 18%

The electronic skin market exhibits varied growth rates across top countries. The United Kingdom leads with the highest CAGR of 28%, driven by strong NHS support for telehealth and digital health initiatives. India follows closely with a 26% CAGR, fueled by expanding healthcare infrastructure and rising telemedicine adoption. China shows robust growth at 24%, supported by healthcare reforms and large patient populations. Germany and France experience steady expansions at 23% and 22% CAGR, respectively, benefiting from advanced healthcare systems and aging populations. The United States, despite being a market leader, has a slightly lower CAGR of 21%, reflecting market maturity and high baseline adoption. Japan shows stable growth at 18%, with an aging demographic driving demand for elder care solutions.

The report covers an in-depth analysis of 40+ countries; seven top-performing OECD countries are highlighted below.

Transforming Telehealth Adoption through Electronic Skin in the United Kingdom

Revenue from electronic skin in the UK is projected to experience a CAGR of 28% during 2025-2035, reflecting rapid market growth fueled by NHS-endorsed digital health programs and telehealth expansion. Increasing focus on predictive health and chronic condition management has accelerated adoption of electronic skin wearables. Strong public-private partnerships foster technological innovation and market access. Consumer awareness of health monitoring and wearable technologies is rising, further catalyzing demand. The UK’s forward-looking digital health policy framework creates a favorable environment for sustained electronic skin market expansion.

  • NHS-backed telehealth and digital health initiatives.
  • Growing consumer adoption of wearable health tech.
  • Integration of AI for enhanced health diagnostics.

Accelerating Digital Health Accessibility with Electronic Skin in India

Revenue from electronic skin in India is forecasted to grow at a CAGR of 26% due to expanding healthcare infrastructure and rising awareness of wearable health monitoring devices. Telemedicine’s rapid adoption in both urban and rural areas enables electronic skin technology to improve chronic disease care and preventive health. Government initiatives focusing on digital health innovation enhance access and affordability. The rise of local startups and increased investment in healthcare technology startups further stimulate market growth. India’s expanding middle class contributes to growing consumer demand for health-focused wearables.

  • Growing chronic disease prevalence and demand for remote monitoring.
  • Rising telemedicine and digital health adoption.
  • Government policies supporting healthcare technology innovation.

Powering Smart Healthcare Expansion through Electronic Skin in China

Demand for electronic skin in China leads growth with a CAGR of 24%, driven by large patient populations and healthcare modernization programs. Government reforms and smart hospital initiatives catalyze deployment of digital health technologies. Cost-efficient manufacturing and integration with AI and IoT facilitate market penetration. Urbanization and rise in chronic diseases increase demand for continuous health monitoring. Strategic partnerships with global tech firms accelerate innovation and adoption in the region’s growing health tech ecosystem.

  • Manufacturing scale enabling cost advantages.
  • Increasing integration of digital health technologies.
  • Collaborations with international companies.

Advancing Patient Centric Care with Electronic Skin in Germany

Demand for electronic skin in Germany will grow at a CAGR of 23% supported by extensive healthcare research and infrastructure. The healthcare system’s patient-centric care model supports adoption of wearable health monitoring devices. Government incentives and reimbursement policies encourage innovation and commercialization of electronic skin solutions. High consumer trust in wearable healthcare technologies and collaborative ventures between medical institutions and technology companies boost market growth. Germany also leads in clinical adoption of electronic skin for rehabilitation and chronic disease management.

  • Focus on patient-centric and rehabilitative technologies.
  • Beneficial reimbursement schemes for wearable health devices.
  • Strong collaborations between healthcare and tech sectors.

Enhancing Elderly Care Solutions with Electronic Skin in France

Revenue from electronic skin in France is projected to grow at a CAGR of 22%, propelled by an aging populationrequiring home health monitoring and rising healthcare expenditure. Investments in biocompatible sensor technologies and regulatory support expedite product launch and acceptance. Growth of regional health technology hubs and startup ecosystems boost innovation. Increased adoption of remote digital health platforms enhances patient care and monitoring. Public health initiatives supporting assisted living and elderly care further fuel demand for electronic skin technology.

  • Supportive regulatory environment for health innovation.
  • Growth of health tech clusters and startups.
  • Increasing uptake of remote patient monitoring.

Driving Healthcare Innovation with Electronic Skin in the United States

Revenue from electronic skin in the United States is expected to grow at a CAGR of 21% from 2025 to 2035, supported by advanced healthcare infrastructure, innovation in wearable sensors, and strong government support for telemedicine and digital health initiatives. Continuous advancements in AI and IoT integration further boost demand for personalized remote health monitoring solutions. The presence of major companies accelerates product development and market penetration, strengthening consumer trust and adoption. The surge in chronic diseases and an aging population stimulate the need for expanded electronic skin applications in healthcare. Moreover, regulatory frameworks support rapid clinical approvals, facilitating faster product launches and commercialization.

  • Robust healthcare infrastructure and R&D investments.
  • Increasing emphasis on personalized healthcare delivery.
  • Governmental support for digital healthcare modernization.

Supporting Aging Population Needs with Electronic Skin in Japan

Revenue from electronic skin in Japan is expected to grow at a CAGR of 18%, driven primarily by its aging population and a mature healthcare system. Government-backed telehealth initiatives and widespread acceptance of advanced medical technologies foster electronic skin adoption in elder care and chronic disease management. Strong R&D collaborations between academic institutions and industry enhance product development. Japanese consumers’ high technological literacy supports early adoption of new healthcare wearable devices. The country also benefits from significant healthcare spending focused on preventive and remote care solutions.
  • Aging population supporting elder care solutions.
  • High consumer acceptance of health wearables.
  • Strong investment in flexible electronics research.

Competitive Landscape of the Electronic Skin Market

Electronic Skin Market By Company

The market is characterized by rapid innovation and strategic collaborations among key industry players. Leading companies such as MC10, Xenoma Inc., VivaLNK, Koninklijke Philips N.V., and Dialog Semiconductor dominate the market, with MC10 holding a significant market share of 37% as of 2025. These players invest heavily in research and development to create flexible, stretchable, and highly sensitive electronic skin devices that closely mimic the tactile properties of human skin. Their focus spans healthcare, consumer electronics, and robotics applications, driving industry growth.

Strategic partnerships between technology firms, healthcare providers, and research institutions further accelerate product innovation and market penetration. Increasing demand for remote patient monitoring and chronic disease management pushes companies to improve sensor accuracy, energy efficiency, and integration with AI and IoT platforms. Emerging startups contribute cost-effective and specialized solutions, adding dynamism to the market.

Scope of Report

Items Values
Quantitative Units (2025) USD 13.6 Billion
Component Stretchable Circuits, Stretchable Conductors, Electro-active Polymers, Photovoltaics, Others (MEMS, Sensors)
Application Healthcare, Consumer Electronics, Automotive, Telecommunication, Retail, Aerospace & Defense, Others (Robotics, Prosthetics)
Regions Covered North America, Latin America, Western Europe, Eastern Europe, Southeast Asia & Others of APAC, China, Japan, Middle East & Africa
Countries Covered United States, Canada, United Kingdom, Germany, France, China, Japan, South Korea, Brazil, Australia, and 40+ countries
Key Companies Profiled Koninklijke Philips N.V., MC10, Physical Optics Corporation, Dialog Semiconductor, Intelesens Ltd., 3M, Plastic Electronic GmbH, ROTEX Technology, VivaLNK, Smartlife, Xenoma Inc., Xsensio
Additional Attributes Dollar sales by component and application, Regional demand trends, Competitive landscape, Buyer preferences for flexible versus stretchable formats, Integration with wearable electronics, Innovations in material engineering, sensor miniaturization, and fabrication for enhanced responsiveness and durability

Key Segments

By Component:

  • Stretchable Circuits
  • Stretchable Conductors
  • Electr-active Polymers
  • Photovoltaics
  • Others

By Application:

  • Consumer Electronics
  • Automotive
  • Healthcare
  • Telecommunication
  • Retail
  • Aerospace & Defense
  • Others

Key regions covered in the global electronic skin market report:

  • North America
    • USA
    • Canada
  • Latin America
    • Brazil
    • Mexico
    • Rest of Latin America
  • Europe
    • Germany
    • France
    • UK
    • Spain
    • Italy
    • Russia
    • Rest of Europe
  • SEA and Others of APAC
    • India
    • ASEAN
    • Australia and New Zealand
    • Rest of SEA and Other APAC
  • China
  • Japan
  • Middle East and Africa
    • Northern Africa
    • GCC Countries
    • South Africa
    • Turkey
    • Rest of Middle East and Africa

Table of Content

  1. Executive Summary
    • Global Market Outlook
    • Demand-side Trends
    • Supply-side Trends
    • Technology Roadmap Analysis
    • Analysis and Recommendations
  2. Market Overview
    • Market Coverage / Taxonomy
    • Market Definition / Scope / Limitations
  3. Market Background
    • Market Dynamics
      • Drivers
      • Restraints
      • Opportunity
      • Trends
    • Scenario Forecast
      • Demand in Optimistic Scenario
      • Demand in Likely Scenario
      • Demand in Conservative Scenario
    • Opportunity Map Analysis
    • Product Life Cycle Analysis
    • Supply Chain Analysis
      • Supply Side Participants and their Roles
        • Producers
        • Mid-Level Participants (Traders/ Agents/ Brokers)
        • Wholesalers and Distributors
      • Value Added and Value Created at Node in the Supply Chain
      • List of Raw Material Suppliers
      • List of Existing and Potential Buyer’s
    • Investment Feasibility Matrix
    • Value Chain Analysis
      • Profit Margin Analysis
      • Wholesalers and Distributors
      • Retailers
    • PESTLE and Porter’s Analysis
    • Regulatory Landscape
      • By Key Regions
      • By Key Countries
    • Regional Parent Market Outlook
    • Production and Consumption Statistics
    • Import and Export Statistics
  4. Global Market Analysis 2020 to 2024 and Forecast, 2025 to 2035
    • Historical Market Size Value (USD Billion) & Volume (Units) Analysis, 2020 to 2024
    • Current and Future Market Size Value (USD Billion) & Volume (Units) Projections, 2025 to 2035
      • Y-o-Y Growth Trend Analysis
      • Absolute $ Opportunity Analysis
  5. Global Market Pricing Analysis 2020 to 2024 and Forecast 2025 to 2035
  6. Global Market Analysis 2020 to 2024 and Forecast 2025 to 2035, By Component
    • Introduction / Key Findings
    • Historical Market Size Value (USD Billion) & Volume (Units) Analysis By Component, 2020 to 2024
    • Current and Future Market Size Value (USD Billion) & Volume (Units) Analysis and Forecast By Component, 2025 to 2035
      • Stretchable Circuits
      • Stretchable Conductors
      • Electro-active Polymers
      • Photovoltaics
      • Others (MEMS, Sensors)
    • Y-o-Y Growth Trend Analysis By Component, 2020 to 2024
    • Absolute $ Opportunity Analysis By Component, 2025 to 2035
  7. Global Market Analysis 2020 to 2024 and Forecast 2025 to 2035, By Application
    • Introduction / Key Findings
    • Historical Market Size Value (USD Billion) & Volume (Units) Analysis By Application, 2020 to 2024
    • Current and Future Market Size Value (USD Billion) & Volume (Units) Analysis and Forecast By Application, 2025 to 2035
      • Consumer Electronics
      • Automotive
      • Healthcare
      • Telecommunication
      • Retail
      • Aerospace & Defense
      • Others (Robotics, Prosthetics)
    • Y-o-Y Growth Trend Analysis By Application, 2020 to 2024
    • Absolute $ Opportunity Analysis By Application, 2025 to 2035
  8. Global Market Analysis 2020 to 2024 and Forecast 2025 to 2035, By Region
    • Introduction
    • Historical Market Size Value (USD Billion) & Volume (Units) Analysis By Region, 2020 to 2024
    • Current Market Size Value (USD Billion) & Volume (Units) Analysis and Forecast By Region, 2025 to 2035
      • North America
      • Latin America
      • Western Europe
      • Eastern Europe
      • East Asia
      • South Asia & Pacific
      • Middle East and Africa
    • Market Attractiveness Analysis By Region
  9. North America Market Analysis 2020 to 2024 and Forecast 2025 to 2035, By Country
    • Historical Market Size Value (USD Billion) & Volume (Units) Trend Analysis By Market Taxonomy, 2020 to 2024
    • Market Size Value (USD Billion) & Volume (Units) Forecast By Market Taxonomy, 2025 to 2035
      • By Country
        • U.S.
        • Canada
        • Mexico
      • By Component
      • By Application
    • Market Attractiveness Analysis
      • By Country
      • By Component
      • By Application
    • Key Takeaways
  10. Latin America Market Analysis 2020 to 2024 and Forecast 2025 to 2035, By Country
    • Historical Market Size Value (USD Billion) & Volume (Units) Trend Analysis By Market Taxonomy, 2020 to 2024
    • Market Size Value (USD Billion) & Volume (Units) Forecast By Market Taxonomy, 2025 to 2035
      • By Country
        • Brazil 
        • Argentina
        • Rest of LATAM
      • By Component
      • By Application
    • Market Attractiveness Analysis
      • By Country
      • By Component
      • By Application
    • Key Takeaways
  11. Western Europe Market Analysis 2020 to 2024 and Forecast 2025 to 2035, By Country
    • Historical Market Size Value (USD Billion) & Volume (Units) Trend Analysis By Market Taxonomy, 2020 to 2024
    • Market Size Value (USD Billion) & Volume (Units) Forecast By Market Taxonomy, 2025 to 2035
      • By Country
        • Germany
        • Italy
        • France
        • UK
        • Spain
        • BENELUX
        • Nordic
        • Rest of W.Europe
      • By Component
      • By Application
    • Market Attractiveness Analysis
      • By Country
      • By Component
      • By Application
    • Key Takeaways
  12. Eastern Europe Market Analysis 2020 to 2024 and Forecast 2025 to 2035, By Country
    • Historical Market Size Value (USD Billion) & Volume (Units) Trend Analysis By Market Taxonomy, 2020 to 2024
    • Market Size Value (USD Billion) & Volume (Units) Forecast By Market Taxonomy, 2025 to 2035
      • By Country
        • Russia
        • Hungary
        • Poland
        • Balkan & Baltics
        • Rest of E. Europe
      • By Component
      • By Application
    • Market Attractiveness Analysis
      • By Country
      • By Component
      • By Application
    • Key Takeaways
  13. East Asia Market Analysis 2020 to 2024 and Forecast 2025 to 2035, By Country
    • Historical Market Size Value (USD Billion) & Volume (Units) Trend Analysis By Market Taxonomy, 2020 to 2024
    • Market Size Value (USD Billion) & Volume (Units) Forecast By Market Taxonomy, 2025 to 2035
      • By Country
        • China
        • Japan
        • South Korea
      • By Component
      • By Application
    • Market Attractiveness Analysis
      • By Country
      • By Component
      • By Application
    • Key Takeaways
  14. South Asia & Pacific Market Analysis 2020 to 2024 and Forecast 2025 to 2035, By Country
    • Historical Market Size Value (USD Billion) & Volume (Units) Trend Analysis By Market Taxonomy, 2020 to 2024
    • Market Size Value (USD Billion) & Volume (Units) Forecast By Market Taxonomy, 2025 to 2035
      • By Country
        • India
        • Australia & New Zealand
        • ASEAN
        • Rest of SAP
      • By Component
      • By Application
    • Market Attractiveness Analysis
      • By Country
      • By Component
      • By Application
    • Key Takeaways
  15. Middle East and Africa Market Analysis 2020 to 2024 and Forecast 2025 to 2035, By Country
    • Historical Market Size Value (USD Billion) & Volume (Units) Trend Analysis By Market Taxonomy, 2020 to 2024
    • Market Size Value (USD Billion) & Volume (Units) Forecast By Market Taxonomy, 2025 to 2035
      • By Country
        • GCC Countries
        • Northern Africa
        • South Africa
        • Turkiye
        • Rest of MEA
      • By Component
      • By Application
    • Market Attractiveness Analysis
      • By Country
      • By Component
      • By Application
    • Key Takeaways
  16. Key Countries Market Analysis
    • U.S.
      • Pricing Analysis
      • Market Share Analysis, 2024
        • By Component
        • By Application
    • Canada
      • Pricing Analysis
      • Market Share Analysis, 2024
        • By Component
        • By Application
    • Brazil
      • Pricing Analysis
      • Market Share Analysis, 2024
        • By Component
        • By Application
    • Mexico
      • Pricing Analysis
      • Market Share Analysis, 2024
        • By Component
        • By Application
    • Argentina
      • Pricing Analysis
      • Market Share Analysis, 2024
        • By Component
        • By Application
  17. Market Structure Analysis
    • Competition Dashboard
    • Competition Benchmarking
    • Market Share Analysis of Top Players
      • By Regional
      • By Component
      • By Application
  18. Competition Analysis
    • Competition Deep Dive
      • Koninklijke Philips N.V.
        • Overview
        • Product Portfolio
        • Profitability by Market Segments (Product/Age /Sales Channel/Region)
        • Sales Footprint
        • Strategy Overview
          • Marketing Strategy
          • Product Strategy
          • Channel Strategy
      • MC10
        • Overview
        • Product Portfolio
        • Profitability by Market Segments (Product/Age /Sales Channel/Region)
        • Sales Footprint
        • Strategy Overview
          • Marketing Strategy
          • Product Strategy
          • Channel Strategy
      • Physical Optics Corporation
        • Overview
        • Product Portfolio
        • Profitability by Market Segments (Product/Age /Sales Channel/Region)
        • Sales Footprint
        • Strategy Overview
          • Marketing Strategy
          • Product Strategy
          • Channel Strategy
      • Dialog Semiconductor
        • Overview
        • Product Portfolio
        • Profitability by Market Segments (Product/Age /Sales Channel/Region)
        • Sales Footprint
        • Strategy Overview
          • Marketing Strategy
          • Product Strategy
          • Channel Strategy
      • Intelesens Ltd.
        • Overview
        • Product Portfolio
        • Profitability by Market Segments (Product/Age /Sales Channel/Region)
        • Sales Footprint
        • Strategy Overview
          • Marketing Strategy
          • Product Strategy
          • Channel Strategy
      • 3M
        • Overview
        • Product Portfolio
        • Profitability by Market Segments (Product/Age /Sales Channel/Region)
        • Sales Footprint
        • Strategy Overview
          • Marketing Strategy
          • Product Strategy
          • Channel Strategy
      • Plastic Electronic GmbH
        • Overview
        • Product Portfolio
        • Profitability by Market Segments (Product/Age /Sales Channel/Region)
        • Sales Footprint
        • Strategy Overview
          • Marketing Strategy
          • Product Strategy
          • Channel Strategy
      • ROTEX Technology
        • Overview
        • Product Portfolio
        • Profitability by Market Segments (Product/Age /Sales Channel/Region)
        • Sales Footprint
        • Strategy Overview
          • Marketing Strategy
          • Product Strategy
          • Channel Strategy
      • VivaLNK
        • Overview
        • Product Portfolio
        • Profitability by Market Segments (Product/Age /Sales Channel/Region)
        • Sales Footprint
        • Strategy Overview
          • Marketing Strategy
          • Product Strategy
          • Channel Strategy
      • Smartlife
        • Overview
        • Product Portfolio
        • Profitability by Market Segments (Product/Age /Sales Channel/Region)
        • Sales Footprint
        • Strategy Overview
          • Marketing Strategy
          • Product Strategy
          • Channel Strategy
      • Xenoma Inc.
        • Overview
        • Product Portfolio
        • Profitability by Market Segments (Product/Age /Sales Channel/Region)
        • Sales Footprint
        • Strategy Overview
          • Marketing Strategy
          • Product Strategy
          • Channel Strategy
      • Xsensio
        • Overview
        • Product Portfolio
        • Profitability by Market Segments (Product/Age /Sales Channel/Region)
        • Sales Footprint
        • Strategy Overview
          • Marketing Strategy
          • Product Strategy
          • Channel Strategy
  19. Assumptions & Acronyms Used
  20. Research Methodology

List of Tables

  • Table 1: Global Market Value (USD Billion) Forecast by Region, 2020-2035
  • Table 2: Global Market Volume (Units) Forecast by Region, 2020-2035
  • Table 3: Global Market Value (USD Billion) Forecast by Component, 2020-2035
  • Table 4: Global Market Volume (Units) Forecast by Component, 2020-2035
  • Table 5: Global Market Value (USD Billion) Forecast by Application, 2020-2035
  • Table 6: Global Market Volume (Units) Forecast by Application, 2020-2035
  • Table 7: North America Market Value (USD Billion) Forecast by Country, 2020-2035
  • Table 8: North America Market Volume (Units) Forecast by Country, 2020-2035
  • Table 9: North America Market Value (USD Billion) Forecast by Component, 2020-2035
  • Table 10: North America Market Volume (Units) Forecast by Component, 2020-2035
  • Table 11: North America Market Value (USD Billion) Forecast by Application, 2020-2035
  • Table 12: North America Market Volume (Units) Forecast by Application, 2020-2035
  • Table 13: Latin America Market Value (USD Billion) Forecast by Country, 2020-2035
  • Table 14: Latin America Market Volume (Units) Forecast by Country, 2020-2035
  • Table 15: Latin America Market Value (USD Billion) Forecast by Component, 2020-2035
  • Table 16: Latin America Market Volume (Units) Forecast by Component, 2020-2035
  • Table 17: Latin America Market Value (USD Billion) Forecast by Application, 2020-2035
  • Table 18: Latin America Market Volume (Units) Forecast by Application, 2020-2035
  • Table 19: Western Europe Market Value (USD Billion) Forecast by Country, 2020-2035
  • Table 20: Western Europe Market Volume (Units) Forecast by Country, 2020-2035
  • Table 21: Western Europe Market Value (USD Billion) Forecast by Component, 2020-2035
  • Table 22: Western Europe Market Volume (Units) Forecast by Component, 2020-2035
  • Table 23: Western Europe Market Value (USD Billion) Forecast by Application, 2020-2035
  • Table 24: Western Europe Market Volume (Units) Forecast by Application, 2020-2035
  • Table 25: Eastern Europe Market Value (USD Billion) Forecast by Country, 2020-2035
  • Table 26: Eastern Europe Market Volume (Units) Forecast by Country, 2020-2035
  • Table 27: Eastern Europe Market Value (USD Billion) Forecast by Component, 2020-2035
  • Table 28: Eastern Europe Market Volume (Units) Forecast by Component, 2020-2035
  • Table 29: Eastern Europe Market Value (USD Billion) Forecast by Application, 2020-2035
  • Table 30: Eastern Europe Market Volume (Units) Forecast by Application, 2020-2035
  • Table 31: East Asia Market Value (USD Billion) Forecast by Country, 2020-2035
  • Table 32: East Asia Market Volume (Units) Forecast by Country, 2020-2035
  • Table 33: East Asia Market Value (USD Billion) Forecast by Component, 2020-2035
  • Table 34: East Asia Market Volume (Units) Forecast by Component, 2020-2035
  • Table 35: East Asia Market Value (USD Billion) Forecast by Application, 2020-2035
  • Table 36: East Asia Market Volume (Units) Forecast by Application, 2020-2035
  • Table 37: South Asia & Pacific Market Value (USD Billion) Forecast by Country, 2020-2035
  • Table 38: South Asia & Pacific Market Volume (Units) Forecast by Country, 2020-2035
  • Table 39: South Asia & Pacific Market Value (USD Billion) Forecast by Component, 2020-2035
  • Table 40: South Asia & Pacific Market Volume (Units) Forecast by Component, 2020-2035
  • Table 41: South Asia & Pacific Market Value (USD Billion) Forecast by Application, 2020-2035
  • Table 42: South Asia & Pacific Market Volume (Units) Forecast by Application, 2020-2035
  • Table 43: Middle East and Africa Market Value (USD Billion) Forecast by Country, 2020-2035
  • Table 44: Middle East and Africa Market Volume (Units) Forecast by Country, 2020-2035
  • Table 45: Middle East and Africa Market Value (USD Billion) Forecast by Component, 2020-2035
  • Table 46: Middle East and Africa Market Volume (Units) Forecast by Component, 2020-2035
  • Table 47: Middle East and Africa Market Value (USD Billion) Forecast by Application, 2020-2035
  • Table 48: Middle East and Africa Market Volume (Units) Forecast by Application, 2020-2035

List of Figures

  • Figure 1: Global Market Volume (Units) Forecast 2020-2035
  • Figure 2: Global Market Pricing Analysis
  • Figure 3: Global Market Value (USD Billion) Forecast 2020-2035
  • Figure 4: Global Market Value Share and BPS Analysis by Component, 2025 and 2035
  • Figure 5: Global Market Y-o-Y Growth Comparison by Component, 2025-2035
  • Figure 6: Global Market Attractiveness Analysis by Component
  • Figure 7: Global Market Value Share and BPS Analysis by Application, 2025 and 2035
  • Figure 8: Global Market Y-o-Y Growth Comparison by Application, 2025-2035
  • Figure 9: Global Market Attractiveness Analysis by Application
  • Figure 10: Global Market Value (USD Billion) Share and BPS Analysis by Region, 2025 and 2035
  • Figure 11: Global Market Y-o-Y Growth Comparison by Region, 2025-2035
  • Figure 12: Global Market Attractiveness Analysis by Region
  • Figure 13: North America Market Incremental $ Opportunity, 2025-2035
  • Figure 14: Latin America Market Incremental $ Opportunity, 2025-2035
  • Figure 15: Western Europe Market Incremental $ Opportunity, 2025-2035
  • Figure 16: Eastern Europe Market Incremental $ Opportunity, 2025-2035
  • Figure 17: East Asia Market Incremental $ Opportunity, 2025-2035
  • Figure 18: South Asia & Pacific Market Incremental $ Opportunity, 2025-2035
  • Figure 19: Middle East and Africa Market Incremental $ Opportunity, 2025-2035
  • Figure 20: North America Market Value Share and BPS Analysis by Country, 2025 and 2035
  • Figure 21: North America Market Value Share and BPS Analysis by Component, 2025 and 2035
  • Figure 22: North America Market Y-o-Y Growth Comparison by Component, 2025-2035
  • Figure 23: North America Market Attractiveness Analysis by Component
  • Figure 24: North America Market Value Share and BPS Analysis by Application, 2025 and 2035
  • Figure 25: North America Market Y-o-Y Growth Comparison by Application, 2025-2035
  • Figure 26: North America Market Attractiveness Analysis by Application
  • Figure 27: Latin America Market Value Share and BPS Analysis by Country, 2025 and 2035
  • Figure 28: Latin America Market Value Share and BPS Analysis by Component, 2025 and 2035
  • Figure 29: Latin America Market Y-o-Y Growth Comparison by Component, 2025-2035
  • Figure 30: Latin America Market Attractiveness Analysis by Component
  • Figure 31: Latin America Market Value Share and BPS Analysis by Application, 2025 and 2035
  • Figure 32: Latin America Market Y-o-Y Growth Comparison by Application, 2025-2035
  • Figure 33: Latin America Market Attractiveness Analysis by Application
  • Figure 34: Western Europe Market Value Share and BPS Analysis by Country, 2025 and 2035
  • Figure 35: Western Europe Market Value Share and BPS Analysis by Component, 2025 and 2035
  • Figure 36: Western Europe Market Y-o-Y Growth Comparison by Component, 2025-2035
  • Figure 37: Western Europe Market Attractiveness Analysis by Component
  • Figure 38: Western Europe Market Value Share and BPS Analysis by Application, 2025 and 2035
  • Figure 39: Western Europe Market Y-o-Y Growth Comparison by Application, 2025-2035
  • Figure 40: Western Europe Market Attractiveness Analysis by Application
  • Figure 41: Eastern Europe Market Value Share and BPS Analysis by Country, 2025 and 2035
  • Figure 42: Eastern Europe Market Value Share and BPS Analysis by Component, 2025 and 2035
  • Figure 43: Eastern Europe Market Y-o-Y Growth Comparison by Component, 2025-2035
  • Figure 44: Eastern Europe Market Attractiveness Analysis by Component
  • Figure 45: Eastern Europe Market Value Share and BPS Analysis by Application, 2025 and 2035
  • Figure 46: Eastern Europe Market Y-o-Y Growth Comparison by Application, 2025-2035
  • Figure 47: Eastern Europe Market Attractiveness Analysis by Application
  • Figure 48: East Asia Market Value Share and BPS Analysis by Country, 2025 and 2035
  • Figure 49: East Asia Market Value Share and BPS Analysis by Component, 2025 and 2035
  • Figure 50: East Asia Market Y-o-Y Growth Comparison by Component, 2025-2035
  • Figure 51: East Asia Market Attractiveness Analysis by Component
  • Figure 52: East Asia Market Value Share and BPS Analysis by Application, 2025 and 2035
  • Figure 53: East Asia Market Y-o-Y Growth Comparison by Application, 2025-2035
  • Figure 54: East Asia Market Attractiveness Analysis by Application
  • Figure 55: South Asia & Pacific Market Value Share and BPS Analysis by Country, 2025 and 2035
  • Figure 56: South Asia & Pacific Market Value Share and BPS Analysis by Component, 2025 and 2035
  • Figure 57: South Asia & Pacific Market Y-o-Y Growth Comparison by Component, 2025-2035
  • Figure 58: South Asia & Pacific Market Attractiveness Analysis by Component
  • Figure 59: South Asia & Pacific Market Value Share and BPS Analysis by Application, 2025 and 2035
  • Figure 60: South Asia & Pacific Market Y-o-Y Growth Comparison by Application, 2025-2035
  • Figure 61: South Asia & Pacific Market Attractiveness Analysis by Application
  • Figure 62: Middle East and Africa Market Value Share and BPS Analysis by Country, 2025 and 2035
  • Figure 63: Middle East and Africa Market Value Share and BPS Analysis by Component, 2025 and 2035
  • Figure 64: Middle East and Africa Market Y-o-Y Growth Comparison by Component, 2025-2035
  • Figure 65: Middle East and Africa Market Attractiveness Analysis by Component
  • Figure 66: Middle East and Africa Market Value Share and BPS Analysis by Application, 2025 and 2035
  • Figure 67: Middle East and Africa Market Y-o-Y Growth Comparison by Application, 2025-2035
  • Figure 68: Middle East and Africa Market Attractiveness Analysis by Application
  • Figure 69: Global Market - Tier Structure Analysis
  • Figure 70: Global Market - Company Share Analysis

Frequently Asked Questions

How big is the electronic skin market in 2025?

The global electronic skin market is estimated to be valued at USD 13.6 billion in 2025.

What will be the size of the electronic skin market in 2035?

The market size for electronic skin is projected to reach USD 86.2 billion by 2035.

How much will the electronic skin market grow between 2025 and 2035?

The electronic skin market is expected to grow at a CAGR of 20.3% between 2025 and 2035.

Which component segment is projected to lead in the electronic skin market in 2025?

The stretchable circuits segment is projected to lead the electronic skin market with a 63% market share in 2025.

Which application segment is expected to contribute significant share in the electronic skin market in 2025?

In terms of application, healthcare is expected to command a 38% share in the electronic skin market in 2025.

Explore Similar Insights

Future Market Insights

Electronic Skin Market

Chat With

MaRIA

Hi There, I am MaRIA, Your Market Research Intelligence Assistant. How may I help you?