The Electrolyte Markers Market is estimated to be valued at USD 741.8 billion in 2025 and is projected to reach USD 1670.2 billion by 2035, registering a compound annual growth rate (CAGR) of 8.5% over the forecast period.
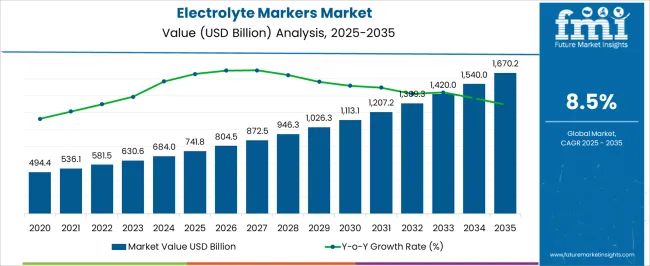
| Metric | Value |
|---|---|
| Electrolyte Markers Market Estimated Value in (2025 E) | USD 741.8 billion |
| Electrolyte Markers Market Forecast Value in (2035 F) | USD 1670.2 billion |
| Forecast CAGR (2025 to 2035) | 8.5% |
The electrolyte markers market is expanding steadily as healthcare systems emphasize the importance of rapid and accurate diagnostic solutions for managing fluid balance, kidney function, and metabolic disorders. Rising cases of dehydration, renal diseases, and lifestyle related conditions have accelerated the adoption of electrolyte testing as part of routine diagnostics and emergency care.
Continuous improvements in assay technologies, point of care testing platforms, and integration with digital health systems are enhancing diagnostic efficiency and accessibility across diverse healthcare settings. The use of automated analyzers and advanced specimen handling techniques is ensuring reliability and faster turnaround times for clinicians.
Regulatory focus on patient safety and the growing prevalence of chronic illnesses are also driving wider adoption. The outlook remains positive with strong demand from hospitals, diagnostic laboratories, and outpatient clinics seeking cost effective and reliable solutions for electrolyte monitoring.
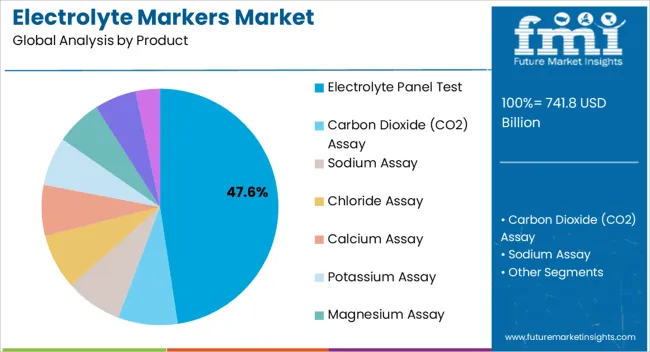
The electrolyte panel test segment is projected to hold 47.60% of the total revenue by 2025 within the product category, making it the leading product type. Its dominance is supported by the comprehensive evaluation it provides for critical electrolytes such as sodium, potassium, and chloride, which are essential indicators of patient health.
The ability to diagnose and monitor multiple conditions simultaneously has strengthened its preference among healthcare providers. Integration with automated analyzers and wide availability across hospitals and laboratories further reinforce its adoption.
As clinical decisions increasingly rely on accurate biochemical markers, the electrolyte panel test segment continues to lead due to its efficiency, accessibility, and clinical reliability.
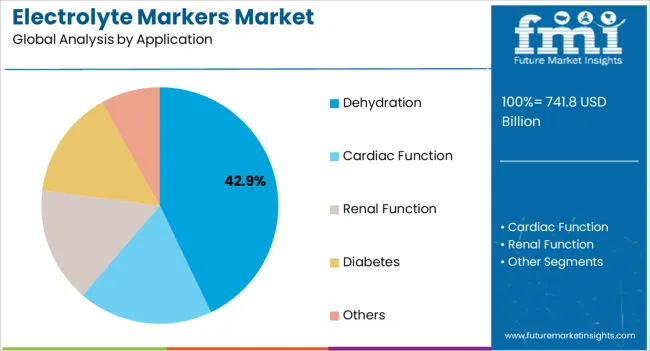
The dehydration segment is expected to account for 42.90% of total market revenue by 2025 under the application category, positioning it as the dominant application. This growth is driven by rising incidences of fluid imbalance caused by chronic diseases, heat exposure, and lifestyle related conditions.
Dehydration diagnosis is highly dependent on electrolyte monitoring, making these tests essential in both acute and outpatient care. Healthcare systems are increasingly prioritizing rapid identification and treatment of dehydration to avoid severe complications, further boosting demand for electrolyte testing in this category.
As awareness of preventive healthcare grows, the use of electrolyte markers for early detection of dehydration continues to expand, ensuring its leadership in the application segment.
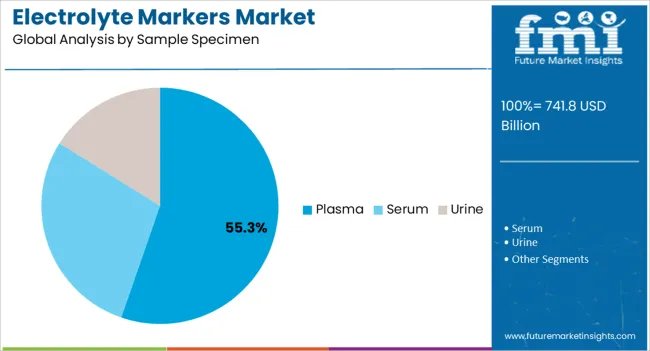
The plasma segment is projected to represent 55.30% of total market revenue by 2025 within the sample specimen category, making it the leading specimen type. Plasma is widely used due to its high reliability in reflecting real time electrolyte levels, ease of processing, and compatibility with automated diagnostic platforms.
Its suitability for both emergency and routine diagnostics has established it as the preferred sample specimen in hospitals and laboratories. Advancements in plasma separation and storage techniques have further enhanced accuracy and reproducibility of results.
As healthcare providers demand consistent and precise electrolyte measurement, plasma continues to dominate as the most trusted and efficient specimen category in this market.
From 2012 to 2025, the global electrolyte markers market experienced a CAGR of 7.1%, reaching a market size of USD 741.8 million in 2025.
Developing countries are witnessing a rise in disposable income and an increasing focus on health and wellness. As consumers in these regions become more aware of the importance of electrolyte balance and hydration, the demand for electrolyte markers is expected to grow.
Manufacturers are expected to focus on product innovation and differentiation to meet consumer demands and stay competitive. This includes developing new flavors, formulations, and packaging options to cater to diverse consumer preferences. Continuous innovation and differentiation efforts are likely to drive consumer interest and boost market demand.
Future Forecast for Electrolyte Markers Industry:
Looking ahead, the global electrolyte markers market is expected to rise at a CAGR of 8.9% from 2025 to 2035. During the forecast period, the market size is expected to reach USD 1670.2 billion by 2035.
Electrolyte imbalances can be caused by a number of medical ailments, including kidney disorders, gastrointestinal diseases, as well as certain medications. For the management of electrolyte levels in patients with such diseases, electrolyte markers are crucial. The need for electrolyte markers in the medical industry is probably influenced by the rising incidence of various health disorders.
The popularity of endurance sports, such as running, cycling, swimming, summer sports, and winter sports is expected to contribute to the demand for electrolyte markers. On the other hand, the expansion of e-commerce and online retail platforms provides a convenient and accessible channel for consumers to purchase electrolyte markers.
The ease of online shopping, coupled with competitive pricing and a wide range of product options, is expected to drive market demand. Online retail expansion allows manufacturers to reach a broader consumer base and boost sales.
| Country | The United States |
|---|---|
| Market Size (USD Million) by End of Forecast Period (2035) | USD 1670.2 million |
| CAGR % 2025 to End of Forecast (2035) | 8.2% |
The electrolyte markers market in the United States is expected to reach a market size of USD 1670.2 million by 2035, expanding at a CAGR of 8.2%. Chronic diseases such as kidney disorders, cardiovascular diseases, and diabetes can cause electrolyte imbalances in the body. The rising incidence of these conditions may drive the demand for electrolyte markers to monitor and manage patients' electrolyte levels.
According to data from the CDC, 494.4 million adult Americans (or one in every seven or 15 percent of the adult population) were predicted to have chronic kidney disease (CKD) in 2020.
| Country | The United Kingdom |
|---|---|
| Market Size (USD Million) by End of Forecast Period (2035) | USD 79.9 million |
| CAGR % 2025 to End of Forecast (2035) | 9.0% |
The electrolyte markers market in the United Kingdom is expected to reach a market size of USD 79.9 million, expanding at a CAGR of 9.0% during the forecast period. There is a growing focus on preventive healthcare and early detection of diseases. Regular monitoring of electrolyte levels can help identify potential imbalances and allow for early intervention. This preventive approach to healthcare may drive the demand for electrolyte marker testing in the United Kingdom.
| Country | China |
|---|---|
| Market Size (USD Million) by End of Forecast Period (2035) | USD 88.7 million |
| CAGR % 2025 to End of Forecast (2035) | 10.1% |
The electrolyte markers market in China is anticipated to reach a market size of USD 88.7 million by the end of 2035, growing at a CAGR of 10.1% throughout the forecast period. China has the world's largest population, which provides a substantial customer base for medical products and services. With a significant number of people in need of healthcare services, including electrolyte marker testing, the market potential in China is substantial. Like many other countries, China is experiencing a rise in the prevalence of chronic diseases such as diabetes, cardiovascular diseases, and kidney disorders. These conditions often require regular monitoring of electrolyte levels, driving the demand for electrolyte marker testing.
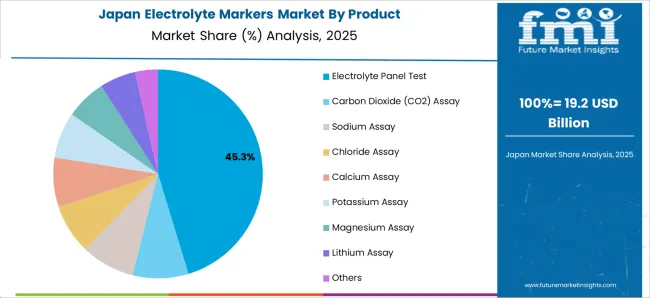
| Country | Japan |
|---|---|
| Market Size (USD Million) by End of Forecast Period (2035) | USD 68.0 million |
| CAGR % 2025 to End of Forecast (2035) | 8.8% |
The electrolyte markers market in Japan is estimated to reach a market size of USD 68.0 million by 2035, expected to thrive at a CAGR of 8.8%. The Japanese government has been implementing various healthcare reforms to improve access to healthcare services and enhance the overall quality of care. These initiatives often involve the expansion of medical infrastructure, increased funding for healthcare, and improved healthcare coverage, which can boost the electrolyte markers market.
Japan has made significant advancements in medical technology and has a strong research and development sector. This has enabled the country to develop and adopt innovative electrolyte marker testing methods.
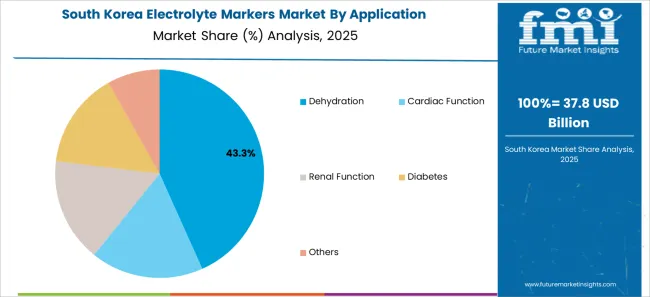
| Country | South Korea |
|---|---|
| Market Size (USD Million) by End of Forecast Period (2035) | USD 56.3 million |
| CAGR % 2025 to End of Forecast (2035) | 9.5% |
The electrolyte markers market in South Korea is expected to reach a market size of USD 56.3 million, expanding at a CAGR of 9.5% during the forecast period. South Korea has a well-developed healthcare system with modern hospitals, clinics, and medical institutions equipped with advanced diagnostic and testing technologies. This infrastructure supports efficient and accurate electrolyte marker testing, thereby increasing the demand for such markers.
Electrolyte panel test dominated the electrolyte markers market with a market share of 33.2% in 2025. The electrolyte panel allows healthcare providers to evaluate multiple electrolyte levels simultaneously. This provides a more complete assessment of the body's electrolyte balance, allowing for a more accurate diagnosis and appropriate treatment.
Electrolyte imbalances can have significant clinical implications. They can affect various bodily functions, including nerve and muscle function, fluid balance, and acid-base balance. The electrolyte panel test enables clinicians to identify and manage electrolyte disturbances promptly, potentially preventing complications and guiding appropriate treatment.
Based on application, dehydration segment has dominated the category withholding the significant share of the market at around 33.6% at the end of 2025. Monitoring electrolyte markers during dehydration management helps guide treatment interventions.
Rehydration strategies may involve the administration of oral or intravenous fluids, which can be tailored based on the specific electrolyte imbalances detected. By tracking electrolyte levels, healthcare providers can make informed decisions regarding the type and amount of fluids to administer for effective rehydration.
By sample specimen, plasma segment is expected to continue leading the market over a CAGR of 8.7% throughout the projected timeframe. Collecting plasma samples is a routine and less intrusive operation.
Blood samples can be easily collected through venipuncture and processed to separate plasma from other blood components. This ease and familiarity make plasma a convenient sample for electrolyte assessment or electrolyte imbalance in the body.
The clinical laboratory has led the electrolyte markers market as the leading end user with the market share of 55.3% in 2025. Clinical laboratories offer a broad spectrum of tests, including routine blood tests and specialized panels.
Electrolyte markers are routinely included in comprehensive metabolic panels (CMPs) and basic metabolic panels (BMPs), which are commonly ordered by healthcare providers for assessing patients' overall health status. Additionally, clinical laboratories can perform individual electrolyte assays to evaluate specific electrolyte imbalances or monitor patients with certain medical conditions.
The manufacturers in the electrolyte markers market employ a combination of product development, strategic partnerships, market expansion, acquisitions, customer-centric approach, marketing initiatives, and quality assurance strategies to gain a competitive edge and drive growth in the industry.
Key Strategies Used by the Participants
Product Innovation
Key players continuously invest in research and development to introduce innovative products. They strive to develop assays with improved sensitivity, specificity, accuracy, and ease of use.
Strategic Partnerships and Collaborations
Key players often form strategic partnerships and collaborations with other companies, research institutions, and healthcare organizations. These partnerships can lead to knowledge sharing, joint product development, and expanded market reach.
Expansion into Emerging Markets
Expanding into emerging markets with growing healthcare infrastructure and rising demand for electrolyte markers allows companies to tap into new opportunities and gain a competitive edge.
Mergers and Acquisitions
Companies in the market may engage in mergers or acquisitions to streamline their product portfolio, obtain new technologies, enter new market niches, and gain access to novel products or intellectual property.
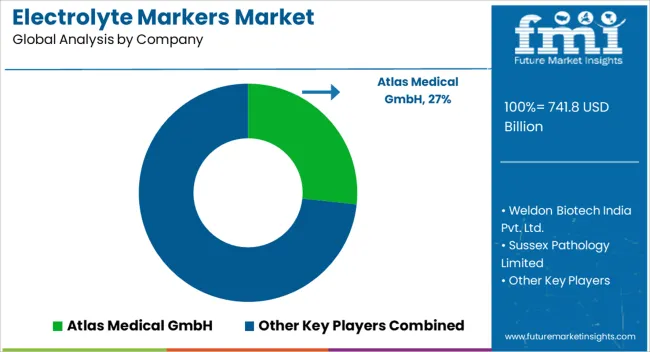
Key Developments in the Electrolyte Markers Market:
The global electrolyte markers market is estimated to be valued at USD 741.8 billion in 2025.
The market size for the electrolyte markers market is projected to reach USD 1,670.2 billion by 2035.
The electrolyte markers market is expected to grow at a 8.5% CAGR between 2025 and 2035.
The key product types in electrolyte markers market are electrolyte panel test, carbon dioxide (co2) assay, sodium assay, chloride assay, calcium assay, potassium assay, magnesium assay, lithium assay and others.
In terms of application, dehydration segment to command 42.9% share in the electrolyte markers market in 2025.


Full Research Suite comprises of:
Market outlook & trends analysis
Interviews & case studies
Strategic recommendations
Vendor profiles & capabilities analysis
5-year forecasts
8 regions and 60+ country-level data splits
Market segment data splits
12 months of continuous data updates
DELIVERED AS:
PDF EXCEL ONLINE
Electrolyte Drinks Market Size and Share Forecast Outlook 2025 to 2035
Feed Electrolytes Market Size and Share Forecast Outlook 2025 to 2035
Solid Electrolyte Market
Battery Electrolytes Market Analysis & Forecast by Type, End-Use, and Region through 2035
Lithium & Lithium-ion Battery Electrolyte Market Size and Share Forecast Outlook 2025 to 2035
Lithium and Lithium Ion Battery Electrolyte Market Analysis - Size, Share, and Forecast Outlook 2025 to 2035
Demand for Lithium & Lithium-ion Battery Electrolyte in EU Size and Share Forecast Outlook 2025 to 2035
EPO Biomarkers Market Size and Share Forecast Outlook 2025 to 2035
Hepatic Markers Market Size and Share Forecast Outlook 2025 to 2035
Utility Markers Market Size and Share Forecast Outlook 2025 to 2035
Imaging Markers Market Analysis - Size, Share, and Forecast Outlook 2025 to 2035
Diabetic Markers Market Size and Share Forecast Outlook 2025 to 2035
Fiducial Markers Market - Demand, Growth & Forecast 2025 to 2035
Vitamin Biomarkers Market Size and Share Forecast Outlook 2025 to 2035
Coagulation Markers Market Trends - Growth, Demand & Forecast 2025 to 2035
Cell Surface Markers Detection Market Size and Share Forecast Outlook 2025 to 2035
Molecular Biomarkers For Cancer Detection Market Size and Share Forecast Outlook 2025 to 2035
Inflammatory Markers Market
Chronic Phase Markers Market Size and Share Forecast Outlook 2025 to 2035
Prognostic Biomarkers Market

Thank you!
You will receive an email from our Business Development Manager. Please be sure to check your SPAM/JUNK folder too.
Chat With
MaRIA