Electric Chicken Scalder Market Outlook

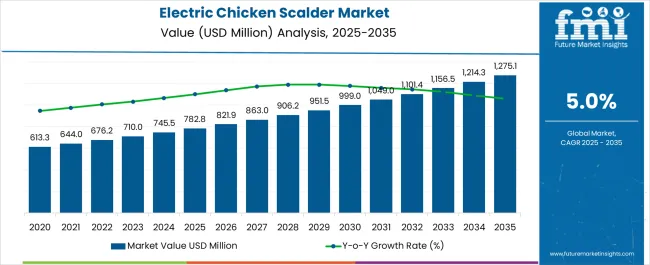
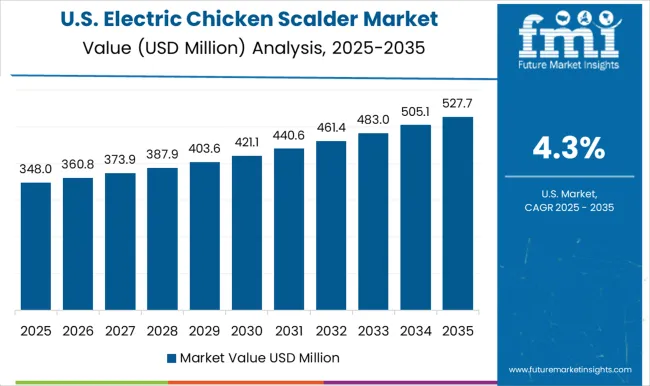
The electric chicken scalder market size is projected to rise from US$ 710 million in 2023 and it is expected to surpass US$ 1,157 million by 2033. The demand for electric chicken scalders is expected to rise at a CAGR of 5% during the forecast period.

Some prominent factors driving revenue from the sales of electric chicken scalders are:

  • The sales of electric chicken scalder have been growing in recent years, driven by a variety of factors. One of the key drivers of this trend is increased awareness and concern for animal welfare.
  • As consumers become more informed about the treatment of animals in the food industry, they are increasingly choosing products that are produced using humane methods, such as electric chicken scalder.
  • Governments around the world are starting to recognize the benefits of humane methods of slaughter and are implementing regulations and incentives to encourage farmers and processors to switch to these methods.
  • Economic factors also play a role in the adoption of electric chicken scalder. As the technology improves and becomes more widely available, the cost of electric scalder is decreasing, making it more affordable for farmers and processors.
  • Environmental concerns are also driving the adoption of electric chicken scalder. Electric scalder is considered to be more environmentally friendly than traditional methods of slaughter, as it generates less greenhouse gas emissions and generates less waste.
  • There is an increasing demand for organic and humanely raised poultry, which is another factor driving the adoption of electric chicken scalder.

Don't pay for what you don't need

Customize your report by selecting specific countries or regions and save 30%!

Latest Trend in the Market: Sustainable and Efficient Electric Chicken Scalder

The market for electric chicken scalder is growing at a steady pace, driven by several key factors. Increased demand for sustainable and eco-friendly products is a prominent driver of the electric chicken scalder industry. Electric chicken scalders are considered more environmentally friendly than traditional gas-powered scalders, as they do not produce emissions or require fuel. This is particularly important as consumers and businesses alike are becoming more conscious of their impact on the environment and are looking to make more sustainable choices.

Rising Labor Costs and Technological Advancements to Drive Adoption of Electric Chicken Scalder

One of the prominent sales driver of electric chicken scalder is rising labor costs. Electric chicken scalders are often more efficient and require less labor to operate, which can help reduce labor costs for manufacturers. In addition, advancements in technology have led to the development of newer and more advanced electric chicken scalder models with better features, improved efficiency, and reduced maintenance costs.

Government initiatives and regulations to promote the use of energy-efficient equipment are also anticipated to boost the adoption of electric chicken scalder during the forecast period. These factors are making electric chicken scalder an attractive investment opportunity for companies looking to tap into the growing market.

Report Attributes Details
Electric Chicken Scalder Market Value (2023) US$ 710 million
Electric Chicken Scalder Market CAGR (2023 to 2033) 5%
Anticipated Electric Chicken Scalder Market Value (2033) US$ 1,157 million
Nandini Roy Choudhury

Principal Consultant

Talk to Analyst

Find your sweet spots for generating winning opportunities in this market.

Historical Outlook 2017 to 2022 Vs Future Forecasts for Electric Chicken Scalder Market

According to Future Market Insights, the electric chicken scalders industry has been on a steady growth trajectory, with a CAGR of 4.5% from US$ 543.3 million in 2017 to US$ 677.05 million in 2022. This growth can be attributed to several key factors, including the increasing demand for improved processed meat driven by the growth of fast food and restaurant chains, as well as rising per capita income and consumer preferences for food with added value.

Profit margins for manufacturers of electric chicken scalders are closely tied to technological advancements in the food processing sector. These advancements, such as integrating all process equipment into a single component, aim to reduce labor requirements and improve cleanliness.

Attribute Valuation
2025 US$ 782.77 million
2028 US$ 906.16 million
2032 US$ 1101.44 million

The market is anticipated to rise at a CAGR of 5% from 2023 to 2033, surpassing US$ 1,157 million by 2033.

  • Short term (2022 to 2025): The market is expected to see increased demand as a result of the growing consumption of processed poultry and convenience meals.
  • Medium term (2025 to 2028): The market is predicted to benefit from the rise of small and medium-sized enterprises in emerging nations that require pre-processed poultry products to meet the demands of their customers and adhere to stringent food safety and hygiene standards.
  • Long term (2028 to 2032): The market is expected to see continued growth driven by the development of automated electric chicken scalders, which are more effective and humane than manual defeathering. In addition, the rising importance of food safety and cleanliness is anticipated to further drive the demand for electric chicken scalders.

Category-wise Insights

Automation Leads the Way: The Rise of Automatic Electric Chicken Scalder

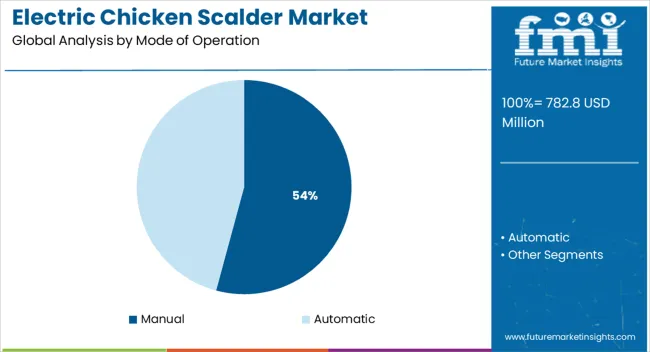
Automatic electric chicken scalder is the leading segment in the market with a share of 45% during the forecast period. The growth of this segment can be attributed to the increasing demand for automated and efficient processing of poultry products in the commercial sector. Automated electric chicken scalders are more effective and humane than manual defeathering and are capable of handling high volumes of poultry products.

Commercial Sector Dominates: The Growth of Electric Chicken Scalder in the Commercial Application

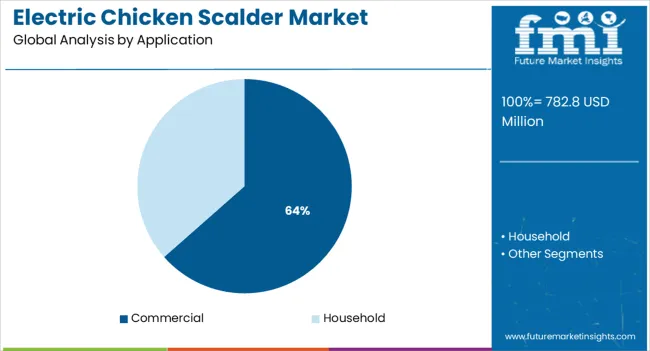
Commercial electric chicken scalder is the leading segment in the market with a share of 35% during the forecast period. The growth of this segment can be attributed to the increasing consumption of processed poultry products in the commercial sector, such as fast-food chains and restaurants. In addition, the rise of small and medium-sized enterprises in emerging nations that require pre-processed poultry products to meet the demands of their customers and adhere to stringent food safety and hygiene standards also drives the demand for commercial electric chicken scalder.

Retail Sales on the Rise: The Convenience of Purchasing Electric Chicken Scalder in Retail Outlets

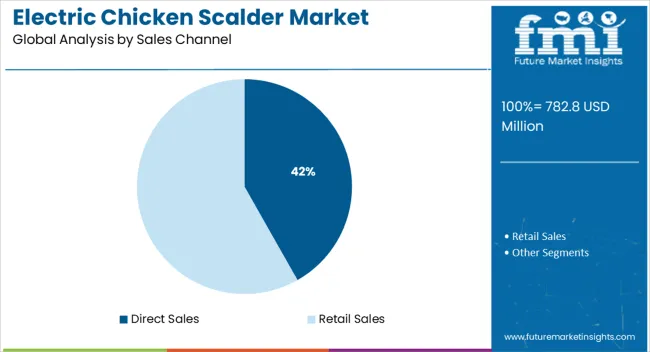
The retail sales channel is the leading segment in the market with a share of 30% during the forecast period. The growth of this segment can be attributed to the increasing awareness among consumers about the benefits of electric chicken scalders and the convenience of purchasing them through retail channels. In addition, the widespread availability of electric chicken scalders in various retail outlets across the globe also drives the demand for retail sales of electric chicken scalder.
Get the data you need at a Fraction of the cost

Personalize your report by choosing insights you need
and save 40%!

Country-wise Insights

Country The United States
Market Share (2023 to 2033) 30.6%
Market Value by 2033 (in US million) 206.7
Country Germany
Market Share (2023 to 2033) 18.4%
Market Value by 2033 (in US million) 164.4
Country United Kingdom
Market Share (2023 to 2033) 5.4%
Market Value by 2033 (in US million) 101.2
Country China
Market Share (2023 to 2033) 9.1%
Market Value by 2033 (in US million) 91.0
Country Japan
Market Share (2023 to 2033) 5.3%
Market Value by 2033 (in US million) 35.9

United States to Lead the Electric Chicken Scalder Industry Holding a Share of 30.6% from 2023 to 2033

The United States electric chicken scalder market is anticipated to surpass US$ 206.7 million by 2033, accounting for a 30.6% share during the forecast period. This growth can be attributed to several factors, including the increasing popularity of fast food and restaurant chains, rising per capita income, and consumer preferences for food with added value.

The fast food and restaurant industry in the United States is a major contributor to the growth of the electric chicken scalder market. The increasing popularity of fast food and restaurant chains in the country is driving the demand for processed meat, which in turn is driving the demand for electric chicken scalders. Also, rising per capita income and consumer preferences for food with added value are also key factors influencing electric chicken scalder sales.

In addition, the increasing awareness about food safety and hygiene standards is also expected to drive market growth. The United States has stringent food safety regulations, and this is expected to drive the demand for electric chicken scalders as they are considered to be more hygienic and efficient than manual defeathering.

Germany Account for a Substantial Share in the European Electric Chicken Scalder Market
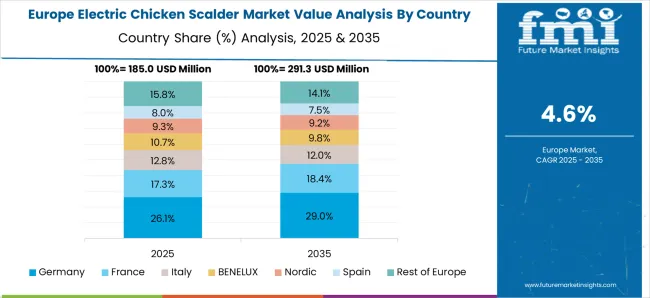
The electric chicken scalder industry in Germany is expected to be worth US$ 164.4 million by 2033, accounting for an 18.4% share during the forecast period. This can be attributed to the country's strong poultry processing industry, as well as the presence of major players in the food processing sector. Additionally, the implementation of stringent food safety and hygiene regulations in Germany is expected to drive the demand for electric chicken scalders.

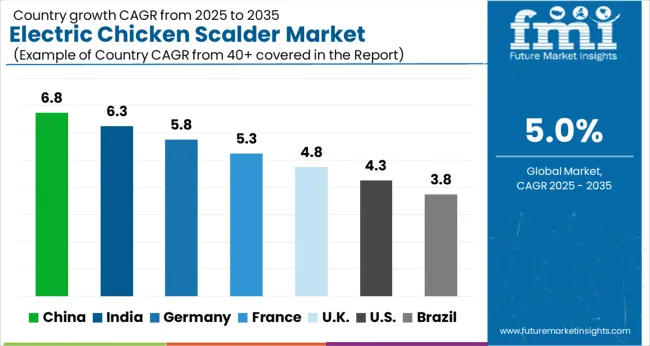
The electric chicken scalder market in the United Kingdom is expected to be worth US$ 101.2 million by 2033, growing at a CAGR of 5.4% during the forecast period. This can be attributed to several key factors, including the increasing demand for improved processed meat driven by the growth of fast food and restaurant chains, as well as rising per capita income and consumer preferences for food with added value.

Japan Electric Chicken Scalder Market Outlook

Japan's electric chicken scalder industry is to reach US$ 35.9 million by 2033, expanding at a CAGR of 5.3% over the projected period. This growth is driven by several factors, including increasing demand for poultry meat in Japan, advancements in technology and automation, and government support for the industry. One of the main drivers of growth in the electric chicken scalder industry in Japan is the increasing demand for poultry meat. As the population of Japan continues to grow and the economy improves, consumers can afford more protein-rich foods, such as chicken.

Another factor contributing to the growth of the electric chicken scalder industry in Japan is the advancements in technology and automation. These advancements have led to increased efficiency and cost savings for producers, making it more profitable for them to invest in the industry. Automation also allows for greater consistency and precision in the production process, which is important in meeting the high-quality standards of Japanese consumers.

Due to the High Demand for Electric Chicken Scalders, China to Hold a 9.1% Share by 2033

China accounts for a 9.1% share of the electric chicken scalder industry, growing at a CAGR of 4% during the forecast period. By 2033, due to high poultry meat consumption in the region, China's electric chicken scalder industry is anticipated to surpass US$ 91 million. The demand for electric chicken scalder in China is anticipated to increase as family income rises, eating habits change, and customer tastes move toward value-added items.

A significant portion of China's total agricultural production is composed of chicken production. Electric chicken scalders are extensively utilized in China as a result of strong acceptance rates for the technology and the emergence of new competitors with innovative products.

Revolutionizing the Poultry Industry: Top Electric Chicken Scalder Manufacturers Unleash Innovative Solutions for Growth

Electric chicken scalder manufacturers have adopted several innovative growth strategies to capture a larger share of the market. Some of these strategies include:
  • Investing in research and development: Manufacturers are investing heavily in research and development to develop new and improved electric chicken scalder models that are more efficient, reliable, and cost-effective. This allows them to stay ahead of the competition and offer customers a wider range of options.
  • Focusing on automation and digitalization: Manufacturers are focusing on increasing automation and digitalization to improve efficiency, reduce labor costs, and increase output. This includes using robotics and other advanced technologies to automate certain processes, as well as using data analytics and digital platforms to optimize production and supply chain management.
  • Offering customized solutions: Manufacturers are increasingly offering customized solutions to meet the specific needs of different customers. This includes offering different models and configurations of electric chicken scalder machines, as well as providing tailored maintenance and support services.
  • Expanding into new markets: Manufacturers are also looking to expand into new markets to increase their customer base and revenue. This includes exporting to other countries and targeting new segments of the market, such as small and medium-sized enterprises.

Major Manufacturers in the Electric Chicken Scalder Industry:

  • Strombergs
  • McMurray Hatchery
  • Zhucheng Xincheng Mingshun Machinery Co.,Ltd
  • Murray McMurray
  • DUTCH POULTRY TECHNOLOGY
  • Surehatch
  • The Bird Nerd
  • Marel
  • Nanjing Eruis Equipment Co.,ltd
  • Ruian Weixinli Food Machinery Co., Ltd

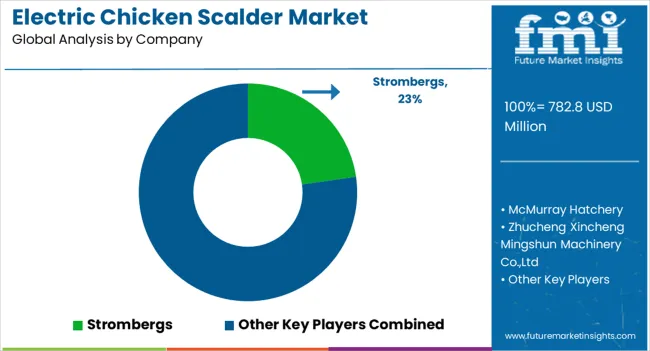
Feathers Fly as Electric Chicken Scalder Innovators Strombergs, McMurray Hatchery, and Zhucheng Xincheng Mingshun Machinery Co., Ltd Soar to the Top of the Market

Strombergs, McMurray Hatchery, and Zhucheng Xincheng Mingshun Machinery Co., Ltd are some of the leading manufacturers of electric chicken scalder machines. These companies have been at the forefront of innovation in the industry, and have contributed significantly to the growth of the market.

  • Strombergs:

The company has been known for its innovative and high-quality electric chicken scalder machines. They have developed an electric chicken scalder that uses a water-based scalder that is more efficient and sustainable than traditional oil-based models. This product innovation has helped the company to stand out in the market and capture a larger share of the market.

  • McMurray Hatchery:

McMurray Hatchery has been a leader in the electric chicken scalder industry for many years. They have developed an electric chicken scalder that uses a unique combination of heat and pressure to remove feathers quickly and effectively. This product innovation has helped McMurray Hatchery to increase its customer base and gain a larger share of the market.

  • Zhucheng Xincheng Mingshun Machinery Co.,Ltd:

The company is well-known for its electric chicken scalder machines, they have developed an electric chicken scalder with high-tech sensors that can detect and remove any feathers that were missed during the plucking process. This product innovation has helped the company to stand out in the market and increase its market share.

Key Segments Covered in the Report

By Mode of Operation:

  • Manual
  • Automatic

By Application:

  • Commercial
  • Household

By Sales Channel:

  • Direct Sales
  • Retail Sales

By Region:

  • North America
  • Latin America
  • Europe
  • Asia Pacific
  • Middle East & Africa

Frequently Asked Questions

What will be the Electric Chicken Scalder Market Size Value in 2023?

In the current year 2023, the overall market size could be around US$ 710 million.

What is the Expected CAGR for Global Demand for Electric Chicken Scalders?

Until 2033, the overall demand for electric chicken scalders could progress at 5% CAGR.

How the Global Electric Chicken Scalder Market Developed in the Past?

Between 2017 and 2022, the overall market developed at 4.5% CAGR.

What is the Key Regional Market for the Sales of Electric Chicken Scalders?

The United States currently contributes for 30.6% of the total revenue generated by the market.

Which Type of Electric Chicken Scalder is the Best Performing Product Segment?

Automatic electric chicken scalder segment accounts for 45% of global sales.

Table of Content

1. Executive Summary

        1.1. Global Market Outlook

        1.2. Demand-side Trends

        1.3. Supply-side Trends

        1.4. Technology Roadmap Analysis

        1.5. Analysis and Recommendations

2. Market Overview

        2.1. Market Coverage / Taxonomy

        2.2. Market Definition / Scope / Limitations

3. Market Background

        3.1. Market Dynamics

            3.1.1. Drivers

            3.1.2. Restraints

            3.1.3. Opportunity

            3.1.4. Trends

        3.2. Scenario Forecast

            3.2.1. Demand in Optimistic Scenario

            3.2.2. Demand in Likely Scenario

            3.2.3. Demand in Conservative Scenario

        3.3. Opportunity Map Analysis

        3.4. Product Life Cycle Analysis

        3.5. Supply Chain Analysis

            3.5.1. Supply Side Participants and their Roles

                3.5.1.1. Producers

                3.5.1.2. Mid-Level Participants (Traders/ Agents/ Brokers)

                3.5.1.3. Wholesalers and Distributors

            3.5.2. Value Added and Value Created at Node in the Supply Chain

            3.5.3. List of Raw Material Suppliers

            3.5.4. List of Existing and Potential Buyer’s

        3.6. Investment Feasibility Matrix

        3.7. Value Chain Analysis

            3.7.1. Profit Margin Analysis

            3.7.2. Wholesalers and Distributors

            3.7.3. Retailers

        3.8. PESTLE and Porter’s Analysis

        3.9. Regulatory Landscape

            3.9.1. By Key Regions

            3.9.2. By Key Countries

        3.10. Regional Parent Market Outlook

        3.11. Production and Consumption Statistics

        3.12. Import and Export Statistics

4. Global Market Analysis 2018 to 2022 and Forecast, 2023 to 2033

        4.1. Historical Market Size Value (US$ Million) & Volume (Units) Analysis, 2018 to 2022

        4.2. Current and Future Market Size Value (US$ Million) & Volume (Units) Projections, 2023 to 2033

            4.2.1. Y-o-Y Growth Trend Analysis

            4.2.2. Absolute $ Opportunity Analysis

5. Global Market Analysis 2018 to 2022 and Forecast 2023 to 2033, By Mode of Operation

        5.1. Introduction / Key Findings

        5.2. Historical Market Size Value (US$ Million) & Volume (Units) Analysis By Mode of Operation, 2018 to 2022

        5.3. Current and Future Market Size Value (US$ Million) & Volume (Units) Analysis and Forecast By Mode of Operation, 2023 to 2033

            5.3.1. Manual

            5.3.2. Automatic

        5.4. Y-o-Y Growth Trend Analysis By Mode of Operation, 2018 to 2022

        5.5. Absolute $ Opportunity Analysis By Mode of Operation, 2023 to 2033

6. Global Market Analysis 2018 to 2022 and Forecast 2023 to 2033, By Application

        6.1. Introduction / Key Findings

        6.2. Historical Market Size Value (US$ Million) & Volume (Units) Analysis By Application, 2018 to 2022

        6.3. Current and Future Market Size Value (US$ Million) & Volume (Units) Analysis and Forecast By Application, 2023 to 2033

            6.3.1. Commercial

            6.3.2. Household

        6.4. Y-o-Y Growth Trend Analysis By Application, 2018 to 2022

        6.5. Absolute $ Opportunity Analysis By Application, 2023 to 2033

7. Global Market Analysis 2018 to 2022 and Forecast 2023 to 2033, By Sales Channel

        7.1. Introduction / Key Findings

        7.2. Historical Market Size Value (US$ Million) & Volume (Units) Analysis By Sales Channel, 2018 to 2022

        7.3. Current and Future Market Size Value (US$ Million) & Volume (Units) Analysis and Forecast By Sales Channel, 2023 to 2033

            7.3.1. Direct Sales

            7.3.2. Retail Sales

        7.4. Y-o-Y Growth Trend Analysis By Sales Channel, 2018 to 2022

        7.5. Absolute $ Opportunity Analysis By Sales Channel, 2023 to 2033

8. Global Market Analysis 2018 to 2022 and Forecast 2023 to 2033, By Region

        8.1. Introduction

        8.2. Historical Market Size Value (US$ Million) & Volume (Units) Analysis By Region, 2018 to 2022

        8.3. Current Market Size Value (US$ Million) & Volume (Units) Analysis and Forecast By Region, 2023 to 2033

            8.3.1. North America

            8.3.2. Latin America

            8.3.3. Europe

            8.3.4. Asia Pacific

            8.3.5. MEA

        8.4. Market Attractiveness Analysis By Region

9. North America Market Analysis 2018 to 2022 and Forecast 2023 to 2033, By Country

        9.1. Historical Market Size Value (US$ Million) & Volume (Units) Trend Analysis By Market Taxonomy, 2018 to 2022

        9.2. Market Size Value (US$ Million) & Volume (Units) Forecast By Market Taxonomy, 2023 to 2033

            9.2.1. By Country

                9.2.1.1. USA

                9.2.1.2. Canada

            9.2.2. By Mode of Operation

            9.2.3. By Application

            9.2.4. By Sales Channel

        9.3. Market Attractiveness Analysis

            9.3.1. By Country

            9.3.2. By Mode of Operation

            9.3.3. By Application

            9.3.4. By Sales Channel

        9.4. Key Takeaways

10. Latin America Market Analysis 2018 to 2022 and Forecast 2023 to 2033, By Country

        10.1. Historical Market Size Value (US$ Million) & Volume (Units) Trend Analysis By Market Taxonomy, 2018 to 2022

        10.2. Market Size Value (US$ Million) & Volume (Units) Forecast By Market Taxonomy, 2023 to 2033

            10.2.1. By Country

                10.2.1.1. Brazil

                10.2.1.2. Mexico

                10.2.1.3. Rest of Latin America

            10.2.2. By Mode of Operation

            10.2.3. By Application

            10.2.4. By Sales Channel

        10.3. Market Attractiveness Analysis

            10.3.1. By Country

            10.3.2. By Mode of Operation

            10.3.3. By Application

            10.3.4. By Sales Channel

        10.4. Key Takeaways

11. Europe Market Analysis 2018 to 2022 and Forecast 2023 to 2033, By Country

        11.1. Historical Market Size Value (US$ Million) & Volume (Units) Trend Analysis By Market Taxonomy, 2018 to 2022

        11.2. Market Size Value (US$ Million) & Volume (Units) Forecast By Market Taxonomy, 2023 to 2033

            11.2.1. By Country

                11.2.1.1. Germany

                11.2.1.2. United kingdom

                11.2.1.3. France

                11.2.1.4. Spain

                11.2.1.5. Italy

                11.2.1.6. Rest of Europe

            11.2.2. By Mode of Operation

            11.2.3. By Application

            11.2.4. By Sales Channel

        11.3. Market Attractiveness Analysis

            11.3.1. By Country

            11.3.2. By Mode of Operation

            11.3.3. By Application

            11.3.4. By Sales Channel

        11.4. Key Takeaways

12. Asia Pacific Market Analysis 2018 to 2022 and Forecast 2023 to 2033, By Country

        12.1. Historical Market Size Value (US$ Million) & Volume (Units) Trend Analysis By Market Taxonomy, 2018 to 2022

        12.2. Market Size Value (US$ Million) & Volume (Units) Forecast By Market Taxonomy, 2023 to 2033

            12.2.1. By Country

                12.2.1.1. China

                12.2.1.2. Japan

                12.2.1.3. South Korea

                12.2.1.4. Singapore

                12.2.1.5. Thailand

                12.2.1.6. Indonesia

                12.2.1.7. Australia

                12.2.1.8. New Zealand

                12.2.1.9. Rest of Asia Pacific

            12.2.2. By Mode of Operation

            12.2.3. By Application

            12.2.4. By Sales Channel

        12.3. Market Attractiveness Analysis

            12.3.1. By Country

            12.3.2. By Mode of Operation

            12.3.3. By Application

            12.3.4. By Sales Channel

        12.4. Key Takeaways

13. MEA Market Analysis 2018 to 2022 and Forecast 2023 to 2033, By Country

        13.1. Historical Market Size Value (US$ Million) & Volume (Units) Trend Analysis By Market Taxonomy, 2018 to 2022

        13.2. Market Size Value (US$ Million) & Volume (Units) Forecast By Market Taxonomy, 2023 to 2033

            13.2.1. By Country

                13.2.1.1. GCC Countries

                13.2.1.2. South Africa

                13.2.1.3. Israel

                13.2.1.4. Rest of MEA

            13.2.2. By Mode of Operation

            13.2.3. By Application

            13.2.4. By Sales Channel

        13.3. Market Attractiveness Analysis

            13.3.1. By Country

            13.3.2. By Mode of Operation

            13.3.3. By Application

            13.3.4. By Sales Channel

        13.4. Key Takeaways

14. Key Countries Market Analysis

        14.1. USA

            14.1.1. Pricing Analysis

            14.1.2. Market Share Analysis, 2022

                14.1.2.1. By Mode of Operation

                14.1.2.2. By Application

                14.1.2.3. By Sales Channel

        14.2. Canada

            14.2.1. Pricing Analysis

            14.2.2. Market Share Analysis, 2022

                14.2.2.1. By Mode of Operation

                14.2.2.2. By Application

                14.2.2.3. By Sales Channel

        14.3. Brazil

            14.3.1. Pricing Analysis

            14.3.2. Market Share Analysis, 2022

                14.3.2.1. By Mode of Operation

                14.3.2.2. By Application

                14.3.2.3. By Sales Channel

        14.4. Mexico

            14.4.1. Pricing Analysis

            14.4.2. Market Share Analysis, 2022

                14.4.2.1. By Mode of Operation

                14.4.2.2. By Application

                14.4.2.3. By Sales Channel

        14.5. Germany

            14.5.1. Pricing Analysis

            14.5.2. Market Share Analysis, 2022

                14.5.2.1. By Mode of Operation

                14.5.2.2. By Application

                14.5.2.3. By Sales Channel

        14.6. United kingdom

            14.6.1. Pricing Analysis

            14.6.2. Market Share Analysis, 2022

                14.6.2.1. By Mode of Operation

                14.6.2.2. By Application

                14.6.2.3. By Sales Channel

        14.7. France

            14.7.1. Pricing Analysis

            14.7.2. Market Share Analysis, 2022

                14.7.2.1. By Mode of Operation

                14.7.2.2. By Application

                14.7.2.3. By Sales Channel

        14.8. Spain

            14.8.1. Pricing Analysis

            14.8.2. Market Share Analysis, 2022

                14.8.2.1. By Mode of Operation

                14.8.2.2. By Application

                14.8.2.3. By Sales Channel

        14.9. Italy

            14.9.1. Pricing Analysis

            14.9.2. Market Share Analysis, 2022

                14.9.2.1. By Mode of Operation

                14.9.2.2. By Application

                14.9.2.3. By Sales Channel

        14.10. China

            14.10.1. Pricing Analysis

            14.10.2. Market Share Analysis, 2022

                14.10.2.1. By Mode of Operation

                14.10.2.2. By Application

                14.10.2.3. By Sales Channel

        14.11. Japan

            14.11.1. Pricing Analysis

            14.11.2. Market Share Analysis, 2022

                14.11.2.1. By Mode of Operation

                14.11.2.2. By Application

                14.11.2.3. By Sales Channel

        14.12. South Korea

            14.12.1. Pricing Analysis

            14.12.2. Market Share Analysis, 2022

                14.12.2.1. By Mode of Operation

                14.12.2.2. By Application

                14.12.2.3. By Sales Channel

        14.13. Singapore

            14.13.1. Pricing Analysis

            14.13.2. Market Share Analysis, 2022

                14.13.2.1. By Mode of Operation

                14.13.2.2. By Application

                14.13.2.3. By Sales Channel

        14.14. Thailand

            14.14.1. Pricing Analysis

            14.14.2. Market Share Analysis, 2022

                14.14.2.1. By Mode of Operation

                14.14.2.2. By Application

                14.14.2.3. By Sales Channel

        14.15. Indonesia

            14.15.1. Pricing Analysis

            14.15.2. Market Share Analysis, 2022

                14.15.2.1. By Mode of Operation

                14.15.2.2. By Application

                14.15.2.3. By Sales Channel

        14.16. Australia

            14.16.1. Pricing Analysis

            14.16.2. Market Share Analysis, 2022

                14.16.2.1. By Mode of Operation

                14.16.2.2. By Application

                14.16.2.3. By Sales Channel

        14.17. New Zealand

            14.17.1. Pricing Analysis

            14.17.2. Market Share Analysis, 2022

                14.17.2.1. By Mode of Operation

                14.17.2.2. By Application

                14.17.2.3. By Sales Channel

        14.18. GCC Countries

            14.18.1. Pricing Analysis

            14.18.2. Market Share Analysis, 2022

                14.18.2.1. By Mode of Operation

                14.18.2.2. By Application

                14.18.2.3. By Sales Channel

        14.19. South Africa

            14.19.1. Pricing Analysis

            14.19.2. Market Share Analysis, 2022

                14.19.2.1. By Mode of Operation

                14.19.2.2. By Application

                14.19.2.3. By Sales Channel

        14.20. Israel

            14.20.1. Pricing Analysis

            14.20.2. Market Share Analysis, 2022

                14.20.2.1. By Mode of Operation

                14.20.2.2. By Application

                14.20.2.3. By Sales Channel

15. Market Structure Analysis

        15.1. Competition Dashboard

        15.2. Competition Benchmarking

        15.3. Market Share Analysis of Top Players

            15.3.1. By Regional

            15.3.2. By Mode of Operation

            15.3.3. By Application

            15.3.4. By Sales Channel

16. Competition Analysis

        16.1. Competition Deep Dive

            16.1.1. Strombergs

                16.1.1.1. Overview

                16.1.1.2. Product Portfolio

                16.1.1.3. Profitability by Market Segments

                16.1.1.4. Sales Footprint

                16.1.1.5. Strategy Overview

                    16.1.1.5.1. Marketing Strategy

                    16.1.1.5.2. Product Strategy

                    16.1.1.5.3. Channel Strategy

            16.1.2. McMurray Hatchery

                16.1.2.1. Overview

                16.1.2.2. Product Portfolio

                16.1.2.3. Profitability by Market Segments

                16.1.2.4. Sales Footprint

                16.1.2.5. Strategy Overview

                    16.1.2.5.1. Marketing Strategy

                    16.1.2.5.2. Product Strategy

                    16.1.2.5.3. Channel Strategy

            16.1.3. Zhucheng Xincheng Mingshun Machinery Co.,Ltd

                16.1.3.1. Overview

                16.1.3.2. Product Portfolio

                16.1.3.3. Profitability by Market Segments

                16.1.3.4. Sales Footprint

                16.1.3.5. Strategy Overview

                    16.1.3.5.1. Marketing Strategy

                    16.1.3.5.2. Product Strategy

                    16.1.3.5.3. Channel Strategy

            16.1.4. Murray McMurray

                16.1.4.1. Overview

                16.1.4.2. Product Portfolio

                16.1.4.3. Profitability by Market Segments

                16.1.4.4. Sales Footprint

                16.1.4.5. Strategy Overview

                    16.1.4.5.1. Marketing Strategy

                    16.1.4.5.2. Product Strategy

                    16.1.4.5.3. Channel Strategy

            16.1.5. DUTCH POULTRY TECHNOLOGY

                16.1.5.1. Overview

                16.1.5.2. Product Portfolio

                16.1.5.3. Profitability by Market Segments

                16.1.5.4. Sales Footprint

                16.1.5.5. Strategy Overview

                    16.1.5.5.1. Marketing Strategy

                    16.1.5.5.2. Product Strategy

                    16.1.5.5.3. Channel Strategy

            16.1.6. Surehatch

                16.1.6.1. Overview

                16.1.6.2. Product Portfolio

                16.1.6.3. Profitability by Market Segments

                16.1.6.4. Sales Footprint

                16.1.6.5. Strategy Overview

                    16.1.6.5.1. Marketing Strategy

                    16.1.6.5.2. Product Strategy

                    16.1.6.5.3. Channel Strategy

            16.1.7. The Bird Nerd

                16.1.7.1. Overview

                16.1.7.2. Product Portfolio

                16.1.7.3. Profitability by Market Segments

                16.1.7.4. Sales Footprint

                16.1.7.5. Strategy Overview

                    16.1.7.5.1. Marketing Strategy

                    16.1.7.5.2. Product Strategy

                    16.1.7.5.3. Channel Strategy

            16.1.8. Marel

                16.1.8.1. Overview

                16.1.8.2. Product Portfolio

                16.1.8.3. Profitability by Market Segments

                16.1.8.4. Sales Footprint

                16.1.8.5. Strategy Overview

                    16.1.8.5.1. Marketing Strategy

                    16.1.8.5.2. Product Strategy

                    16.1.8.5.3. Channel Strategy

            16.1.9. Nanjing Eruis Equipment Co.,ltd

                16.1.9.1. Overview

                16.1.9.2. Product Portfolio

                16.1.9.3. Profitability by Market Segments

                16.1.9.4. Sales Footprint

                16.1.9.5. Strategy Overview

                    16.1.9.5.1. Marketing Strategy

                    16.1.9.5.2. Product Strategy

                    16.1.9.5.3. Channel Strategy

            16.1.10. Ruian Weixinli Food Machinery Co., Ltd.

                16.1.10.1. Overview

                16.1.10.2. Product Portfolio

                16.1.10.3. Profitability by Market Segments

                16.1.10.4. Sales Footprint

                16.1.10.5. Strategy Overview

                    16.1.10.5.1. Marketing Strategy

                    16.1.10.5.2. Product Strategy

                    16.1.10.5.3. Channel Strategy

17. Assumptions & Acronyms Used

18. Research Methodology

Recommendations

Process Automation

Chicken Plucking Machine Market

January 2023

REP-GB-16154

309 pages

Industrial Automation

Chicken Feeder and Drinkers Market

December 2022

REP-GB-16299

322 pages

Explore Process Automation Insights

View Reports
Future Market Insights

Electric Chicken Scalder Market

Schedule a Call