The global eldercare assistive robots market is valued at USD 3.2 billion in 2025. It is slated to reach USD 10.2 billion by 2035, recording an absolute increase of USD 7.0 billion over the forecast period. This translates into a total growth of 218.8%, with the market forecast to expand at a CAGR of 12.4% between 2025 and 2035. The overall market size is expected to grow by nearly 3.19X during the same period, supported by increasing aging population and caregiver shortages, growing adoption of artificial intelligence and mobility assistance technologies, expanding home care preferences and aging-in-place initiatives, and rising emphasis on maintaining independence and quality of life for elderly populations across diverse residential, institutional, and community care applications.
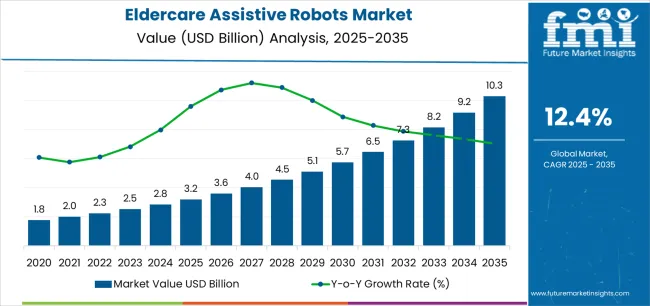
Between 2025 and 2030, the eldercare assistive robots market is projected to expand from USD 3.2 billion to USD 5.8 billion, resulting in a value increase of USD 2.6 billion, which represents 37.1% of the total forecast growth for the decade. This phase of development will be shaped by increasing caregiver workforce shortages and rising long-term care costs, rising adoption of AI-powered companion robots and mobility assistance devices, and growing demand for fall prevention systems and medication adherence technologies in residential and institutional care settings. Healthcare providers and senior living operators are expanding their assistive robotics capabilities to address the growing demand for scalable and cost-effective care solutions that ensure resident safety and operational efficiency.
| Metric | Value |
|---|---|
| Estimated Value in (2025E) | USD 3.2 billion |
| Forecast Value in (2035F) | USD 10.2 billion |
| Forecast CAGR (2025 to 2035) | 12.4% |
From 2030 to 2035, the market is forecast to grow from USD 5.8 billion to USD 10.2 billion, adding another USD 4.4 billion, which constitutes 62.9% of the overall ten-year expansion. This period is expected to be characterized by the expansion of reimbursement programs and insurance coverage for assistive robotics, the development of integrated smart home ecosystems and telehealth connectivity, and the growth of subscription-based rental models and community-sharing programs for eldercare robots. The growing adoption of advanced sensor technologies and machine learning algorithms will drive demand for eldercare assistive robots with enhanced autonomy and personalized care capabilities.
Between 2020 and 2025, the eldercare assistive robots market experienced steady growth, driven by increasing recognition of demographic challenges posed by aging populations and growing awareness of assistive robotics as essential technologies for addressing caregiver shortages and enhancing quality of life in diverse home care and institutional care applications. The market developed as healthcare administrators and family caregivers recognized the potential for robotic assistance technology to improve care delivery efficiency, reduce caregiver burden, and support aging-in-place objectives while meeting safety and independence requirements. Technological advancement in mobility assistance and social interaction capabilities began emphasizing the critical importance of maintaining elderly independence and emotional well-being in challenging care environments.
Market expansion is being supported by the increasing global aging population and declining caregiver workforce availability driven by demographic transitions and healthcare labor shortages, alongside the corresponding need for advanced care technologies that can enhance elderly independence, enable personalized assistance, and maintain quality of life across various home care, senior living, rehabilitation, and community care applications. Modern healthcare providers and family caregivers are increasingly focused on implementing assistive robotics solutions that can improve care delivery efficiency, reduce physical strain on caregivers, and provide consistent support in demanding eldercare situations.
The growing emphasis on aging-in-place preferences and independent living is driving demand for eldercare assistive robots that can support daily living activities, enable remote monitoring and health management, and ensure comprehensive safety and social engagement. Healthcare organizations' preference for care technologies that combine functional effectiveness with user acceptance and cost-efficiency is creating opportunities for innovative assistive robotics implementations. The rising influence of artificial intelligence advancement and smart home integration is also contributing to increased adoption of eldercare assistive robots that can provide superior assistance capabilities without compromising user dignity or privacy.
The market is segmented by type, application, form factor, and region. By type, the market is divided into physically assistive robots and socially assistive robots. Based on application, the market is categorized into home care / aging-in-place, senior living facilities (assisted living & nursing homes), hospitals & rehabilitation centers, and community & day-care programs / others. By form factor, the market includes mobile/wheeled service robots, wearable exoskeletons & gait-assist, pet/companion robots (zoomorphic & small humanoids), and stationary/ambient assist systems. Regionally, the market is divided into Asia Pacific, North America, Europe, Latin America, and Middle East & Africa.
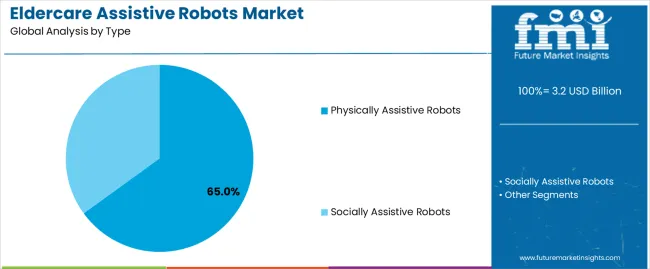
The physically assistive robots segment is projected to maintain its leading position in the eldercare assistive robots market in 2025 with a 65.0% market share, reaffirming its role as the preferred robot category for mobility assistance, lifting support, and activities of daily living applications. Healthcare providers and family caregivers increasingly utilize physically assistive robots for their superior functional support capabilities, excellent mobility enhancement characteristics, and proven effectiveness in reducing fall risks while maintaining elderly independence and dignity. Physically assistive robotics technology's proven effectiveness and application versatility directly address the eldercare industry requirements for safe patient handling and functional independence support across diverse home care platforms and institutional care environments.
This robot type segment forms the foundation of modern eldercare assistance, as it represents the technology with the greatest contribution to caregiver burden reduction and established safety record across multiple care applications and elderly user populations. Healthcare sector investments in mobility assistance technologies continue to strengthen adoption among care providers and family caregivers. With demographic pressures requiring enhanced care efficiency and improved safety outcomes, physically assistive robots align with both operational objectives and quality-of-care requirements, making them the central component of comprehensive eldercare assistance strategies.
The socially assistive robots segment maintains a 35.0% market share, addressing emotional well-being, cognitive stimulation, medication reminders, and companionship needs through conversational AI interfaces, interactive displays, and behavioral monitoring capabilities. These robots serve critical roles in addressing social isolation, supporting cognitive health maintenance, and providing consistent engagement for elderly individuals living alone or experiencing limited social interaction in residential and facility care settings.
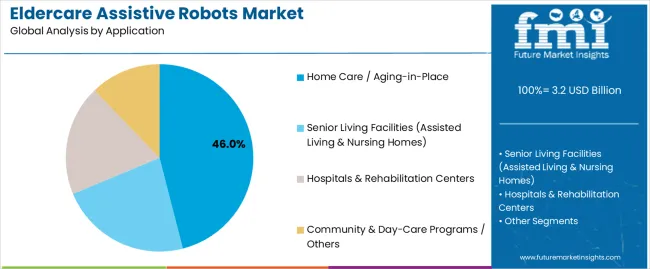
The home care / aging-in-place application segment is projected to represent the largest share of eldercare assistive robots demand in 2025 with a 46.0% market share, underscoring its critical role as the primary driver for assistive robotics adoption across private residences, independent living situations, and family caregiver support applications. Elderly individuals and family caregivers prefer assistive robots for home care due to their exceptional independence preservation benefits, aging-in-place enablement capabilities, and ability to support daily living activities while reducing caregiver burden and ensuring safety monitoring. Positioned as essential technologies for maintaining elderly autonomy, home care assistive robots offer both functional assistance and peace-of-mind benefits.
The segment is supported by continuous innovation in compact robot designs and the growing availability of affordable consumer-oriented assistive robots that enable superior home integration with enhanced user acceptance and reduced installation complexity. The families and healthcare agencies are investing in comprehensive home care robotics programs to support increasingly prevalent aging-in-place preferences and chronic care management requirements. As elderly populations express stronger preferences for remaining in familiar home environments and family caregivers seek scalable support solutions, the home care / aging-in-place application will continue to dominate the market while supporting advanced assistive technology utilization and quality-of-life optimization strategies.
Senior living facilities (assisted living & nursing homes) represent 28.0% of market demand, driven by staff efficiency requirements, consistent care delivery needs, and resident safety monitoring across institutional care environments. Hospitals & rehabilitation centers account for 20.0%, supported by post-surgical recovery support, physical therapy assistance, and short-term rehabilitation applications. Community & day-care programs / others comprise 6.0% of market demand, encompassing adult day care centers, community senior centers, and outpatient care programs requiring temporary or shared assistive robotics resources.
The eldercare assistive robots market is advancing steadily due to increasing demand for care workforce augmentation driven by caregiver shortages and growing adoption of artificial intelligence technologies that require robotic platforms providing enhanced assistance capabilities and quality-of-life improvements across diverse home care, institutional care, rehabilitation, and community care applications. The market faces challenges, including high initial acquisition costs limiting consumer adoption, user acceptance barriers among elderly populations unfamiliar with technology, and regulatory uncertainty regarding liability and safety standards for autonomous care robots. Innovation in affordable subscription models and intuitive user interfaces continues to influence product development and market expansion patterns.
The growing global elderly population combined with declining professional caregiver availability is driving demand for scalable assistive robotics solutions that address critical care capacity gaps including overnight monitoring, repetitive assistance tasks, and consistent medication management. Eldercare facilities and home care agencies face unprecedented staffing challenges as caregiver-to-resident ratios deteriorate and recruitment becomes increasingly difficult across developed economies. Healthcare administrators and government aging agencies are increasingly recognizing the essential role of assistive robotics for maintaining adequate care standards and preventing caregiver burnout, creating opportunities for robot deployments specifically designed to augment human caregivers and extend limited workforce capacity across multiple care settings.
Modern eldercare assistive robot manufacturers are incorporating advanced AI algorithms and machine learning capabilities to enhance personalization, adapt to individual user preferences, and support comprehensive care objectives through predictive health monitoring and behavioral pattern recognition. Leading companies are developing cognitive AI systems with natural language processing, implementing fall risk prediction algorithms and medication adherence coaching, and advancing technologies that learn individual routines and provide proactive assistance interventions. These technologies improve care quality while enabling new market opportunities, including chronic disease management support, mental health monitoring, and intelligent emergency response. Advanced AI integration also allows care providers to support comprehensive health outcomes and preventive care strategies beyond traditional reactive assistance approaches.
The expansion of government aging programs, healthcare insurer pilot projects, and long-term care reimbursement initiatives is driving demand for clinically validated assistive robots that meet regulatory standards and demonstrate measurable outcomes in fall prevention, caregiver efficiency, and quality-of-life metrics. These reimbursement developments create favorable economic conditions for wider assistive robotics adoption by reducing out-of-pocket costs for consumers and providing sustainable revenue models for manufacturers, creating mainstream market segments with improved affordability propositions. Manufacturers are investing in clinical evidence generation and regulatory compliance capabilities to serve emerging reimbursement-eligible applications while supporting broader market accessibility and healthcare system integration.
| Country | CAGR (2025-2035) |
|---|---|
| India | 13.1% |
| China | 12.8% |
| Japan | 12.1% |
| United States | 11.5% |
| South Korea | 11.2% |
| Germany | 10.4% |
| United Kingdom | 10.1% |
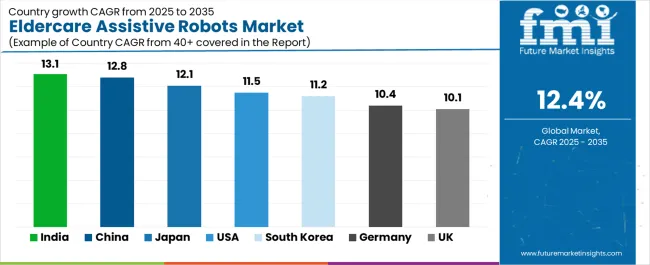
The eldercare assistive robots market is experiencing solid growth globally, with India leading at a 13.1% CAGR through 2035, driven by public digital-health programs, cost-optimized robot solutions for home care applications, and rapid senior population growth outpacing caregiver availability. China follows at 12.8%, supported by provincial reimbursement pilot programs, extensive domestic robotics hardware ecosystem, and large-scale eldercare facility construction initiatives. Japan shows growth at 12.1%, emphasizing long-term care labor shortages, national trials of lifting and mobility robots, and comprehensive aging-in-place technology programs. The United States demonstrates 11.5% growth, supported by state aging agency deployments, insurance pilot programs for fall prevention, and strong home automation integration capabilities. South Korea records 11.2%, focusing on smart home penetration, hospital rehabilitation robotics applications, and government artificial intelligence initiatives. Germany exhibits 10.4% growth, emphasizing GDPR-compliant monitoring solutions, reimbursement pathways for assistive technologies, and high facility care quality standards. The United Kingdom shows 10.1% growth, supported by NHS digital care programs, social care staffing gaps, and community telecare integration initiatives.
The report covers an in-depth analysis of 40+ countries, Top-performing countries are highlighted below.
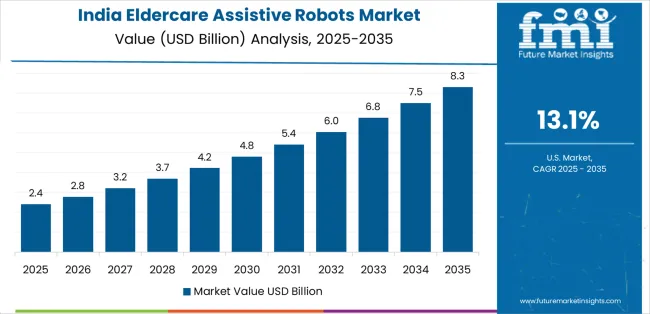
The eldercare assistive robots industry in India is projected to exhibit exceptional growth with a CAGR of 13.1% through 2035, driven by expanding public digital health programs and rapidly growing senior population supported by government elderly care initiatives and urbanization trends creating nuclear family structures requiring technological care support. The country's massive demographic transition and increasing smartphone penetration are creating substantial demand for affordable eldercare assistive robot solutions. Major technology companies and healthcare startups are establishing comprehensive cost-optimized robotics capabilities to serve both urban home care markets and institutional care facilities.
The eldercare assistive robots sector in China is expanding at a CAGR of 12.8%, supported by the country's provincial reimbursement pilot initiatives, comprehensive domestic robotics hardware ecosystem, and large-scale eldercare facility construction programs driven by government aging society policies and extensive industrial manufacturing capabilities. The country's coordinated eldercare infrastructure development and technological advancement are driving sophisticated assistive robotics capabilities throughout institutional and home care sectors. Leading robotics manufacturers and healthcare technology companies are establishing extensive production and deployment facilities to address growing domestic demand and export opportunities.
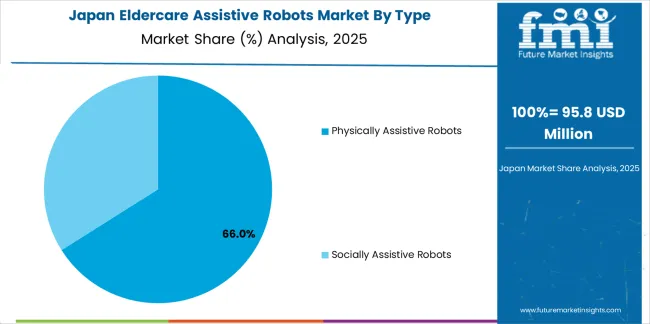
The eldercare assistive robots market in Japan is expanding at a CAGR of 12.1%, supported by the country's severe long-term care labor shortages, comprehensive national trial programs for lifting and mobility robots, and extensive aging-in-place technology initiatives. The nation's super-aged society status and technological sophistication are driving advanced assistive robotics capabilities throughout eldercare sectors. Leading robotics manufacturers and healthcare organizations are investing extensively in specialized eldercare robot development and clinical validation programs.
Revenue from eldercare assistive robots in the United States is expanding at a CAGR of 11.5%, supported by the country's state aging agency deployment programs, insurance company pilot initiatives for fall prevention technologies, and strong home automation infrastructure enabling integrated smart home eldercare solutions. The nation's decentralized healthcare system and innovation ecosystem are driving demand for diverse assistive robotics solutions. Healthcare insurers and technology companies are investing in demonstration projects and reimbursement pathway development to serve both home care and facility markets.
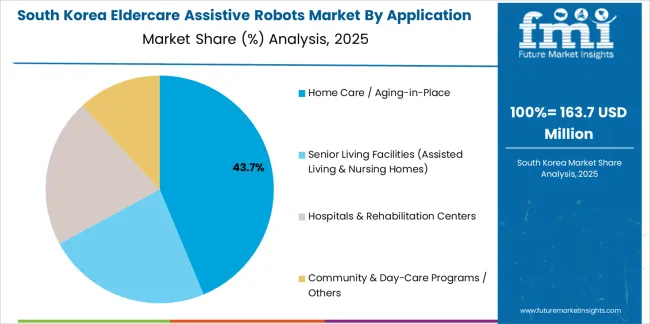
Revenue from eldercare assistive robots in South Korea is expanding at a CAGR of 11.2%, driven by the country's world-leading smart home penetration rates, advanced hospital rehabilitation robotics programs, and comprehensive government artificial intelligence development initiatives supporting eldercare technology innovation. South Korea's technological infrastructure and aging demographics are driving sophisticated assistive robotics capabilities throughout healthcare sectors. Leading electronics manufacturers and healthcare institutions are establishing comprehensive innovation programs for next-generation eldercare robots.
Revenue from eldercare assistive robots in Germany is growing at a CAGR of 10.4%, driven by the country's stringent GDPR-compliant monitoring system requirements, emerging reimbursement pathways for assistive technologies, and high eldercare facility quality standards supporting investment in advanced care technologies. Germany's privacy consciousness and quality excellence are supporting development of compliant assistive robotics technologies. Major healthcare technology companies and eldercare facility operators are establishing comprehensive programs incorporating privacy-preserving assistive robots.
Revenue from eldercare assistive robots in the United Kingdom is expanding at a CAGR of 10.1%, supported by the country's NHS digital care transformation programs, severe social care staffing shortages, and community telecare service integration initiatives supporting remote care delivery models. The UK's healthcare system challenges and digital health priorities are driving demand for assistive robotics solutions. Healthcare trusts and local authorities are investing in technology-enabled care programs addressing workforce limitations.
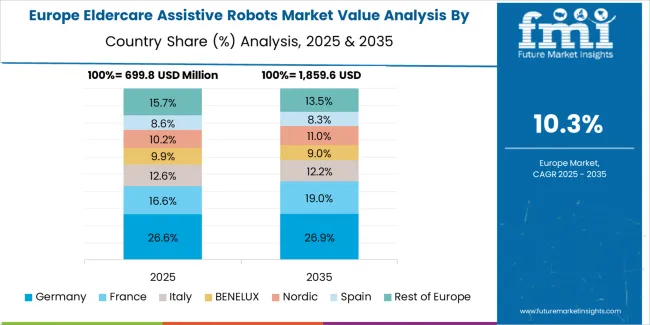
Th market in Europe is projected to grow from USD 0.9 billion in 2025 to USD 2.6 billion by 2035, registering a CAGR of 11.3% over the forecast period. Germany is expected to lead with a 23.5% market share in 2025, elevating to 24.0% by 2035, supported by stringent care quality standards, strong reimbursement pilot programs, and comprehensive assistive technology integration in eldercare facilities.
France follows with 18.0% in 2025, edging to 18.5% by 2035, driven by investments in dementia care technologies and companion robot deployments in memory care units. The United Kingdom holds 17.0% in 2025, likely declining to 16.5% by 2035 as local authorities rebalance social care budgets yet scale digital care programs and remote monitoring initiatives. Italy stands at 13.0% in 2025, maintaining share through 2035 with growing adoption in residential care homes. Spain accounts for 11.0% in 2025, supported by family caregiver support programs and emerging facility modernization initiatives. The Nordics represent 8.5% in 2025, driven by high technology acceptance and comprehensive welfare systems supporting assistive technology adoption. The Rest of Europe region collectively rises from 9.0% in 2025 to 10.0% by 2035, reflecting modernization efforts across Central and Eastern European eldercare facilities adopting mobility-assist systems and monitoring companions.
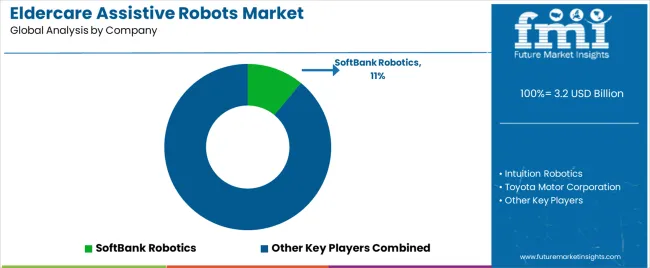
The market is characterized by competition among established robotics manufacturers, specialized eldercare technology companies, and diversified industrial automation providers. Companies are investing in artificial intelligence algorithm development, user interface simplification, subscription model innovation, and clinical validation programs to deliver intuitive, affordable, and effective eldercare assistive robot solutions. Innovation in conversational AI capabilities, mobility assistance mechanisms, and ambient monitoring technologies is central to strengthening market position and competitive advantage.
SoftBank Robotics leads the market with an 11.0% share, offering comprehensive humanoid and service robot solutions with a focus on companion robotics, telepresence applications, and cognitive engagement platforms across diverse home care, facility care, and healthcare applications. The company maintains strong market presence through its Pepper and NAO humanoid robot platforms widely deployed in eldercare facilities globally. Intuition Robotics provides innovative social companion solutions with emphasis on proactive engagement and behavioral health monitoring, having expanded USA aging agency deployments of its ElliQ social companion platform during 2024-2025 and introduced the latest hardware/software iteration focused on medication adherence and fall-risk coaching.
Toyota Motor Corporation delivers mobility assistance products with focus on personal mobility devices and care support robots leveraging automotive engineering expertise. Honda Motor Co., Ltd. specializes in mobility assistance and exoskeleton technologies, having showcased the UNI-ONE personal mobility device in 2024 and updated remote presence and assistance concepts aimed at rehabilitation and daily living support. Cyberdyne Inc. offers advanced exoskeleton systems with emphasis on rehabilitation and physical assistance applications, having broadened clinical and eldercare facility use of HAL lower-limb and lumbar assist exoskeletons in Japan and select overseas rehabilitation centers during 2024-2025, with expanded rental and subscription access models. ABB Ltd. provides industrial-grade robotics adapted for healthcare applications with comprehensive automation expertise.
Eldercare assistive robots represent a transformative healthcare technology segment within aging services, long-term care, and home health applications, projected to grow from USD 3.2 billion in 2025 to USD 10.2 billion by 2035 at a 12.4% CAGR. These advanced robotic systems-encompassing physically assistive and socially assistive configurations for diverse care settings-serve as critical care augmentation technologies in independent living support, institutional care delivery, rehabilitation assistance, and quality-of-life enhancement where functional independence, social engagement, and safety monitoring are essential. Market expansion is driven by increasing aging populations and caregiver shortages, growing artificial intelligence capabilities, expanding reimbursement pathways, and rising demand for aging-in-place solutions across diverse demographic and care delivery segments.
How Healthcare Regulators Could Strengthen Safety Standards and Clinical Validation?
How Industry Associations Could Advance Best Practices and User Acceptance?
How Eldercare Robot Manufacturers Could Drive Innovation and Market Accessibility?
How Care Providers and Facilities Could Optimize Robot Deployment and Care Outcomes?
How Research Institutions Could Enable Technology Advancement?
How Payers and Policy Makers Could Support Market Growth and Access?
| Items | Values |
|---|---|
| Quantitative Units (2025) | USD 3.2 billion |
| Type | Physically Assistive Robots, Socially Assistive Robots |
| Application | Home Care / Aging-in-Place, Senior Living Facilities (Assisted Living & Nursing Homes), Hospitals & Rehabilitation Centers, Community & Day-Care Programs / Others |
| Form Factor | Mobile/Wheeled Service Robots, Wearable Exoskeletons & Gait-Assist, Pet/Companion Robots (Zoomorphic & Small Humanoids), Stationary/Ambient Assist Systems |
| Regions Covered | Asia Pacific, North America, Europe, Latin America, Middle East & Africa |
| Countries Covered | India, China, Japan, United States, South Korea, Germany, United Kingdom, and 40+ countries |
| Key Companies Profiled | SoftBank Robotics, Intuition Robotics, Toyota Motor Corporation, Cyberdyne Inc., Honda Motor Co., Ltd., ABB Ltd. |
| Additional Attributes | Dollar sales by type, application category, and form factor segment, regional demand trends, competitive landscape, technological advancements in AI algorithms, mobility assistance systems, user interface design, and clinical outcome validation |
The global eldercare assistive robots market is estimated to be valued at USD 3.2 billion in 2025.
The market size for the eldercare assistive robots market is projected to reach USD 10.3 billion by 2035.
The eldercare assistive robots market is expected to grow at a 12.4% CAGR between 2025 and 2035.
The key product types in eldercare assistive robots market are physically assistive robots and socially assistive robots.
In terms of application, home care / aging-in-place segment to command 46.0% share in the eldercare assistive robots market in 2025.


Full Research Suite comprises of:
Market outlook & trends analysis
Interviews & case studies
Strategic recommendations
Vendor profiles & capabilities analysis
5-year forecasts
8 regions and 60+ country-level data splits
Market segment data splits
12 months of continuous data updates
DELIVERED AS:
PDF EXCEL ONLINE
Eldercare-Assistive Robots Industry Analysis in East Asia Size and Share Forecast Outlook 2025 to 2035
Eldercare Mobility Device Market Analysis - Size, Share, and Forecast Outlook 2025 to 2035
Assistive Listening Devices Market
Stroke Assistive Devices Market
Veterinary Assistive Reproduction Technology Market Size and Share Forecast Outlook 2025 to 2035
SLAM Robots Market Size and Share Forecast Outlook 2025 to 2035
Micro Robots Market Analysis - Size, Share, and Forecast Outlook 2025 to 2035
Delta Robots Market
Mobile Robots Market Size and Share Forecast Outlook 2025 to 2035
Pharma Robots Market Size and Share Forecast Outlook 2025 to 2035
Nuclear Robots Market Size and Share Forecast Outlook 2025 to 2035
Kitting Robots Market Size and Share Forecast Outlook 2025 to 2035
Milking Robots Market Size and Share Forecast Outlook 2025 to 2035
Airport Robots Market Size and Share Forecast Outlook 2025 to 2035
Painting Robots Market Size and Share Forecast Outlook 2025 to 2035
Security Robots Market Size and Share Forecast Outlook 2025 to 2035
Military Robots Market Size and Share Forecast Outlook 2025 to 2035
Surgical Robots Market
Pipetting Robots Market Size and Share Forecast Outlook 2025 to 2035
Logistics Robots Market Size and Share Forecast Outlook 2025 to 2035

Thank you!
You will receive an email from our Business Development Manager. Please be sure to check your SPAM/JUNK folder too.
Chat With
MaRIA