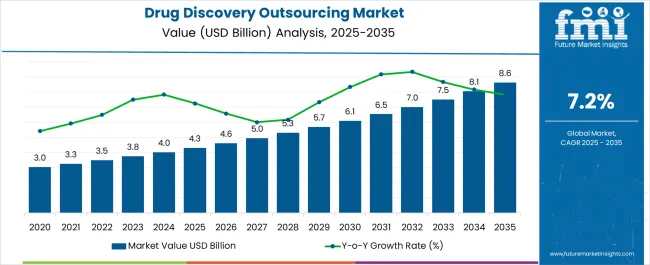
The drug discovery outsourcing market is expected to expand its roots at a steady CAGR of 7.2% during the forecast period. The market is likely to hold a revenue of US$ 3.75 billion in 2023, while it is anticipated to cross a value of US$ 7.52 billion by 2033.
The research report on the drug discovery outsourcing market states that the pharmaceutical industry is expanding thoroughly with new extensions and high-end research programs. The higher penetration of smart technology in the drug discovery and development process is likely to transform the market condition. Furthermore, AI drug discovery outsourcing is much cheaper, easy, and integrated. Thus, pharmaceutical brands adopt these newly designed methods to increase reliability and promote cruelty-free discovery. Alongside this, the growing outsourcing trend in Asian economies like India and China is likely to strengthen the pharmaceutical ties between the West and East. The wave of novel drug discovery in India, with brands building their projects around the Indian drug discovery outsourcing space, is anticipated to flourish the market growth. Moreover, the government projects and the bilateral relationship are also anticipated to increase drug production. This pushes pharma companies to look for biomedical advancements.
The market dynamics have been affected by the pandemic, the geriatric population, and new diseases spreading out of nations. Thus, the consumption of advanced drugs, drug mixtures (synergistic drugs), and other anti-infection drugs are likely to put pressure on the brands. This leads pharmaceutical companies to reach out to distant markets to reduce the cost of production and research of drug discovery and development.
The use of stimulating organs coupled with organs-on-chips for disease modeling and drug development is likely to change the market dynamic. From hit confirmation to lead optimization and high-speed screening services, the smart tech has reformed each component of the drug discovery systems. An estimate states that 80% of the research for different pharmaceutical elements can be outsourced. Thus, the drug discovery outsourcing market is likely to garner during the forecast period.
Attributes | Details |
---|---|
Drug Discovery Outsourcing Market CAGR (2023 to 2033) | 7.2% |
Drug Discovery Outsourcing Market Size (2023) | US$ 3.75 billion |
Drug Discovery Outsourcing Market Size (2033) | US$ 7.52 billion |
Don't pay for what you don't need
Customize your report by selecting specific countries or regions and save 30%!
According to FMI analysis, the drug discovery outsourcing market was valued at US$ 3.50 billion in 2022 and is likely to be worth US$ 7.52 billion by 2033.
AI-enabled drug discovery methods, along with the expanding research and development programs, are garnering market growth. The increased penetration of innovation, reduced costs, and pharmaceutical companies collaborating for the research part fuel the market growth.
The application of AI in protein modeling, digital organ simulation, and organ-on-a-chip is also easing the drug discovery process. Developing nations like India and China are becoming the center stage for the pharmaceutical revolution with mass drug production and extended research and development programs. The AI-driven drug discovery is anticipated to increase the capital investment in distant lands to expand their production and research workforce. Alongside this, the new AI drug discovery outsourcing services are likely to enhance target identification, patient stratification, and biomarker development.
As COVID-19 pandemic garnered the pharmaceutical industry, new viruses and their penetration in developed nations are also increasing drug consumption. Even developing nations enhancing public health conditions are adopting advanced drug discovery measures. Similarly, they are indulged in collaborating with cheaper third-party research and development vendors.
Key restraints for the drug discovery outsourcing market are governmental restrictions, higher outsourcing costs, and tariffs restraining market growth. The rapidly expanding space for alternative medicine and limited medical budgets are limiting the growth of the market.
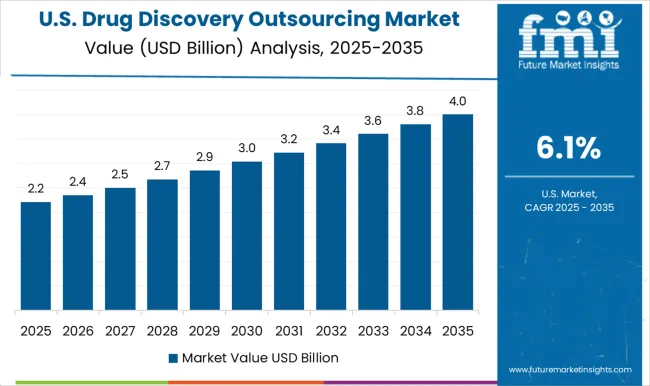
Increased Demand for Research and Development along with Expanding Bilateral Ties are making North America the Top Growing Region
North America region leads in terms of the market share in the drug discovery outsourcing market with a market share CAGR of 35.5%. The growth is attributed to lower research costs, higher innovative experiments, and increasing demand for generic and disease-specific drugs. Furthermore, companies collaborating with third-party drug discovery service vendors are likely to impact the market positively. The rising competition is fueled by factors such as higher efficiency, quality, and innovation is garnering regional growth.
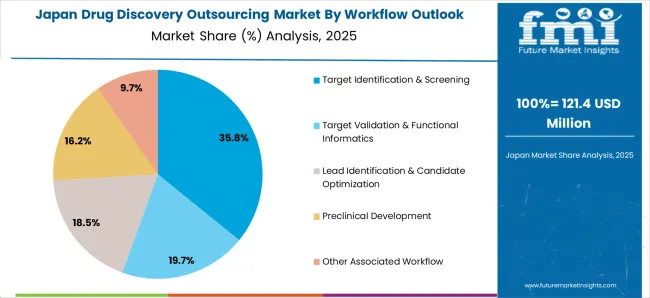
Integration of Smart Technologies coupled with Heavy Demand for Generic Medicine is Fuelling the Demand for Drug Discovery Outsourcing
Asia Pacific region leads the market in terms of CAGR between 2023 and 2033. Japan drug discovery outsourcing markets in the Asia Pacific region. Apart from the higher population and higher investment, the Japanese market comes in the pharmaceutical market due to smart technology integration. The AI-enabled drug discovery method is transforming the industry with fast, reliable, inexpensive, and cruelty-free drug discovery.
Concepts like Digital Organ Simulation and Organ-on-a-chip are collectively flourishing the Regional Growth
The United Kingdom is another significant market for drug discovery outsourcing systems. The increase in virus mutations and deadly chronic diseases is pushing the demand for drug discovery outsourcing. Better prediction in human drug discovery also impacts the various treatment garnering market growth.
Get the data you need at a Fraction of the cost
Personalize your report by choosing insights you need
and save 40%!
Category | By Workflow |
---|---|
Leading Segment | Lead Identification & Candidate Optimization |
Market Share % (2022) | 32.3% |
Category | By Therapeutic Area |
---|---|
Leading Segment | Respiratory Systems |
Market Share % (2022) | 14% |
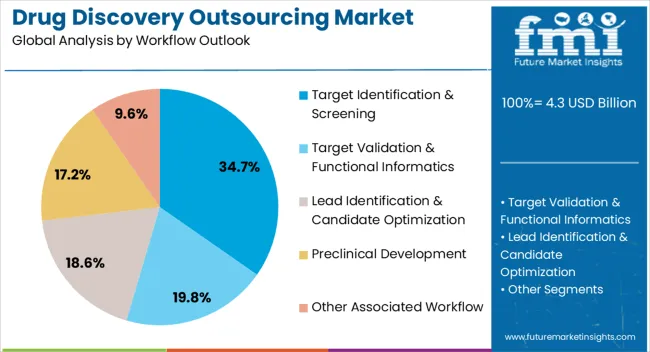
Based on the workflow, lead identification & candidate optimization held the leading share of 32.3% in 2022. The growth is attributed to better workflow management. Also, increased activity around the non-bonded interaction and reduced side effects are making this segment more popular in the category. It is expected to improve potency and dynamics as well.
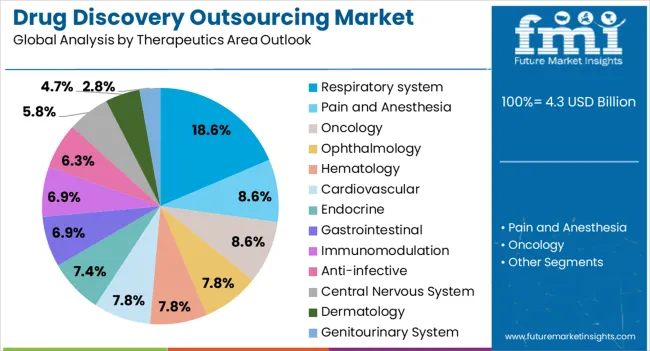
Based on the therapeutic area, the respiratory systems segment held a share of 14.0% in 2022. The higher amount of chronic diseases impacting the respiratory organs and developing various chronic and non-chronic diseases are thriving segmental growth. The therapeutic areas involve oncology, ophthalmology, hematology, cardiovascular, endocrine, and others. The diseases like bronchitis, tuberculosis, COPD, and asthma fuel the segment growth.
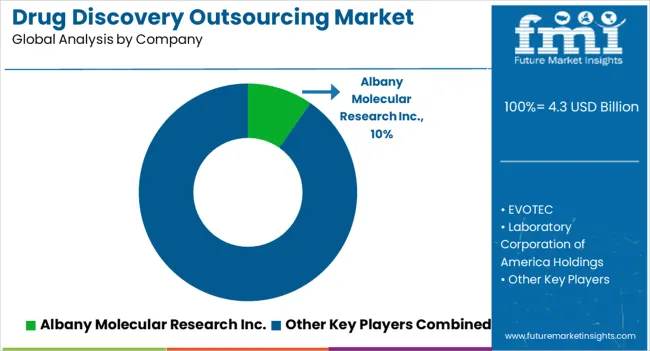
The key players focus on adopting advanced AI-enabled drug discovery outsourcing services. The end users choose the vendors that not only provide better pricing but also efficient quality and timing. Companies also merge, collaborate, and acquire in order to expand their sales and distributional channels.
Market Developments
The drug discovery outsourcing market is valued at US$ 3.75 billion in 2023.
Albany Molecular Research Inc., EVOTEC and Laboratory Corporation of America Holdings are key players.
The drug discovery outsourcing market will reach US$ 7.52 billion by 2033.
AI-driven drug discovery, expanding R&D, innovation adoption, cost reduction, and pharma collaboration propel the market.
Lead Identification & Candidate Optimization segment to remain preferred in the market through 2033.
1. Executive Summary | Drug Discovery Outsourcing Market
1.1. Global Market Outlook
1.2. Demand-side Trends
1.3. Supply-side Trends
1.4. Technology Roadmap Analysis
1.5. Analysis and Recommendations
2. Market Overview
2.1. Market Coverage / Taxonomy
2.2. Market Definition / Scope / Limitations
3. Market Background
3.1. Market Dynamics
3.1.1. Drivers
3.1.2. Restraints
3.1.3. Opportunity
3.1.4. Trends
3.2. Scenario Forecast
3.2.1. Demand in Optimistic Scenario
3.2.2. Demand in Likely Scenario
3.2.3. Demand in Conservative Scenario
3.3. Opportunity Map Analysis
3.4. Investment Feasibility Matrix
3.5. PESTLE and Porter’s Analysis
3.6. Regulatory Landscape
3.6.1. By Key Regions
3.6.2. By Key Countries
3.7. Regional Parent Market Outlook
4. Global Market Analysis 2018 to 2022 and Forecast, 2023 to 2033
4.1. Historical Market Size Value (US$ Million) Analysis, 2018 to 2022
4.2. Current and Future Market Size Value (US$ Million) Projections, 2023 to 2033
4.2.1. Y-o-Y Growth Trend Analysis
4.2.2. Absolute $ Opportunity Analysis
5. Global Market Analysis 2018 to 2022 and Forecast 2023 to 2033, By Workflow
5.1. Introduction / Key Findings
5.2. Historical Market Size Value (US$ Million) Analysis By Workflow, 2018 to 2022
5.3. Current and Future Market Size Value (US$ Million) Analysis and Forecast By Workflow, 2023 to 2033
5.3.1. Target Identification & Screening
5.3.2. Target Validation & Functional Informatics
5.3.3. Lead Identification & Candidate Optimization
5.3.4. Preclinical Development
5.3.5. Other Associated Workflow
5.4. Y-o-Y Growth Trend Analysis By Workflow, 2018 to 2022
5.5. Absolute $ Opportunity Analysis By Workflow, 2023 to 2033
6. Global Market Analysis 2018 to 2022 and Forecast 2023 to 2033, By Therapeutics Area
6.1. Introduction / Key Findings
6.2. Historical Market Size Value (US$ Million) Analysis By Therapeutics Area, 2018 to 2022
6.3. Current and Future Market Size Value (US$ Million) Analysis and Forecast By Therapeutics Area, 2023 to 2033
6.3.1. Respiratory system
6.3.2. Pain and Anaesthesia
6.3.3. Oncology
6.3.4. Ophthalmology
6.3.5. Haematology
6.3.6. Cardiovascular
6.3.7. Endocrine
6.3.8. Gastrointestinal
6.3.9. Immunomodulation
6.3.10. Dermatology
6.3.11. Central Nervous System
6.3.12. Genitourinary System
6.4. Y-o-Y Growth Trend Analysis By Therapeutics Area, 2018 to 2022
6.5. Absolute $ Opportunity Analysis By Therapeutics Area, 2023 to 2033
7. Global Market Analysis 2018 to 2022 and Forecast 2023 to 2033, By Drug Type
7.1. Introduction / Key Findings
7.2. Historical Market Size Value (US$ Million) Analysis By Drug Type, 2018 to 2022
7.3. Current and Future Market Size Value (US$ Million) Analysis and Forecast By Drug Type, 2023 to 2033
7.3.1. Small Molecules
7.3.2. Large Molecules
7.4. Y-o-Y Growth Trend Analysis By Drug Type, 2018 to 2022
7.5. Absolute $ Opportunity Analysis By Drug Type, 2023 to 2033
8. Global Market Analysis 2018 to 2022 and Forecast 2023 to 2033, By End User
8.1. Introduction / Key Findings
8.2. Historical Market Size Value (US$ Million) Analysis By End User, 2018 to 2022
8.3. Current and Future Market Size Value (US$ Million) Analysis and Forecast By End User, 2023 to 2033
8.3.1. Pharmaceutical and Biotechnology companies
8.3.2. Academic Institutes
8.4. Y-o-Y Growth Trend Analysis By End User, 2018 to 2022
8.5. Absolute $ Opportunity Analysis By End User, 2023 to 2033
9. Global Market Analysis 2018 to 2022 and Forecast 2023 to 2033, By Region
9.1. Introduction
9.2. Historical Market Size Value (US$ Million) Analysis By Region, 2018 to 2022
9.3. Current Market Size Value (US$ Million) Analysis and Forecast By Region, 2023 to 2033
9.3.1. North America
9.3.2. Latin America
9.3.3. Europe
9.3.4. South Asia
9.3.5. East Asia
9.3.6. Oceania
9.3.7. MEA
9.4. Market Attractiveness Analysis By Region
10. North America Market Analysis 2018 to 2022 and Forecast 2023 to 2033, By Country
10.1. Historical Market Size Value (US$ Million) Trend Analysis By Market Taxonomy, 2018 to 2022
10.2. Market Size Value (US$ Million) Forecast By Market Taxonomy, 2023 to 2033
10.2.1. By Country
10.2.1.1. USA
10.2.1.2. Canada
10.2.2. By Workflow
10.2.3. By Therapeutics Area
10.2.4. By Drug Type
10.2.5. By End User
10.3. Market Attractiveness Analysis
10.3.1. By Country
10.3.2. By Workflow
10.3.3. By Therapeutics Area
10.3.4. By Drug Type
10.3.5. By End User
10.4. Key Takeaways
11. Latin America Market Analysis 2018 to 2022 and Forecast 2023 to 2033, By Country
11.1. Historical Market Size Value (US$ Million) Trend Analysis By Market Taxonomy, 2018 to 2022
11.2. Market Size Value (US$ Million) Forecast By Market Taxonomy, 2023 to 2033
11.2.1. By Country
11.2.1.1. Brazil
11.2.1.2. Mexico
11.2.1.3. Rest of Latin America
11.2.2. By Workflow
11.2.3. By Therapeutics Area
11.2.4. By Drug Type
11.2.5. By End User
11.3. Market Attractiveness Analysis
11.3.1. By Country
11.3.2. By Workflow
11.3.3. By Therapeutics Area
11.3.4. By Drug Type
11.3.5. By End User
11.4. Key Takeaways
12. Europe Market Analysis 2018 to 2022 and Forecast 2023 to 2033, By Country
12.1. Historical Market Size Value (US$ Million) Trend Analysis By Market Taxonomy, 2018 to 2022
12.2. Market Size Value (US$ Million) Forecast By Market Taxonomy, 2023 to 2033
12.2.1. By Country
12.2.1.1. Germany
12.2.1.2. United kingdom
12.2.1.3. France
12.2.1.4. Spain
12.2.1.5. Italy
12.2.1.6. Rest of Europe
12.2.2. By Workflow
12.2.3. By Therapeutics Area
12.2.4. By Drug Type
12.2.5. By End User
12.3. Market Attractiveness Analysis
12.3.1. By Country
12.3.2. By Workflow
12.3.3. By Therapeutics Area
12.3.4. By Drug Type
12.3.5. By End User
12.4. Key Takeaways
13. South Asia Market Analysis 2018 to 2022 and Forecast 2023 to 2033, By Country
13.1. Historical Market Size Value (US$ Million) Trend Analysis By Market Taxonomy, 2018 to 2022
13.2. Market Size Value (US$ Million) Forecast By Market Taxonomy, 2023 to 2033
13.2.1. By Country
13.2.1.1. India
13.2.1.2. Malaysia
13.2.1.3. Singapore
13.2.1.4. Thailand
13.2.1.5. Rest of South Asia
13.2.2. By Workflow
13.2.3. By Therapeutics Area
13.2.4. By Drug Type
13.2.5. By End User
13.3. Market Attractiveness Analysis
13.3.1. By Country
13.3.2. By Workflow
13.3.3. By Therapeutics Area
13.3.4. By Drug Type
13.3.5. By End User
13.4. Key Takeaways
14. East Asia Market Analysis 2018 to 2022 and Forecast 2023 to 2033, By Country
14.1. Historical Market Size Value (US$ Million) Trend Analysis By Market Taxonomy, 2018 to 2022
14.2. Market Size Value (US$ Million) Forecast By Market Taxonomy, 2023 to 2033
14.2.1. By Country
14.2.1.1. China
14.2.1.2. Japan
14.2.1.3. South Korea
14.2.2. By Workflow
14.2.3. By Therapeutics Area
14.2.4. By Drug Type
14.2.5. By End User
14.3. Market Attractiveness Analysis
14.3.1. By Country
14.3.2. By Workflow
14.3.3. By Therapeutics Area
14.3.4. By Drug Type
14.3.5. By End User
14.4. Key Takeaways
15. Oceania Market Analysis 2018 to 2022 and Forecast 2023 to 2033, By Country
15.1. Historical Market Size Value (US$ Million) Trend Analysis By Market Taxonomy, 2018 to 2022
15.2. Market Size Value (US$ Million) Forecast By Market Taxonomy, 2023 to 2033
15.2.1. By Country
15.2.1.1. Australia
15.2.1.2. New Zealand
15.2.2. By Workflow
15.2.3. By Therapeutics Area
15.2.4. By Drug Type
15.2.5. By End User
15.3. Market Attractiveness Analysis
15.3.1. By Country
15.3.2. By Workflow
15.3.3. By Therapeutics Area
15.3.4. By Drug Type
15.3.5. By End User
15.4. Key Takeaways
16. MEA Market Analysis 2018 to 2022 and Forecast 2023 to 2033, By Country
16.1. Historical Market Size Value (US$ Million) Trend Analysis By Market Taxonomy, 2018 to 2022
16.2. Market Size Value (US$ Million) Forecast By Market Taxonomy, 2023 to 2033
16.2.1. By Country
16.2.1.1. GCC Countries
16.2.1.2. South Africa
16.2.1.3. Israel
16.2.1.4. Rest of MEA
16.2.2. By Workflow
16.2.3. By Therapeutics Area
16.2.4. By Drug Type
16.2.5. By End User
16.3. Market Attractiveness Analysis
16.3.1. By Country
16.3.2. By Workflow
16.3.3. By Therapeutics Area
16.3.4. By Drug Type
16.3.5. By End User
16.4. Key Takeaways
17. Key Countries Market Analysis
17.1. USA
17.1.1. Pricing Analysis
17.1.2. Market Share Analysis, 2022
17.1.2.1. By Workflow
17.1.2.2. By Therapeutics Area
17.1.2.3. By Drug Type
17.1.2.4. By End User
17.2. Canada
17.2.1. Pricing Analysis
17.2.2. Market Share Analysis, 2022
17.2.2.1. By Workflow
17.2.2.2. By Therapeutics Area
17.2.2.3. By Drug Type
17.2.2.4. By End User
17.3. Brazil
17.3.1. Pricing Analysis
17.3.2. Market Share Analysis, 2022
17.3.2.1. By Workflow
17.3.2.2. By Therapeutics Area
17.3.2.3. By Drug Type
17.3.2.4. By End User
17.4. Mexico
17.4.1. Pricing Analysis
17.4.2. Market Share Analysis, 2022
17.4.2.1. By Workflow
17.4.2.2. By Therapeutics Area
17.4.2.3. By Drug Type
17.4.2.4. By End User
17.5. Germany
17.5.1. Pricing Analysis
17.5.2. Market Share Analysis, 2022
17.5.2.1. By Workflow
17.5.2.2. By Therapeutics Area
17.5.2.3. By Drug Type
17.5.2.4. By End User
17.6. United kingdom
17.6.1. Pricing Analysis
17.6.2. Market Share Analysis, 2022
17.6.2.1. By Workflow
17.6.2.2. By Therapeutics Area
17.6.2.3. By Drug Type
17.6.2.4. By End User
17.7. France
17.7.1. Pricing Analysis
17.7.2. Market Share Analysis, 2022
17.7.2.1. By Workflow
17.7.2.2. By Therapeutics Area
17.7.2.3. By Drug Type
17.7.2.4. By End User
17.8. Spain
17.8.1. Pricing Analysis
17.8.2. Market Share Analysis, 2022
17.8.2.1. By Workflow
17.8.2.2. By Therapeutics Area
17.8.2.3. By Drug Type
17.8.2.4. By End User
17.9. Italy
17.9.1. Pricing Analysis
17.9.2. Market Share Analysis, 2022
17.9.2.1. By Workflow
17.9.2.2. By Therapeutics Area
17.9.2.3. By Drug Type
17.9.2.4. By End User
17.10. India
17.10.1. Pricing Analysis
17.10.2. Market Share Analysis, 2022
17.10.2.1. By Workflow
17.10.2.2. By Therapeutics Area
17.10.2.3. By Drug Type
17.10.2.4. By End User
17.11. Malaysia
17.11.1. Pricing Analysis
17.11.2. Market Share Analysis, 2022
17.11.2.1. By Workflow
17.11.2.2. By Therapeutics Area
17.11.2.3. By Drug Type
17.11.2.4. By End User
17.12. Singapore
17.12.1. Pricing Analysis
17.12.2. Market Share Analysis, 2022
17.12.2.1. By Workflow
17.12.2.2. By Therapeutics Area
17.12.2.3. By Drug Type
17.12.2.4. By End User
17.13. Thailand
17.13.1. Pricing Analysis
17.13.2. Market Share Analysis, 2022
17.13.2.1. By Workflow
17.13.2.2. By Therapeutics Area
17.13.2.3. By Drug Type
17.13.2.4. By End User
17.14. China
17.14.1. Pricing Analysis
17.14.2. Market Share Analysis, 2022
17.14.2.1. By Workflow
17.14.2.2. By Therapeutics Area
17.14.2.3. By Drug Type
17.14.2.4. By End User
17.15. Japan
17.15.1. Pricing Analysis
17.15.2. Market Share Analysis, 2022
17.15.2.1. By Workflow
17.15.2.2. By Therapeutics Area
17.15.2.3. By Drug Type
17.15.2.4. By End User
17.16. South Korea
17.16.1. Pricing Analysis
17.16.2. Market Share Analysis, 2022
17.16.2.1. By Workflow
17.16.2.2. By Therapeutics Area
17.16.2.3. By Drug Type
17.16.2.4. By End User
17.17. Australia
17.17.1. Pricing Analysis
17.17.2. Market Share Analysis, 2022
17.17.2.1. By Workflow
17.17.2.2. By Therapeutics Area
17.17.2.3. By Drug Type
17.17.2.4. By End User
17.18. New Zealand
17.18.1. Pricing Analysis
17.18.2. Market Share Analysis, 2022
17.18.2.1. By Workflow
17.18.2.2. By Therapeutics Area
17.18.2.3. By Drug Type
17.18.2.4. By End User
17.19. GCC Countries
17.19.1. Pricing Analysis
17.19.2. Market Share Analysis, 2022
17.19.2.1. By Workflow
17.19.2.2. By Therapeutics Area
17.19.2.3. By Drug Type
17.19.2.4. By End User
17.20. South Africa
17.20.1. Pricing Analysis
17.20.2. Market Share Analysis, 2022
17.20.2.1. By Workflow
17.20.2.2. By Therapeutics Area
17.20.2.3. By Drug Type
17.20.2.4. By End User
17.21. Israel
17.21.1. Pricing Analysis
17.21.2. Market Share Analysis, 2022
17.21.2.1. By Workflow
17.21.2.2. By Therapeutics Area
17.21.2.3. By Drug Type
17.21.2.4. By End User
18. Market Structure Analysis
18.1. Competition Dashboard
18.2. Competition Benchmarking
18.3. Market Share Analysis of Top Players
18.3.1. By Regional
18.3.2. By Workflow
18.3.3. By Therapeutics Area
18.3.4. By Drug Type
18.3.5. By End User
19. Competition Analysis
19.1. Competition Deep Dive
19.1.1. Albany Molecular Research Inc.
19.1.1.1. Overview
19.1.1.2. Product Portfolio
19.1.1.3. Profitability by Market Segments
19.1.1.4. Sales Footprint
19.1.1.5. Strategy Overview
19.1.1.5.1. Marketing Strategy
19.1.2. EVOTEC
19.1.2.1. Overview
19.1.2.2. Product Portfolio
19.1.2.3. Profitability by Market Segments
19.1.2.4. Sales Footprint
19.1.2.5. Strategy Overview
19.1.2.5.1. Marketing Strategy
19.1.3. Laboratory Corporation of America Holdings
19.1.3.1. Overview
19.1.3.2. Product Portfolio
19.1.3.3. Profitability by Market Segments
19.1.3.4. Sales Footprint
19.1.3.5. Strategy Overview
19.1.3.5.1. Marketing Strategy
19.1.4. GenScript
19.1.4.1. Overview
19.1.4.2. Product Portfolio
19.1.4.3. Profitability by Market Segments
19.1.4.4. Sales Footprint
19.1.4.5. Strategy Overview
19.1.4.5.1. Marketing Strategy
19.1.5. Pharmaceutical Product Development, LLC
19.1.5.1. Overview
19.1.5.2. Product Portfolio
19.1.5.3. Profitability by Market Segments
19.1.5.4. Sales Footprint
19.1.5.5. Strategy Overview
19.1.5.5.1. Marketing Strategy
19.1.6. Merck & Co., Inc.
19.1.6.1. Overview
19.1.6.2. Product Portfolio
19.1.6.3. Profitability by Market Segments
19.1.6.4. Sales Footprint
19.1.6.5. Strategy Overview
19.1.6.5.1. Marketing Strategy
19.1.7. Thermo Fisher Scientific Inc.
19.1.7.1. Overview
19.1.7.2. Product Portfolio
19.1.7.3. Profitability by Market Segments
19.1.7.4. Sales Footprint
19.1.7.5. Strategy Overview
19.1.7.5.1. Marketing Strategy
19.1.8. Dalton Pharma Services
19.1.8.1. Overview
19.1.8.2. Product Portfolio
19.1.8.3. Profitability by Market Segments
19.1.8.4. Sales Footprint
19.1.8.5. Strategy Overview
19.1.8.5.1. Marketing Strategy
19.1.9. Dr. Reddy Laboratories Ltd.
19.1.9.1. Overview
19.1.9.2. Product Portfolio
19.1.9.3. Profitability by Market Segments
19.1.9.4. Sales Footprint
19.1.9.5. Strategy Overview
19.1.9.5.1. Marketing Strategy
19.1.10. Pharmaron Beijing Co., Ltd.
19.1.10.1. Overview
19.1.10.2. Product Portfolio
19.1.10.3. Profitability by Market Segments
19.1.10.4. Sales Footprint
19.1.10.5. Strategy Overview
19.1.10.5.1. Marketing Strategy
19.1.11. TCG Lifesciences Pvt Ltd.
19.1.11.1. Overview
19.1.11.2. Product Portfolio
19.1.11.3. Profitability by Market Segments
19.1.11.4. Sales Footprint
19.1.11.5. Strategy Overview
19.1.11.5.1. Marketing Strategy
19.1.12. Domainex Ltd.
19.1.12.1. Overview
19.1.12.2. Product Portfolio
19.1.12.3. Profitability by Market Segments
19.1.12.4. Sales Footprint
19.1.12.5. Strategy Overview
19.1.12.5.1. Marketing Strategy
19.1.13. Eurofins SE
19.1.13.1. Overview
19.1.13.2. Product Portfolio
19.1.13.3. Profitability by Market Segments
19.1.13.4. Sales Footprint
19.1.13.5. Strategy Overview
19.1.13.5.1. Marketing Strategy
19.1.14. Syngene International Limited
19.1.14.1. Overview
19.1.14.2. Product Portfolio
19.1.14.3. Profitability by Market Segments
19.1.14.4. Sales Footprint
19.1.14.5. Strategy Overview
19.1.14.5.1. Marketing Strategy
20. Assumptions & Acronyms Used
21. Research Methodology
Explore Healthcare Insights
View Reports