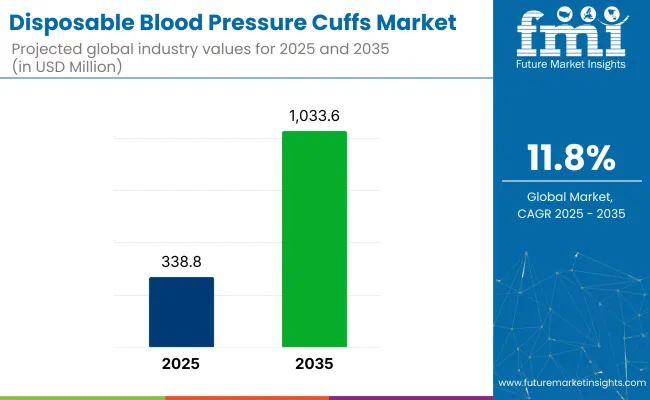
The global disposable blood pressure cuffs market is projected to be valued at USD 338.8 million in 2025 and is expected to reach USD 1,033.6 million by 2035, registering a CAGR of 11.8%. The market is experiencing accelerated growth due to heightened infection-control protocols in healthcare environments and hypertensive patient population.

| Metric | Value |
|---|---|
| Market Size in 2025 | USD 338.8 Million |
| Projected Market Size in 2035 | USD 1,033.6 million |
| CAGR (2025 to 2035) | 11.8% |
Key factors influencing market growth includes rigorous hospital hygiene mandates and a burgeoning preference for single-use medical consumables. Manufacturers are investing in technologies that include smart-integrated cuffs compatible with digital health platforms, aligning with future healthcare trends.
The outlook remains positive and is driven by ongoing regulatory pressure for environmentally responsible products, expanded adoption in home-health settings. As healthcare becomes more digitized, demand for connected and disposable cuffs are on rise.
Prominent players shaping the market include GE Healthcare, Cardinal Health, Philips, SunTech Medical, Omron, and Medline. These firms are enhancing product lines with advanced cuff sizes, color‑coding and digital compatibility, while scaling production to meet rising demand.
In 2025, Baxter announced that Welch Allyn FlexiPort Disposable Blood Pressure Cuffs are no longer on allocation as of May 12, 2025. We are pleased to share that we’ve made significant progress in our capacity expansion plan, including the installation of one blood pressure cuff machine in the USA, which has been fully operational and shipping cuffs since March 14.
In addition, a second new machine was recently installed in our U.S.-based production location that will be fully operational in late May. As previously communicated, these capital equipment investments and diversification of our manufacturing locations will support the acceleration of our backlog recovery and our supply agility going forward, company explained.
The U.S. leads the North America market, buoyed by stringent infection-control mandates and extensive telehealth coverage. Manufacturers have optimized domestic production such as Baxter’s new U.S. lines to ensure supply responsiveness.
Providers increasingly favour Bluetooth-enabled disposable cuffs that integrate with EHR systems, with procurement guided by hospital accreditation and CDC guidelines. Insurers are also reimbursing remote BP monitoring devices, promoting home cuff adoption. Overall, North America’s growth is propelled by regulatory compliance, digital health expansion, and environmental policy alignment.
Europe’s market is shaped by EU-wide infection-control standards. Key markets such as Germany and the Nordics prioritize eco-certified disposables from providers like Philips and Medline. Integration with telemedicine platforms in the U.K. and France, coupled with bundled remote monitoring services, is fostering disposable cuff uptake. Additionally, alignment with ISO and EU MDR 2017/745 compliance secures market access.
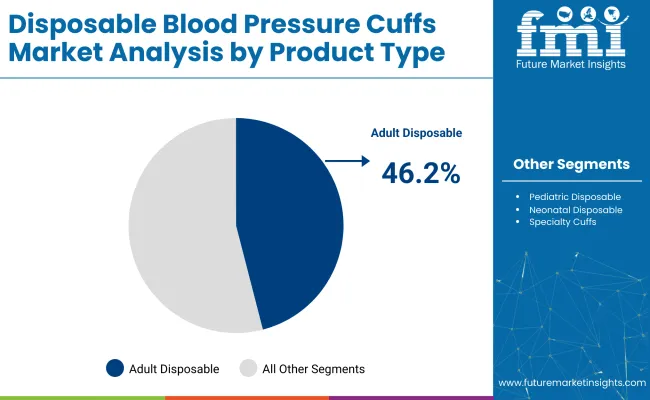
In 2025, adult disposable BP cuffs are estimated to account for 46.2% of the total market revenue. This segment has maintained dominance due to the high global prevalence of hypertension among adults, particularly those aged 45 and above. The growing geriatric population has contributed to increased hospitalization and the need for frequent non-invasive blood pressure monitoring.

Additionally, infection-control protocols in inpatient and emergency settings have favored the use of single-patient adult cuffs. Their compatibility with automated and manual monitors across hospital and homecare environments has further strengthened adoption.
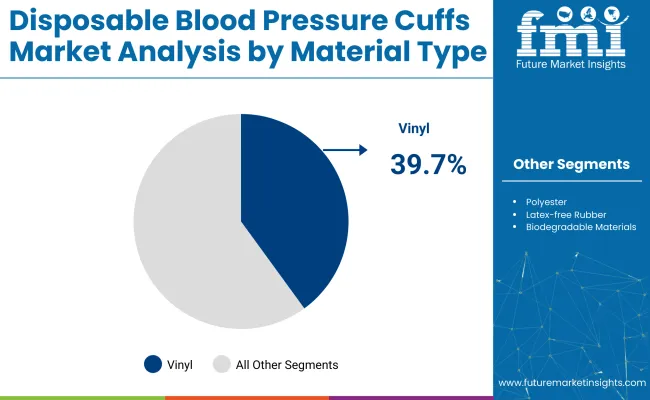
Vinyl has captured approximately 39.7% of revenue share in 2025, emerging as the most preferred material in disposable BP cuffs. Its dominance is attributed to low production cost, mass manufacturability, and enhanced fluid resistance. In acute care settings such as ICUs, ERs, and surgical units, vinyl cuffs have been preferred due to their ability to prevent moisture ingress and ensure hygienic measurements.

The material's compatibility with ultrasonic sealing processes has enabled reliable single-use manufacturing at scale. Hospitals with budget constraints and high turnover of patient populations have opted for vinyl-based cuffs for standardized, hygienic monitoring. Additionally, vinyl cuffs have demonstrated durability for extended single-patient use, particularly in isolation wards and infectious disease control programs.
In 2025, single-use disposable cuffs are projected to account for 63.0% of total market revenue, driven by infection control requirements and global best practices. Adoption has been influenced by rising concerns over hospital-acquired infections (HAIs) and antibiotic-resistant pathogens. As a result, regulatory and accreditation bodies have issued mandates encouraging the replacement of reusable cuffs with disposable alternatives.
Procurement policies in large health systems now favour single-use models to streamline disinfection workflows and avoid cross-contamination. Their availability in color-coded sizes and universal connectors has ensured operational efficiency for nurses and emergency care teams.
Holding a 48.7% revenue share in 2025, hospitals remain the largest end user of disposable blood pressure cuffs. This growth has been attributed to centralized monitoring systems, continuous patient admissions, and the need for infection-safe diagnostic practices. Multi-departmental use ranging from emergency rooms to surgical units has resulted in high-volume, standardized cuff consumption.
Additionally, global hospital hygiene protocols and JCI accreditation standards have mandated the use of single-use accessories to prevent cross-patient contamination. Disposable cuffs have been integrated into hospital-wide procurement through centralized purchasing contracts, allowing bulk ordering and optimized inventory control. The requirement for real-time vital signs monitoring, especially in ICUs and post-operative care, has driven consistent usage of disposable BP cuffs.
Challenge
Environmental Concerns and Waste Management
The Disposable Blood Pressure Cuffs Market is hindered by environmental issues and medical waste management. The use of single-use cuffs is increasing and creates biomedical waste volume, making sustainability a problem. Healthcare Institutions are subject to strict rules about medical waste disposal, and the challenge is to create environmentally friendly solutions without sacrificing sterilization and safety.
Cost Constraints and Supply Chain Disruptions
Healthcare organizations in many developing regions are also challenged by the adoption of more expensive disposable blood pressure cuffs. However, the original prices of reusable cuffs seem much cheaper when purchased in bulk which compromises the uptake of their disposable equivalents. Furthermore, Global crises lead to supply chain disruptions, raw material shortages, and logistical inefficiency impacts product availability and prices.
Opportunity
Rising Demand for Infection Control in Healthcare
Infection control & Patient safety are getting a lot of focus & interest which creates dynamic revenue opportunities for the Disposable Blood Pressure Cuffs Market. Disposable cuffs minimize the potential for cross-contamination or infection between patients and thus enhance patient safety, making them a vital item in hospitals, clinics, and ambulatory care settings, including intensive care units and aggregate isolation wards.
Advancements in Sustainable and Cost-Effective Materials
Manufacturers have growth opportunities by developing biodegradable and recyclable materials for disposable blood pressure cuffs. Advancements in commercial production methods that conservatively process and packaged products along with government stimulus for eco-friendly medical products will continue to propel market growth
Disposable blood pressure cuffs and their related targets need to be monitored more closely due to their implications during Patient care that will enable infection transmission through blood-based devices. Moreover, the increasing number of prominent healthcare facilities and the implement of more favourable government policies for infection control procedures drive the adoption in the country.
Similarly, rise in the prevalence of hypertension and other cardiovascular diseases is further propelling the demand for disposable cuffs within the healthcare premises, as well as home care. Increasing investment of major healthcare providers for the advanced cost-effective disposable solutions is fueling the market growth.
| Country | CAGR (2025 to 2035) |
|---|---|
| United States | 12.0% |
Burgess highlights that the UK Market is driven by the demand of infection control measures as the healthcare professionals have to follow stringent regulations in terms of healthcare which would call for more and more infection control. This is primarily due to government initiatives undertaken to reduce hospital-acquired infections and the increasing demand for disposable medical supplies among hospitals and clinics.
Moreover, the rising geriatric population necessitating continuous medical monitoring are booming for cost-effective and hygienic disposable blood pressure cuffs. The integration of advanced medical technologies in the healthcare sector also drives the market’s growth in the UK.
| Country | CAGR (2025 to 2035) |
|---|---|
| United Kingdom | 11.6% |
Owing to international medical safety standards, growing elderly population, and rising awareness regarding infection control in medical environments, the European Market for disposable blood pressure cuffs is witnessing a great demand. The growth is driven by the higher presence of key medical device manufacturers and the increased expenditure on healthcare infrastructure.
Moreover, the promotion of single-use medical equipment by government-funded programs to minimize cross-contamination risk is expected to widen the market. The tendency towards digitalization of healthcare is also likely to drive the market for disposable blood pressure monitoring devices in the region.
| Region | CAGR (2025 to 2035) |
|---|---|
| European Union | 11.7% |
The South Korean market is anticipated to grow by advancements in medical technology, increasing investment in infection control, and rising prevalence of cardiovascular disease requiring frequent blood pressure monitoring. Demand for disposable blood pressure cuffs is driven by the country’s rapidly aging population and an increasing focus on preventive healthcare.
Moreover, the government support towards innovative healthcare solution coupled with ever increasing adoption of smart healthcare systems are accelerating the market growth. Increase in the number of private healthcare and rising awareness about hygiene in hospitals are the drivers for South Korea disposable blood pressure cuffs market.
| Country | CAGR (2025 to 2035) |
|---|---|
| South Korea | 11.9% |
The global disposable blood pressure cuffs market is experiencing steady growth, driven by rising healthcare awareness, increasing hospital-acquired infection (HAI) concerns, and the growing demand for single-use medical products. The adoption of disposable cuffs in hospitals, clinics, and ambulatory care settings is further fueled by stringent infection control regulations and the need for cost-effective patient monitoring solutions.
Welch Allyn (Hillrom) (20-25%)
Spurred by its expertise in infection control, Welch Allyn has become the market leader in disposable blood pressure cuffs tailored more specifically to the needs of healthcare institutions.
GE Healthcare (15-20%)
As a solution, high-precision disposable BP cuffs are offered by GE Healthcare, which does not compromise on accuracy or hygiene.
Philips Healthcare (12-16%)
Philips has hospital and clinic blood pressure cuff solutions that are designed to be sustainable and increase patient comfort.
Omron Healthcare (8-12%)
Omron offers relatively inexpensive, lightweight, disposable BP cuffs also for the home and ambulatory care environments.
SunTech Medical (5-9%)
SunTech focuses on antimicrobial disposable BP cuffs to help reduce infections in healthcare settings.
Other Key Players (30-40% Combined)
The disposable blood pressure cuffs market is evolving with contributions from various manufacturers, including:
The overall market size for disposable blood pressure cuffs market was USD 338.8 Million In 2025.
The Disposable Blood Pressure Cuffs market is expected to reach USD 1,033.6 Million in 2035.
The demand for disposable blood pressure cuffs will be driven by infection control needs among surgeons, physicians, and clinicians, ensuring patient safety.
The top 5 countries which drives the development of Disposable Blood Pressure Cuffs market are USA, European Union, Japan, South Korea and UK.
Infection control, patient safety, and the increased prevalence demand supplier to command significant share over the assessment period.


Full Research Suite comprises of:
Market outlook & trends analysis
Interviews & case studies
Strategic recommendations
Vendor profiles & capabilities analysis
5-year forecasts
8 regions and 60+ country-level data splits
Market segment data splits
12 months of continuous data updates
DELIVERED AS:
PDF EXCEL ONLINE
Disposable Drills Market Size and Share Forecast Outlook 2025 to 2035
Disposable Food Containers Market Size and Share Forecast Outlook 2025 to 2035
Disposable Protective Apparel Market Size and Share Forecast Outlook 2025 to 2035
Disposable Plates Market Size and Share Forecast Outlook 2025 to 2035
Disposable Hygiene Adhesives Market Size and Share Forecast Outlook 2025 to 2035
Disposable Umbilical Cord Protection Bag Market Size and Share Forecast Outlook 2025 to 2035
Disposable E-Cigarettes Market Size and Share Forecast Outlook 2025 to 2035
Disposable Pen Injectors Market Size and Share Forecast Outlook 2025 to 2035
Disposable Trocars Market Analysis - Size, Share, and Forecast Outlook 2025 to 2035
Disposable Cups Market Size and Share Forecast Outlook 2025 to 2035
Disposable Electric Toothbrushes Market Size and Share Forecast Outlook 2025 to 2035
Disposable Barrier Sleeves Market Size and Share Forecast Outlook 2025 to 2035
Disposable Plastic Pallet Market Size and Share Forecast Outlook 2025 to 2035
Disposable Curd Cups Market Size and Share Forecast Outlook 2025 to 2035
Disposable Egg Trays Market Size and Share Forecast Outlook 2025 to 2035
Disposable Cutlery Market Size, Growth, and Forecast 2025 to 2035
Disposable Spinal Instruments Market Analysis - Size, Share, and Forecast 2025 to 2035
Disposable Lids Market Analysis - Growth & Forecast 2025 to 2035
Disposable Face Mask Market Insights – Growth & Demand 2025 to 2035
The Disposable Insulin-delivery Device Market is segmented by Delivery Pumps, Patches, Pens, and Syringes from 2025 to 2035

Thank you!
You will receive an email from our Business Development Manager. Please be sure to check your SPAM/JUNK folder too.
Chat With
MaRIA