The digital transformation market is estimated to be valued at USD 1.5 billion in 2025 and is projected to reach USD 16.9 billion by 2035, registering a compound annual growth rate (CAGR) of 27.3% over the forecast period.
Chief digital officers evaluate transformation initiatives based on return on investment projections, implementation timeline feasibility, and organizational change readiness when orchestrating enterprise-wide modernization programs encompassing customer relationship management upgrades, supply chain digitization, and employee experience enhancement projects. Strategy development involves analyzing current state assessments, future state visioning, and gap analysis completion while considering budget constraints, skill availability, and cultural resistance factors necessary for successful transformation execution. Investment prioritization balances immediate efficiency gains against long-term competitive positioning, incorporating risk mitigation strategies, stakeholder alignment requirements, and measurable outcome definition that justify transformation expenditure through demonstrable business value creation.
Implementation operations require comprehensive project management, change management coordination, and technology integration orchestration that ensure seamless adoption while maintaining business continuity throughout complex organizational transformation initiatives. Execution coordination involves managing vendor relationships, internal resource allocation, and timeline synchronization while addressing training requirements, data migration challenges, and security protocol establishment across multiple transformation workstreams. Quality assurance encompasses user acceptance testing, performance validation, and benefit realization tracking that confirm transformation effectiveness while supporting continuous improvement and optimization throughout implementation phases.
Organizational alignment involves executive leadership, information technology teams, and business unit representatives collaborating to optimize transformation strategies that balance technological capability with business objectives while addressing specific industry requirements and competitive pressures. Change management encompasses communication planning, training program development, and resistance mitigation while coordinating with human resources, operations management, and customer service functions. Success measurement includes productivity improvement tracking, customer satisfaction enhancement, and operational cost reduction that validate transformation investment effectiveness throughout organizational evolution.
Technology advancement prioritizes low-code development platforms, artificial intelligence democratization, and edge computing deployment that accelerate transformation timelines while reducing implementation complexity and technical skill requirements throughout organizational digitization initiatives. Platform evolution includes integrated workflow automation, predictive analytics capabilities, and real-time collaboration tools that optimize operational efficiency while enabling data-driven decision making and process optimization. Innovation encompasses quantum computing preparation, extended reality integration, and blockchain implementation that expand transformation possibilities while supporting next-generation business model development and competitive differentiation.
Service specialization addresses financial services requiring regulatory compliance automation, healthcare organizations needing interoperability enhancement, and manufacturing companies seeking Industry 4.0 implementation that leverage transformation expertise for specific industry challenges. Consulting organizations coordinate with technology vendors, systems integrators, and change management specialists to develop comprehensive transformation programs addressing client-specific requirements while maintaining implementation efficiency and outcome achievement. Specialized offerings encompass digital culture development, agile methodology adoption, and innovation lab establishment that require deep expertise and proven transformation methodologies.
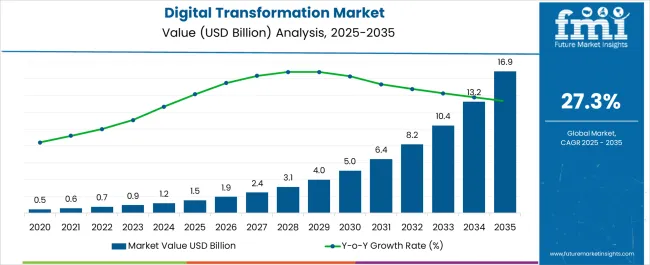
| Metric | Value |
|---|---|
| Digital Transformation Market Estimated Value in (2025 E) | USD 1.5 billion |
| Digital Transformation Market Forecast Value in (2035 F) | USD 16.9 billion |
| Forecast CAGR (2025 to 2035) | 27.3% |
The digital transformation market is expanding rapidly as enterprises across industries accelerate investments in modern technologies to enhance agility, scalability, and customer engagement. The integration of data driven decision making, automation, and advanced analytics is driving adoption across both developed and emerging markets.
Growing reliance on connected devices, cloud platforms, and artificial intelligence is reshaping operational frameworks, enabling enterprises to streamline processes while improving efficiency. Regulatory pressures, cybersecurity considerations, and the need for resilient IT infrastructures are further influencing adoption patterns.
The outlook for the sector remains positive, supported by continuous innovation, increasing digital literacy, and rising enterprise focus on future ready business models.
The market is segmented by Technology, Enterprise Size Type, Deployment Model, and Industry and region. By Technology, the market is divided into Cloud Computing, Big Data, Analytics, Cybersecurity, Artificial Intelligence, Internet of Things, and Others (Blockchain & Business Intelligence). In terms of Enterprise Size Type, the market is classified into Large Enterprises and Small and Medium-sized Enterprises (SMEs). Based on Deployment Model, the market is segmented into On-premises and Cloud. By Industry, the market is divided into Banking, Financial Services, and Insurance (BFSI), Manufacturing, IT, and Telecommunications, Retail and Consumer Goods, Healthcare, Transportation and Logistics, Government, and Others. Regionally, the market is classified into North America, Latin America, Western Europe, Eastern Europe, Balkan & Baltic Countries, Russia & Belarus, Central Asia, East Asia, South Asia & Pacific, and the Middle East & Africa.
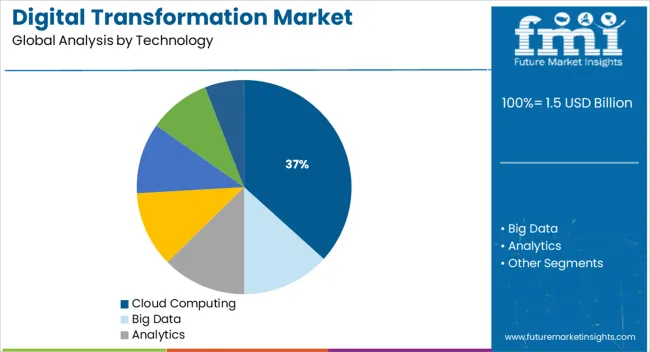
The cloud computing segment is projected to hold 36.70% of the overall market revenue by 2025 within the technology category, establishing itself as the leading segment. This growth is attributed to the ability of cloud solutions to deliver scalability, flexibility, and cost efficiency while enabling real time collaboration.
The shift away from legacy infrastructure toward subscription based models has been reinforced by increasing enterprise focus on agility and global accessibility. In addition, cloud platforms facilitate rapid integration of emerging technologies such as machine learning and big data analytics, further increasing their adoption.
As organizations continue to prioritize remote work infrastructure and digital ecosystems, the role of cloud computing in driving digital transformation is expected to remain dominant.
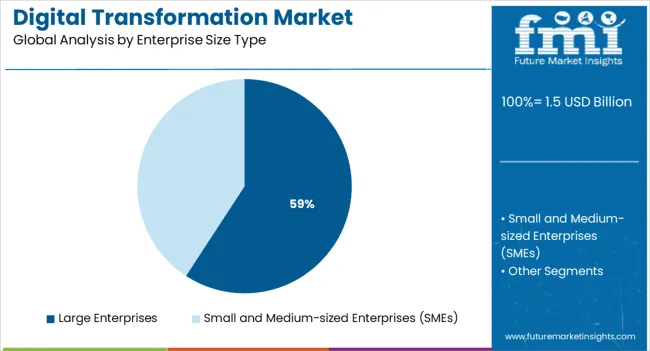
The large enterprises segment is anticipated to account for 59.20% of total market revenue by 2025 under the enterprise size type category, positioning it as the leading contributor. This is driven by the ability of large organizations to invest heavily in digital infrastructure, implement enterprise wide transformation strategies, and align operations with evolving consumer expectations.
Their established IT frameworks, larger workforce bases, and focus on cross border operations create significant demand for scalable digital solutions. Additionally, these enterprises are more likely to integrate advanced analytics, automation, and AI technologies to optimize operations and improve customer engagement.
The leadership of this segment is further reinforced by strong budgets, long term partnerships with technology vendors, and the ability to adopt large scale change.
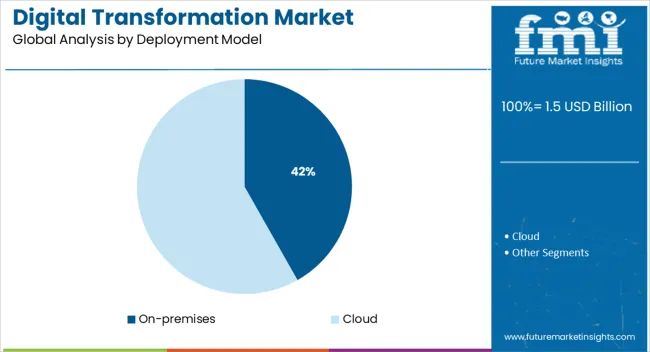
The on premises deployment model is expected to capture 41.80% of the total market revenue by 2025, making it the leading segment within deployment models. This is supported by heightened concerns over data security, regulatory compliance, and control over critical enterprise applications.
Industries such as banking, healthcare, and government continue to favor on premises solutions for sensitive workloads that require stringent data governance. Furthermore, the ability to customize solutions, integrate with legacy systems, and maintain direct oversight of IT infrastructure has preserved demand for this model.
Despite the growing momentum of cloud based deployments, on premises platforms remain essential for enterprises prioritizing reliability, confidentiality, and compliance requirements.
As per FMI, the digital transformation market is expected to reach USD 16.9 billion by 2035. In the first half of 2025, the global market recorded a CAGR of 25.8%, with a market share of USD 1.5 billion. Although not evenly distributed throughout all regions, this growth is stronger in developing markets, where it is predicted to reach USD 930.73 billion by 2025 with a CAGR of 27.3%.
Many organizations around the world were facing budget constraints due to lockdown situations during the pandemic. During this time, many organizations provided their employees with the opportunity to work from home.
Consequently, several IT enterprises plan to adopt infrastructure as a service and software as a service to manage their distributed workforce.
According to a Deloitte survey in the United States, around 75% of IT organizations adopted more than one service in 2024 to meet remote working demands. Remote workers can accomplish a wide range of tasks. A business optimization process is achieved using a variety of advanced technologies, such as artificial intelligence, cloud computing, and big data tools, products, and capabilities.
| Historical CAGR | 25.8% |
|---|---|
| Historical Market Value (2025) | USD 731.13 billion |
| Forecast CAGR | 27.3% |
Growing Adoption and Investment in Cloud Infrastructure, IoT, and 5G
In the future, 5G, IoT, and cloud technologies are expected to enhance the capacity, functionality, and flexibility of several industries, especially cloud businesses. Many businesses are combining 5G with cloud services to improve speed, low latency, and capacity. Ericsson, for example, has over 230 customers worldwide for its cloud infrastructure. The company's top customers include Swisscom, Telkomse, Telefonica, Far EasTone, XL Axiata, and many others.
Along with providing a telco-grade cloud platform called Ericsson NFVI, which has 5G and cloud functionality, Ericsson also offers IT and IoT applications on cloud computing platforms like SaaS, PaaS, and IaaS. By partnering with one another, acquiring one another, and collaborating, the companies are investing in the development of 5G and cloud infrastructure. For instance,
Technologies Related to Big Data are Widely Adopted
Through the use of cloud computing, big data, analytics, mobile, and social media, companies have been able to innovate and transform themselves, resulting in the expansion of their businesses. The use of digital technologies has replaced the legacy approach to doing business.
Data has now become recognized as a new resource. Businesses must benefit from the data they have collected to make informed decisions quickly. Due to this need for in-depth knowledge, the use of big data and related technologies has increased. Due to the expansion of businesses worldwide, data volumes and sources have increased exponentially.
Business and governmental institutions are entering a revolutionary phase of consumer engagement as a result of significant technical breakthroughs and an ever-evolving legal environment. Emerging revolutions are playing a key role as businesses explore cutting-edge technologies like big data, cloud computing, and artificial intelligence to boost organizational growth.
In recent years, digital technology has changed business approaches away from traditional business models. Many companies are integrating big data, analytics, machine learning, and other capabilities into their current business platforms. This is to gain a competitive advantage and produce new products and services.
As a result of digital technology, companies can also implement customer-centric marketing techniques that offer a range of possibilities. For instance, through AI-driven technologies such as natural language processing, companies can develop a better understanding of their customers and create highly personalized marketing campaigns that are tailored to each customer’s individual needs.
It is expected that large enterprises might dominate the market and hold 57.2% of the revenue share in 2025. These organizations are taking advantage of digital transformation because it offers cost-effectiveness and smooth implementation of business processes.
Having a successful solution is crucial for large enterprises since they need easier framework coordination, better adaptability, and data protection. Large enterprises can implement advanced techniques across organizations and speed up change across various areas due to their financial capability. Large enterprises play an imperative role in developing innovation-driven concepts and promoting digital awareness.
Over the forecast period, the Small and Medium Enterprises (SMEs) segment is projected to witness a significant CAGR of 29.2%. SMEs are deploying digital workplace services rapidly despite limited organizational infrastructure.
Several benefits are provided to SMEs by it, including increased worker productivity, mobilized desk-based operations, shorter time to market, lower costs, and better customer service.
As a result of lower costs and scalability, SMEs are increasingly adopting cloud-based solutions, which lowers capital expenditures for SMEs. During the forecast period, these factors are expected to drive the growth of the digital workplace market for SMEs.
In 2025, the BFSI segment dominated the market and accounted for over 27.6% of the revenue share. It is due to the shifting focus of banks and other financial institutions toward providing enhanced experiences as products and services become more commodity-like.
It is essentially banking companies' focus on providing seamless assistance and technical support to develop customer-centric approaches that are driving the market. For instance, the introduction of AI-enabled chatbots in the banking sector has enabled them to offer a more personalized experience to customers and help them to resolve queries quickly.
Based on revenue share, Asia Pacific dominated the global digital transformation market in 2025 with 39.1% and is expected to maintain its dominance during the forecast period.
By integrating advanced technologies like cloud computing, artificial intelligence, big data, analytics, mobility, cybersecurity, and IoT, the business ecosystem in the Asia Pacific is being transformed, stimulating growth. Digital technologies have transformed the traditional approach to business into a modern one.
The region is becoming a trending hotspot for digital transformation as a result of growing investments in digitalization across potential economies. Due to government initiatives and vendor investments, the country's digital transformation market is experiencing strong growth.
Government officials launched the Digital Agency last year to drive digital transformation in Japan as part of their administrative reform agenda. The move accelerated the public sector's digitalization.
Governments are cooperating with big technology businesses from across the world to promote digitization in the area. For example, Cisco collaborated with the government of Japan in February last year on a digitization project that included several industry verticals. These include government, education, healthcare, and business.
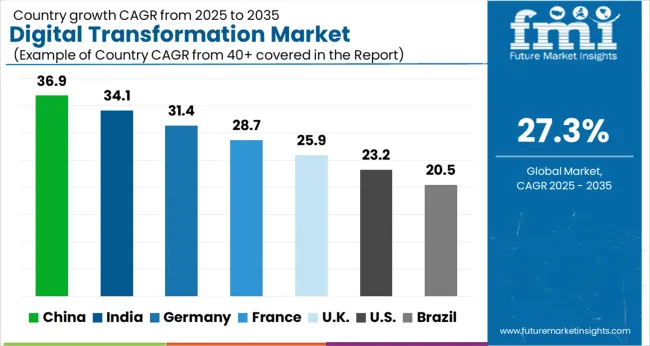
High adoption of online payment modes and increased usage of the Internet contributed to the dominance of the market in 2025. It held a 45.2% share of North America.
To speed up the digital transformation journey in the United States, various initiatives are being undertaken by government agencies, including strict adherence to regulations to protect data. As more and more organizations use digital transformation to reach the masses, market growth in the region is expected to increase significantly.
Most organizations in this region have access to dynamic and adaptable IT support, which is crucial to digital transformation. Due to high retail, manufacturing, and automotive operations, the United States has a significant lead in advanced programming and software solutions. The government in the United States invested more than USD 1.2 billion in 2024 to provide Americans with high-speed internet access and advanced technology.
During the forecast period, the United Kingdom is expected to capture a significant share of the Europe market. This is due to the surge of connected devices and data flows, societies and economies in this region have experienced a radical digital transition.
This is a result of digitalization and the growth of many kinds of communications. The United Kingdom digital transformation market is driven by the need for businesses to remain competitive in a rapidly changing technological landscape.
The increasing adoption of cutting-edge technologies such as cloud computing, artificial intelligence, and the Internet of Things. Businesses are looking to digitalize their operations to improve efficiency, enhance competitiveness, and better serve their customers.
Governments in the United Kingdom are taking proactive measures to adopt digital technology and spur regional growth. The government in the United Kingdom has launched several initiatives to support digital transformation, including the ‘Digital Strategy’ and the ‘Made Smarter Review’, which aim to encourage businesses to adopt cutting-edge technologies and digitalize their operations.
Digital transformation is increasingly being adopted by various industries, including finance, healthcare, retail, and manufacturing, among others. These factors are leading to increased demand for digital transformation solutions in the United Kingdom.
The combination of a crucial and growing market, high levels of investment, government support, and strong infrastructure makes the digital transformation market an attractive destination in China for companies looking to expand within the Asia Pacific.
Despite China's rapid robotization, the region's significant adopter continues to be Asia's crucial market for industrial robots. China, the leading adopter in the region, saw a 20% increase in installations with 168,400 units sold. China has embraced the digital revolution more quickly than any other nation in the world, making it a key market in the Asia Pacific. This creates a significant and growing market for digital transformation solutions in China. Along with Tencent, Alibaba, and Huawei, China is home to many of the world's crucial technology companies, all of which have invested heavily in digital transformation solutions that are driving innovation and growth.
China has prioritized digital transformation, launching initiatives such as the Made in China 2025 plan to promote innovation and commercialization. The government's commitment to digital transformation attracts talent and investment.
In China, there have been significant investments in technology infrastructure, including 5G networks and cloud computing. China's investment in technology infrastructure provides an excellent foundation for the development and adoption of digital transformation solutions.
Overall, India is a popular location for businesses wishing to invest in the market for digital transformation due to its expanding economy, vast talent pool, government assistance, and enormous market potential. The Indian Ministry of Commerce launched its online open platform, Open Network for Digital Commerce (ONDC), for small and medium businesses in April 2025.
For example, Microsoft's data center regions in India have contributed USD 1.5 billion to the economy over the past five years, and the cloud service market in India is projected to reach USD 10.8 billion by 2025. India's digital transformation market is attracting stakeholders for several reasons:
Businesses in the digital transformation market are embracing new technologies and modernizing their operations thanks to startups in this market. These startups offer solutions to help businesses increase efficiency, agility, and customer experience by automating cloud computing, artificial intelligence, big data, and the Internet of Things (IoT). A few of the leading startups in the digital transformation market include
In April 2025, Zurich Insurance Group (Zurich) choose 12 start-ups to collaborate on improving customer service strategies, interacting with them more frequently, and establishing industry limits. 12 startups have been selected to develop solutions such as tools for measuring and reducing carbon footprints for businesses and individuals, tools for detecting cyberbullying and preventing it, mobile health and wellness monitoring through video, and blockchain-based auto-resolution of insurance claims.
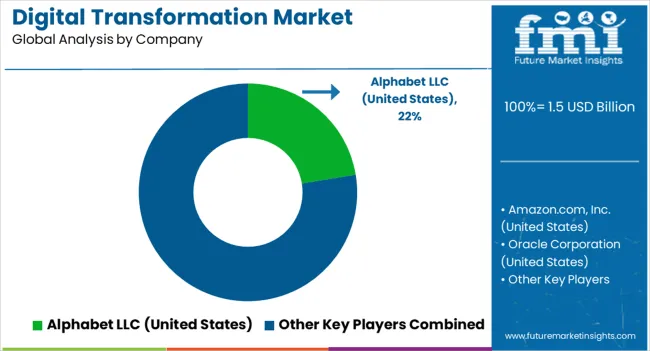
The digital transformation market is experiencing rapid expansion as enterprises accelerate modernization initiatives to enhance operational agility, customer engagement, and data-driven decision-making. Leading technology giants such as Alphabet Inc., Amazon.com Inc., and Microsoft Corporation are at the forefront, driving cloud-based platforms, AI integration, and enterprise automation that redefine digital business ecosystems. Oracle Corporation and IBM Corporation are advancing hybrid cloud and data analytics solutions that help organizations streamline legacy infrastructure and optimize digital workflows.
Apple Inc. and Salesforce Inc. are spearheading user-centric innovations through integrated ecosystems, mobility solutions, and CRM-driven intelligence that enable seamless digital experiences across platforms. SAP SE continues to lead in enterprise resource planning (ERP) transformation with AI-enabled analytics, while Cisco Systems Inc. is focusing on network modernization and cybersecurity as foundational elements of digital maturity.
Meanwhile, Alibaba Group Holding Limited plays a pivotal role in expanding digital commerce and cloud innovation across Asia-Pacific, reinforcing regional transformation momentum. Fact.MR analysis found that organizations prioritizing automation, data security, and omnichannel customer engagement are achieving the highest ROI from digital transformation initiatives, signaling a continued global shift toward resilient, intelligent, and connected enterprise operations by 2035.
| Attribute | Details |
|---|---|
| Forecast Period | 2025 to 2035 |
| Historical Data Available for | 2020 to 2025 |
| Market Analysis | USD billion for Value and MT for Volume |
| Key Regions Covered | North America; Latin America; Europe; The Middle East and Africa; East Asia |
| Key Countries Covered | United States, Canada, Brazil, Mexico, Chile, Peru, Germany, United Kingdom., Spain, Italy, France, Russia, Poland, China, India, Japan, Australia, New Zealand, GCC Countries, North Africa, South Africa, and Türkiye |
| Key Segments Covered | Technology, Enterprise Size Type, Deployment Model, Industry, Region |
| Key Companies Profiled |
Alphabet Inc., Amazon.com Inc., Oracle Corporation, Microsoft Corporation, IBM Corporation, Apple Inc., Salesforce Inc., SAP SE, Cisco Systems Inc., Alibaba Group Holding Limited |
| Report Coverage | Market Forecast, Company Share Analysis, Competition Intelligence, DROT Analysis, Market Dynamics and Challenges, and Strategic Growth Initiatives |
| Customization & Pricing | Available upon Request |
The global digital transformation market is estimated to be valued at USD 1.5 billion in 2025.
The market size for the digital transformation market is projected to reach USD 16.9 billion by 2035.
The digital transformation market is expected to grow at a 27.3% CAGR between 2025 and 2035.
The key product types in digital transformation market are cloud computing, big data, analytics, cybersecurity, artificial intelligence, internet of things and others (blockchain & business intelligence).
In terms of enterprise size type, large enterprises segment to command 59.2% share in the digital transformation market in 2025.


Our Research Products

The "Full Research Suite" delivers actionable market intel, deep dives on markets or technologies, so clients act faster, cut risk, and unlock growth.

The Leaderboard benchmarks and ranks top vendors, classifying them as Established Leaders, Leading Challengers, or Disruptors & Challengers.

Locates where complements amplify value and substitutes erode it, forecasting net impact by horizon

We deliver granular, decision-grade intel: market sizing, 5-year forecasts, pricing, adoption, usage, revenue, and operational KPIs—plus competitor tracking, regulation, and value chains—across 60 countries broadly.

Spot the shifts before they hit your P&L. We track inflection points, adoption curves, pricing moves, and ecosystem plays to show where demand is heading, why it is changing, and what to do next across high-growth markets and disruptive tech

Real-time reads of user behavior. We track shifting priorities, perceptions of today’s and next-gen services, and provider experience, then pace how fast tech moves from trial to adoption, blending buyer, consumer, and channel inputs with social signals (#WhySwitch, #UX).

Partner with our analyst team to build a custom report designed around your business priorities. From analysing market trends to assessing competitors or crafting bespoke datasets, we tailor insights to your needs.
Supplier Intelligence
Discovery & Profiling
Capacity & Footprint
Performance & Risk
Compliance & Governance
Commercial Readiness
Who Supplies Whom
Scorecards & Shortlists
Playbooks & Docs
Category Intelligence
Definition & Scope
Demand & Use Cases
Cost Drivers
Market Structure
Supply Chain Map
Trade & Policy
Operating Norms
Deliverables
Buyer Intelligence
Account Basics
Spend & Scope
Procurement Model
Vendor Requirements
Terms & Policies
Entry Strategy
Pain Points & Triggers
Outputs
Pricing Analysis
Benchmarks
Trends
Should-Cost
Indexation
Landed Cost
Commercial Terms
Deliverables
Brand Analysis
Positioning & Value Prop
Share & Presence
Customer Evidence
Go-to-Market
Digital & Reputation
Compliance & Trust
KPIs & Gaps
Outputs
Full Research Suite comprises of:
Market outlook & trends analysis
Interviews & case studies
Strategic recommendations
Vendor profiles & capabilities analysis
5-year forecasts
8 regions and 60+ country-level data splits
Market segment data splits
12 months of continuous data updates
DELIVERED AS:
PDF EXCEL ONLINE
Digital Transformation Industry Analysis in MENA Size and Share Forecast Outlook 2025 to 2035
Digital Transformation in Manufacturing Market Size and Share Forecast Outlook 2025 to 2035
Digital Transformation in Healthcare Market Analysis – Size, Share & Forecast 2025 to 2035
Digital Transformation in Supply Chain Market
Rail Freight Digital Transformation Market Size and Share Forecast Outlook 2025 to 2035
Digital Hall Effect Gaussmeter Market Size and Share Forecast Outlook 2025 to 2035
Digital Group Dining Service Market Size and Share Forecast Outlook 2025 to 2035
Digital Pathology Displays Market Size and Share Forecast Outlook 2025 to 2035
Digital Rights Management Market Size and Share Forecast Outlook 2025 to 2035
Digital Liquid Filling Systems Market Size and Share Forecast Outlook 2025 to 2035
Digital X-Ray Equipment Market Size and Share Forecast Outlook 2025 to 2035
Digital Marketing Analytics Industry Analysis in Latin America Forecast Outlook 2025 to 2035
Digital Health Market Forecast and Outlook 2025 to 2035
Digital Pen Market Forecast and Outlook 2025 to 2035
Digital X-ray Market Size and Share Forecast Outlook 2025 to 2035
Digital Elevation Model Market Size and Share Forecast Outlook 2025 to 2035
Digital Pump Controller Market Size and Share Forecast Outlook 2025 to 2035
Digital Textile Printing Market Size and Share Forecast Outlook 2025 to 2035
Digital Printing Paper Market Size and Share Forecast Outlook 2025 to 2035
Digital Battlefield Market Size and Share Forecast Outlook 2025 to 2035

Thank you!
You will receive an email from our Business Development Manager. Please be sure to check your SPAM/JUNK folder too.
Chat With
MaRIA