The Digital Signature Market is estimated to be valued at USD 4.8 billion in 2025 and is projected to reach USD 29.4 billion by 2035, registering a compound annual growth rate (CAGR) of 19.9% over the forecast period.
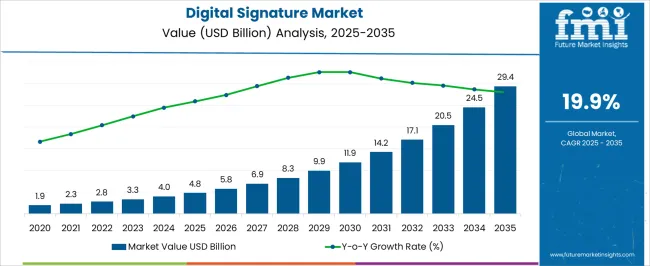
| Metric | Value |
|---|---|
| Digital Signature Market Estimated Value in (2025 E) | USD 4.8 billion |
| Digital Signature Market Forecast Value in (2035 F) | USD 29.4 billion |
| Forecast CAGR (2025 to 2035) | 19.9% |
The digital signature market is expanding rapidly due to the rising need for secure and legally binding electronic authentication across industries. Growing digital transformation initiatives, increasing adoption of cloud-based applications, and heightened regulatory compliance requirements are fueling adoption.
The integration of advanced encryption, blockchain, and identity verification technologies has improved the reliability and trustworthiness of digital signature solutions. Enterprises and government organizations are prioritizing digital workflows to enhance efficiency, reduce paperwork, and improve data security.
The outlook remains promising as businesses continue to embrace digital channels, with demand being reinforced by cybersecurity awareness, remote work trends, and cross-border digital transactions.
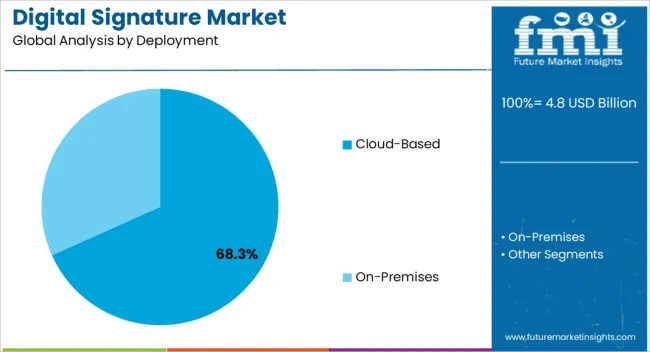
The cloud based deployment segment is projected to account for 68.30% of total market revenue by 2025, establishing it as the leading deployment model. This dominance is being driven by its scalability, cost efficiency, and ability to provide real time access across distributed workforces.
Organizations have increasingly adopted cloud platforms to streamline contract management and document authentication without the need for heavy infrastructure investment. Enhanced integration with enterprise software, remote access support, and strong security protocols have further accelerated the adoption of cloud based solutions.
As enterprises prioritize agility and digital connectivity, cloud based deployment continues to lead the digital signature market.
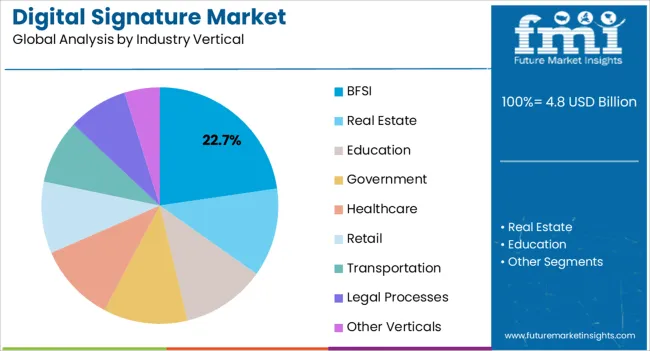
The BFSI segment is expected to hold 22.70% of the total revenue share by 2025 within the industry vertical category, making it a key growth driver. This position is attributed to the sector’s stringent regulatory environment, high volume of sensitive transactions, and increasing emphasis on fraud prevention.
Digital signatures have been deployed to secure customer onboarding, loan approvals, insurance claims, and digital banking services. Their ability to reduce paperwork, speed up transaction cycles, and ensure compliance with global data protection standards has strengthened adoption within financial institutions.
As the BFSI sector continues to digitize services and enhance customer trust, the reliance on digital signatures is expected to intensify, consolidating its importance in this vertical.
Historical Outlook for the Digital Signature Industry
Over the period from 2020 to 2025, the global digital signature market witnessed significant growth and transformative developments. The adoption of digital signatures gained momentum as organizations recognized their potential to enhance security, streamline business processes, and facilitate efficient document management. Companies across various sectors, including finance, healthcare, government, and legal, embraced digital signatures to eliminate the reliance on traditional paper-based documentation.
During this period, the digital signature market experienced a surge in demand, driven by the increasing need for secure and legally binding electronic transactions. Organizations sought to comply with evolving regulatory frameworks and leverage technological advancements to safeguard sensitive data and ensure authentication. The market witnessed a notable shift towards cloud-based digital signature solutions, offering scalability, accessibility, and seamless integration with existing workflows.
The emergence of advanced technologies such as blockchain and biometrics played a pivotal role in enhancing the security and trustworthiness of digital signatures. With its decentralized and tamper-proof nature, blockchain provides a robust foundation for validating and verifying digital signatures. Biometric authentication methods, such as fingerprint and facial recognition, added an extra layer of security and improved user experience.
Future Forecast for the Digital Signature Industry
During the assessment period, the market is poised to yield a dollar opportunity worth USD 4.8 billion. Looking ahead to the period from 2025 to 2035, the digital signature market is poised for continued growth and innovation. Advancements in technology, evolving regulatory landscapes, and changing business requirements will shape the future of this industry. Organizations will increasingly rely on digital signatures as a fundamental component of their digital transformation strategies.
The forecast suggests a substantial expansion in adopting digital signatures across industries, focusing on enhancing security, compliance, and operational efficiency. The demand for secure digital transactions will only intensify as the world becomes more interconnected. The market is expected to witness significant investments in research and development to enhance further the authentication capabilities, user experience, and interoperability of digital signature solutions.
With the proliferation of Internet of Things (IoT) devices and the advent of smart contracts, the digital signature market will experience new opportunities and challenges. The ability to securely sign and authenticate transactions within IoT ecosystems and decentralized networks will be a key area of focus. Additionally, adopting standards and regulations related to digital signatures will continue to evolve, creating a favorable environment for market growth.
Based on deployment, on-premise digital signature solutions were most prevalent, recording an 18.7% CAGR from 2020 to 2025.
Digital signature solutions provide many advantages, such as enhanced security, reduced turnover time, lower costs, and increased efficiency. Growing government focus on eliminating paperwork in the overall workflow is driving uptake. Furthermore, the constant need for data security during sensitive information transmission has led to a greater and faster rate of adoption of digital signatures. Also, companies need to secure their network to gain confidence in consumers.
A growing number of connected devices, including smartphones, tablets, and laptops, is further expected to drive the demand for digital signatures across the globe. The increasing eCommerce market boosts the growth of the digital signature market. Furthermore, adopting cloud-based solutions would increase penetration into the Digital Signature market. Expenses of stationery are reduced due to the use of electronic documents. The rising banking and financial sector adoption rate boosts market growth in the forecasted period.
Increasing digitalization in several industries is likely to revolutionize the business. Most companies' rising acceptance of dematerialization is one of the major factors driving the market's growth. Paperless solutions have many advantages, such as convenience, speed, and superior workflow efficiency.
Governments are investing substantial amounts in digitizing their processes and documentation, which, in turn, is expected to support the adoption of digital signatures. For instance, in May 2024- Rashtriya Swayamsevak Sangh (RSS) affiliate Swadeshi Jagran Manch (SJM) launched a digital signature campaign that appealed to the Indian government to use its sovereign rights to grant a compulsory license to more pharmaceutical companies for the production of COVID vaccines and medicines.
A lack of awareness about the legality and benefits of digital signatures hinders the market's growth. In some developing countries adoption of digital signatures is less than in developed nations due to the lack of awareness regarding the benefits of a digital signature. Lack of knowledge regarding legality is one factor affecting the growth of the digital signature market. For instance, ESIGN Act (Electronic Signature in Global and National Commerce Act), GPEA (Government Paperwork Elimination Act), EU law (EU Directive for Electronic Signatures), and Indian IT Act 2000, among others. However, the public across various countries is unaware of the existence of the digital signature law.
Also, high implementation costs and incompatibility among digital signature techniques will hinder market growth as many companies hesitate to utilize technology owing to new rules and regulations. Another factor limiting the market's development is security concerns related to data and an increasing number of cyber-attack. All these factors hinder the growth of the digital signature market. Uncertain regulations are also projected to slow the industry's growth.
On-premise deployment dominates the digital signature industry, capturing a significant share of 61.3%. The need for enhanced control over data security and compliance requirements drives this preference. Companies specializing in on-premise digital signature solutions should highlight features like customizable workflows, offline signing capabilities, and integration with existing enterprise software.
The Banking, Financial Services, and Insurance (BFSI) sector holds a significant share of 17.2% in the digital signature industry. This vertical's adoption of digital signature solutions is fueled by the need to streamline operations, improve customer experiences, and ensure regulatory compliance. Solution providers targeting the BFSI sector should focus on robust authentication mechanisms, seamless document integration, and compliance with industry-specific regulations like Know Your Customer (KYC) and Anti-Money Laundering (AML) requirements.
| Regions | Market Share in 2025 |
|---|---|
| United States | 16.2% |
| Germany | 10.3% |
| Australia | 6.5% |
| Japan | 3.8% |
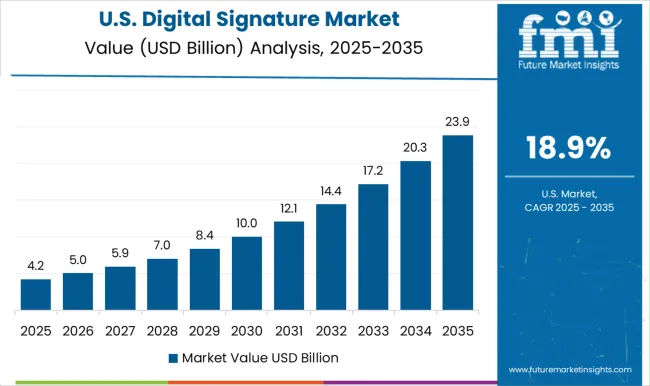
The United States holds a significant value share of 16.2% in the global digital signature industry. The United States has emerged as a leader in driving innovation and adoption of digital signature solutions. The robust technological infrastructure, coupled with a favorable regulatory environment, has fueled the growth of the digital signature market.
Organizations across sectors, including finance, healthcare, and legal, have embraced digital signatures to streamline processes, enhance security, and improve customer experience. The United States market continues to witness advancements in eCommerce and digital transactions, further boosting the demand for digital signature solutions.
According to the analysis, the global market is estimated to be dominated by North America. It is estimated at USD 7.5 billion, recording a CAGR of 21.6% during the forecast period. Also, the government in the United States is focused on deploying digital signature-based solutions in various spheres. Government regulations supporting the implementation of digital signatures, especially in financial and legal service firms, are the major factor driving market growth in these regions.
In August 2024, senators in the United States introduced Digital Authenticity for Court Orders Act of 2024, intending to improve procedures for the authentication and secure delivery of court orders as there was a growing problem of using bogus court documents to authorize surveillance improperly.
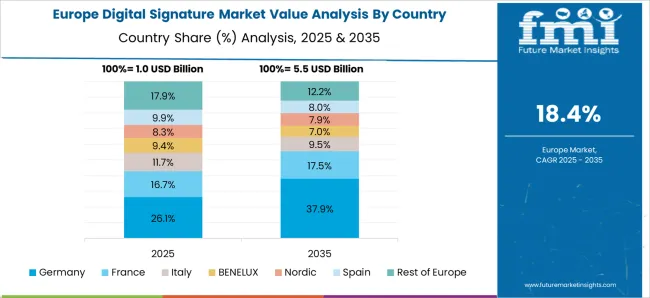
Europe is likely to garner considerable market share, with the United Kingdom contributing USD 1.8 billion, expanding at a 21.9% CAGR. Some of the most significant consumers are sectors such as BFSI, real estate, education, government, and healthcare. Also, rapid digitalization is expected to positively benefit the market in the region in the coming time. In addition, growing partnerships among players are expected to augment the market in the United Kingdom. Government initiatives to promote a paperless and secure working environment at enterprises are expected to spur market growth in the region.
Germany captures a significant value share of 10.3% in the global digital signature industry. Germany strongly emphasizes data security, privacy, and regulatory compliance. The country's stringent data protection laws and regulations have contributed to the increased adoption of digital signatures. German organizations prioritize secure and legally binding electronic transactions, and digital signatures provide a trusted solution to meet these requirements. The market in Germany is driven by the need for seamless integration with existing business processes, data protection measures, and widespread digitization efforts across industries.
Australia holds a significant value share of 6.5% in the global digital signature industry. Australia has been proactive in embracing digital transformation across various sectors. The country's growing digital economy and a digitally savvy population have fueled the adoption of digital signature solutions.
Organizations in Australia seek to enhance operational efficiency, reduce paper-based processes, and improve customer experiences by implementing digital signatures. Additionally, government initiatives promoting the digitization of public services have further accelerated the adoption of digital signature solutions in Australia.
Asia Pacific is projected to be the most lucrative market in the assessment period. The region is witnessing rapid adoption of advanced technologies, which is a salient factor boosting the market in Asia Pacific.
China showcases a remarkable CAGR of 23.1% in the global digital signature industry. This growth can be attributed to the country's expanding digital landscape, increasing adoption of electronic transactions, and government initiatives to promote digitalization. Businesses aiming to capitalize on this lucrative market should align their offerings with the Chinese market's unique preferences and regulatory requirements.
India exhibits an exceptional value CAGR of 24.3% in the global digital signature industry. The country's digital transformation initiatives, growing e-commerce sector, and rising demand for secure online transactions contribute to its substantial growth. Companies entering the Indian market should emphasize user-friendly digital signature solutions, localized customer support, and strategic partnerships with local businesses.
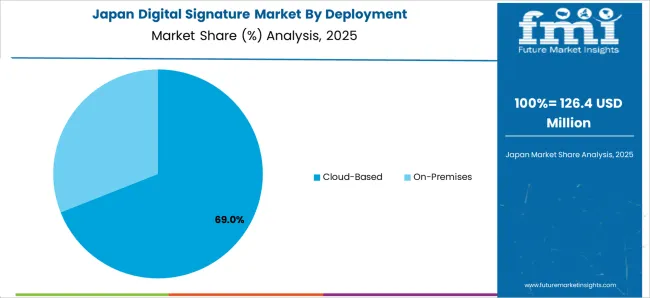
Japan captures a value share of 3.8% in the global digital signature industry. Advancements in technology and collaboration characterize Japan's digital signature market. The country has witnessed notable developments in biometric authentication methods and blockchain-based solutions, contributing to the growth of digital signature adoption. Japanese organizations focus on enhancing security measures, fostering trust, and improving the user experience. Partnerships between technology providers, government bodies, and businesses drive innovation in the digital signature ecosystem in Japan.
| Countries | Estimated CAGR |
|---|---|
| China | 16.2% |
| India | 24.3% |
| United Kingdom | 21.9% |
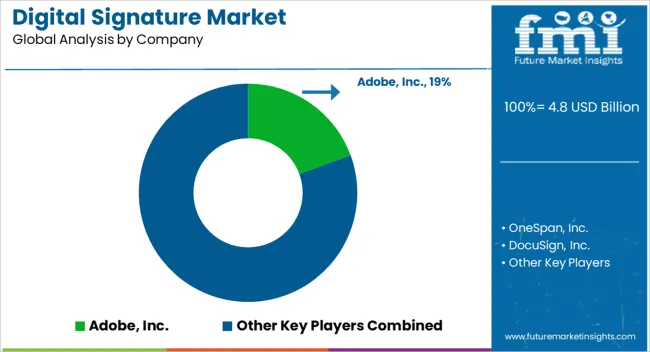
In the digital signature industry, several key players are vying for dominance and striving to stay ahead of the curve. These companies recognize the immense potential and growing demand for secure and efficient electronic document signing solutions. Let's delve into what sets them apart and fuels their success.
Recent developments among key players are:
The global digital signature market is estimated to be valued at USD 4.8 billion in 2025.
The market size for the digital signature market is projected to reach USD 29.4 billion by 2035.
The digital signature market is expected to grow at a 19.9% CAGR between 2025 and 2035.
The key product types in digital signature market are cloud-based and on-premises.
In terms of industry vertical, bfsi segment to command 22.7% share in the digital signature market in 2025.


Full Research Suite comprises of:
Market outlook & trends analysis
Interviews & case studies
Strategic recommendations
Vendor profiles & capabilities analysis
5-year forecasts
8 regions and 60+ country-level data splits
Market segment data splits
12 months of continuous data updates
DELIVERED AS:
PDF EXCEL ONLINE
Digital X-Ray Equipment Market Size and Share Forecast Outlook 2025 to 2035
Digital Marketing Analytics Industry Analysis in Latin America Forecast Outlook 2025 to 2035
Digital Health Market Forecast and Outlook 2025 to 2035
Digital Pen Market Forecast and Outlook 2025 to 2035
Digital X-ray Market Size and Share Forecast Outlook 2025 to 2035
Digital Elevation Model Market Size and Share Forecast Outlook 2025 to 2035
Digital Pump Controller Market Size and Share Forecast Outlook 2025 to 2035
Digital Textile Printing Market Size and Share Forecast Outlook 2025 to 2035
Digital Printing Paper Market Size and Share Forecast Outlook 2025 to 2035
Digital Battlefield Market Size and Share Forecast Outlook 2025 to 2035
Digital Product Passport Software Market Size and Share Forecast Outlook 2025 to 2035
Digital Lending Platform Market Size and Share Forecast Outlook 2025 to 2035
Digital Shipyard Market Size and Share Forecast Outlook 2025 to 2035
Digital Freight Matching Market Size and Share Forecast Outlook 2025 to 2035
Digital Textile Printer Market Size and Share Forecast Outlook 2025 to 2035
Digital Thermo Anemometer Market Size and Share Forecast Outlook 2025 to 2035
Digital Twins Technologies Market Size and Share Forecast Outlook 2025 to 2035
Digital Servo Motors and Drives Market Size and Share Forecast Outlook 2025 to 2035
Digital Map Market Size and Share Forecast Outlook 2025 to 2035
Digital Credential Management Software Market Size and Share Forecast Outlook 2025 to 2035

Thank you!
You will receive an email from our Business Development Manager. Please be sure to check your SPAM/JUNK folder too.
Chat With
MaRIA