The global dietary supplements market is expected to grow from USD 40 billion in 2025 to USD 60 billion by 2035, reflecting a CAGR of 9.5%. The market is experiencing substantial growth due to several key factors. Increasing health awareness among consumers has led to a surge in demand for products that support overall well-being.
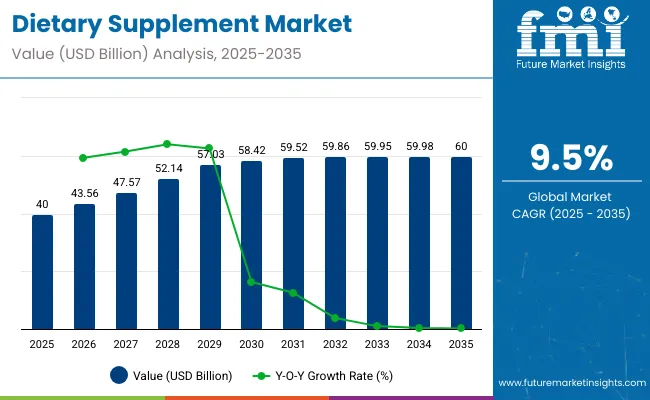
| Attributes | Description |
|---|---|
| Estimated Global Industry Size (2025E) | USD 40 Billion |
| Projected Global Industry Value (2035F) | USD 60 Billion |
| Value-based CAGR (2025 to 2035) | 9.5% |
This trend is further amplified by the rising prevalence of chronic diseases such as obesity, diabetes, and heart disease, prompting individuals to seek preventive measures and nutritional support. Additionally, the aging global population is driving the need for supplements that address age-related health concerns, including joint health, cognitive function, and bone density.
Technological advancements have also played a significant role in the market's expansion. The rise of e-commerce platforms has made dietary supplements more accessible to a broader audience, facilitating online purchases and direct-to-consumer models. Moreover, innovations in product formulations and delivery methods, such as personalized supplements tailored to individual health profiles and preferences, are attracting a diverse consumer base. These advancements cater to the growing demand for convenience and customization in health products.
By form, the softgels segment accounts for 48% share. Based on ingredients, the vitamins & minerals segment registers 33% share. China is the fastest-growing market with 10.6% CAGR. Furthermore, the COVID-19 pandemic has heightened consumer focus on immune health, leading to increased consumption of supplements aimed at boosting immunity and overall health.
Government initiatives supporting the production and availability of herbal and natural supplements have also contributed to market growth. As consumers become more proactive about their health and wellness, the dietary supplements market is poised for continued expansion, driven by evolving consumer preferences, technological innovations, and supportive policies.
Per capita spending on dietary supplements varies widely across different regions, influenced by factors like income, cultural habits, and awareness of health benefits. Developed regions typically exhibit higher spending due to greater disposable incomes and a strong focus on preventive healthcare. In contrast, emerging markets show lower per capita spending but are experiencing rapid growth as health consciousness increases and products become more accessible.
The dietary supplements market is highly regulated to ensure product safety, efficacy, and truthful labeling. Governments worldwide enforce certification requirements and regulatory frameworks to protect consumers and maintain industry standards. These regulations cover manufacturing practices, ingredient safety, health claims, and post-market surveillance. Compliance is essential for companies to gain consumer trust, avoid legal issues, and access global markets.
The dietary supplements market is segmented by ingredients into vitamins & minerals, herbal supplements, proteins and amino acids, fatty acids, and prebiotics & probiotics. By form, the market includes tablets, capsules, powder, gummies, softgels, and liquids. Regionally, the market is divided into North America, Latin America, Western Europe, Eastern Europe, East Asia, South Asia & Pacific, Central Asia, Russia & Belarus, and Middle East & Africa.
The vitamins & minerals segment capture 33% share. Vitamin and mineral supplements are widely sold because they help address common nutritional gaps in people's diets. Many individuals do not get enough essential nutrients like vitamin D, calcium, iron, or B vitamins from their daily food intake, so these supplements provide an easy way to support overall health.
They are popular for boosting immunity, improving energy levels, supporting bone health, and enhancing cognitive function. Additionally, vitamin and mineral supplements are trusted for their role in preventing deficiencies and related health issues. Their availability in convenient forms like tablets, capsules, and gummies also makes them accessible and easy to incorporate into daily routines.
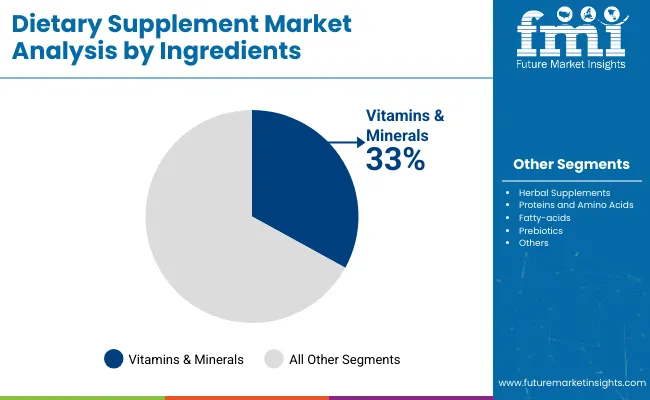
| Ingredients | Share (2025) |
|---|---|
| Vitamins & Minerals | 33% |
The softgels segment accounts for 48% share. Softgel dietary supplements are widely sold because they offer several advantages that appeal to consumers. They provide better bioavailability, meaning the body can absorb the nutrients more efficiently compared to some other forms. Softgels are easy to swallow and often have a smooth texture, which improves consumer compliance.
They also protect sensitive ingredients like oils and vitamins from oxidation and degradation, helping maintain product potency and shelf life. Additionally, softgels can mask unpleasant tastes and odors, making them more pleasant to consume. These benefits make softgel supplements a popular choice among buyers and manufacturers alike.
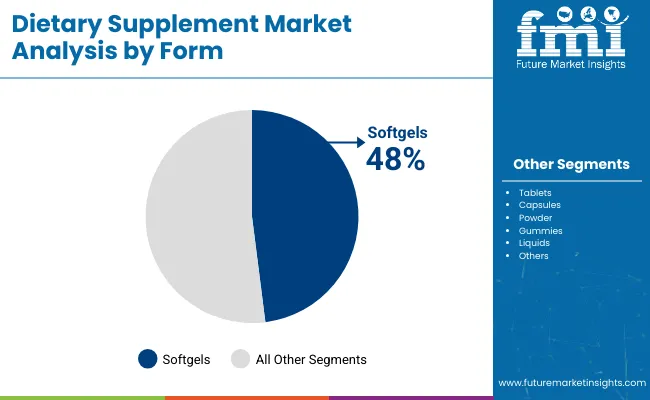
| Form | Share (2025) |
|---|---|
| Softgels | 48% |
Consumers' growing awareness of preventive healthcare measures and their increasing preference for health-promoting products, such as food additives, are expected to propel the global market as the prevalence of age- and lifestyle-related diseases rises. Both major and minor market participants are becoming increasingly innovative, which is driving the global market expansion.
Regulatory bodies, such as the US Food and Drug Administration (FDA), ensure that only wholesome and safe foods and dietary supplements are made available for sale. Such actions encourage consumers to use nutritional supplements.
During the forecast period, the market for dietary supplements is also expected to grow due to the increasing use of safe, clean-labeled, and organic ingredients in the production of food nutritional additives. The market for dietary supplements is also growing due to increasing interest in bodybuilding and sports among the general public.
Sports nutrition products and supplements are gaining popularity among athletes and sports enthusiasts seeking to enhance their endurance and performance. The trend toward sports nutrition and vitamin supplements to improve their endurance and performance will be encouraging for the market in the upcoming years.
Tier 1 companies comprise industry leaders that hold a 70% share of the global business market. These leaders are distinguished by their extensive product portfolio and high production capacity. These industry leaders stand out due to their broad geographic reach, in-depth knowledge of manufacturing and reconditioning across various formats, and strong customer base. They offer a variety of services and manufacturing solutions utilizing the latest technology, while adhering to legal requirements to ensure the highest quality.
Tier 2 companies comprise mid-sized players with a presence in some regions and a significant influence on local commerce, holding a market share of 20%. These are distinguished by their robust global presence and solid business acumen. These industry participants may not have cutting-edge technology or a broad global reach, but they do have good technology and guarantee regulatory compliance.
Tier 3 companies primarily comprise small-scale businesses serving niche markets and maintaining a local presence, with a market share of approximately 10%. Due to their notable focus on meeting local needs, these businesses are categorized as belonging to the tier 3 share segment; they are minor players with a constrained geographic scope. As an unorganized ecosystem, Tier 3 in this context refers to a sector that, unlike its organized competitors, lacks extensive structure and formalization.
Between 2025 and 2035, the dietary supplements market is expected to grow at different rates across China, the UK, and the United States. China leads with the highest projected CAGR of 10.6%, reflecting rapid market expansion fueled by increasing health consciousness and higher disposable income.
The UK follows with a CAGR of 7.9%, showing strong growth supported by rising demand for preventive health solutions. The United States is close behind at 7.8%, indicating steady growth in an already well-established market. Compared to the USA and UK, China’s growth rate is notably higher, underlining its position as the fastest-growing and most dynamic market among the three.
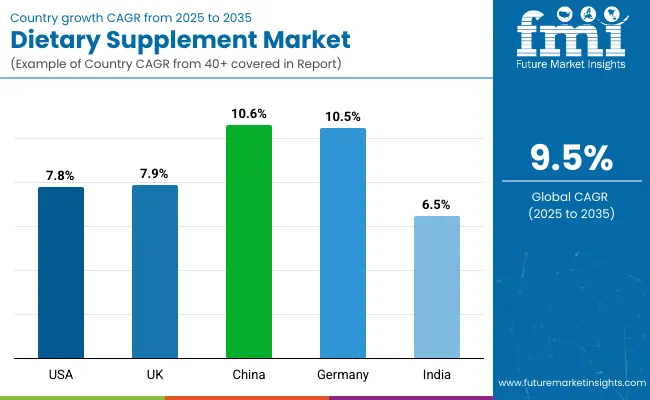
| Countries | CAGR 2025 to 2035 |
|---|---|
| United States | 7.8% |
| UK | 7.9% |
| China | 10.6% |
The United States dominates the North American dietary supplement market due to its advanced distribution systems and well-informed consumers. Pertaining to dietary supplements. The nation continues to hold a commanding market share in 2025 with about 30%. by launching creative products and maintaining a strong retail presence.
Growing demand for natural products is a defining feature of the market. and organic supplements, the growing acceptance of preventive healthcare practices, and the growing appeal of personalized nutrition.
A favorable regulatory environment, cutting-edge research facilities, and key market players all contribute to the sector's stability. Dominance of the nation’s market. These factors are reflected in the size of the USA dietary supplement market, highlighting the nation's crucial position. in the USA supplement market.
China leads the Asia-Pacific market for dietary supplements because of its sizable population and improving health. Awareness, as well as the expanding middle class.
The traditional herbal market is especially strong in China. Supplements that honor the nation's long history of using conventional medicine. Innovation in manufacturing benefits the market. E-commerce penetration, broad distribution networks, and capabilities- all of which are important aspects of the food industry in the area. Augments market size.
With a projected growth rate of roughly 7.9% over the next several years, the UK market is the one in Europe with the fastest rate of expansion. 2025 to 2035. The market is experiencing rapid growth due to increasing demand for preventive healthcare and a growing health consciousness. Goods as well as increased knowledge of nutritional supplements.
The UK market is especially strong in terms of innovation. Individualized nutrition plans and delivery methods. The strong e-commerce sector and the nation's growing consumer base. This growth trajectory is further supported by consumer preference for high-end products, which is indicative of the growing market for nutritional supplements.
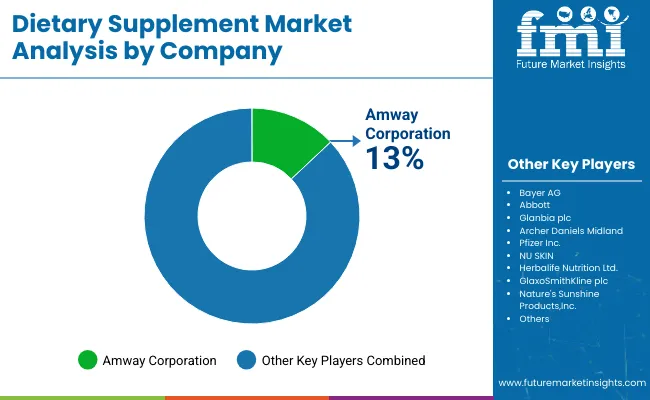
The dietary supplements market is moderately consolidated, with several major multinational corporations shaping the industry. Companies like Amway Corp., Herbalife Nutrition Ltd., and NU SKIN dominate the direct selling segment with strong global distribution networks. Pharmaceutical giants such as Bayer AG, Pfizer Inc., and GlaxoSmithKline plc. bring extensive research capabilities and trusted brand reputations.
Abbott and Glanbia plc. contribute with diverse product portfolios and nutrition science expertise, while Archer Daniels Midland focuses on raw material supply and ingredient innovation. Nature’s Sunshine Products, Inc. adds to the market with specialty herbal and natural supplements. This blend of large diversified companies and specialized players creates a competitive yet moderately consolidated landscape, fostering innovation and broad consumer reach.
| Report Attributes | Details |
|---|---|
| Current Total Market Size (2025) | USD 40 billion |
| Projected Market Size (2035) | USD 60 billion |
| CAGR (2025 to 2035) | 9.5% |
| Base Year for Estimation | 2024 |
| Historical Period | 2020 to 2024 |
| Projections Period | 2025 to 2035 |
| Report Parameter | Revenue in USD billion/Value in Metric Tons |
| By Ingredients | Vitamins & Minerals, Herbal Supplements, Proteins and Amino Acids, Fatty Acids, Prebiotics & Probiotics |
| By Form | Tablets, Capsules, Powder, Gummies, Softgels, Liquids |
| Regions Covered | North America, Latin America, Western Europe, Eastern Europe, East Asia, South Asia & Pacific, Central Asia, Russia & Belarus, Middle East & Africa |
| Countries Covered | United States, Japan, Germany, India, United Kingdom, France, Italy, Brazil, Canada, South Korea, Australia, Spain, Netherlands, Saudi Arabia, Switzerland |
| Key Players | Amway Corp., Bayer AG, Abbott, Glanbia plc, Archer Daniels Midland, Pfizer Inc., NU SKIN, Herbalife Nutrition Ltd., GlaxoSmithKline plc, Nature's Sunshine Products, Inc., RBK Nutraceuticals Pty Ltd, XanGo, LLC, American Health, Good Health New Zealand, DuPont de Nemours, Inc., NOW Foods, Nature's Bounty |
| Additional Attributes | Aging population, e-commerce growth, clean-label trends |
| Customization and Pricing | Available upon request |
By form, methods industry has been categorized into Tablets, Capsules, Powder, Gummies, Softgels and Liquids
By ingredients, industry has been categorized into Vitamins & Minerals, Herbal Supplements, Proteins and Amino Acids, Fatty-acids and Prebiotics & Probiotics
Industry analysis has been carried out in key countries of North America; Europe, Middle East, Africa, ASEAN, South Asia, Asia, New Zealand and Australia
The market is expected to grow at a CAGR of 9.5% throughout the forecast period.
By 2035, the sales value is expected to be worth USD 60 Billion.
Demand for preventive healthcare is increasing demand for Dietary Supplement.
North America is expected to dominate the global consumption.
Some of the key players in manufacturing include Pfizer Inc., NU SKIN, Herbalife Nutrition Ltd and more.


Full Research Suite comprises of:
Market outlook & trends analysis
Interviews & case studies
Strategic recommendations
Vendor profiles & capabilities analysis
5-year forecasts
8 regions and 60+ country-level data splits
Market segment data splits
12 months of continuous data updates
DELIVERED AS:
PDF EXCEL ONLINE
Dietary Supplements Packaging Market Analysis – Trends & Forecast 2025-2035
Pet Dietary Supplement Market Size and Share Forecast Outlook 2025 to 2035
Industry Share Analysis for Pet Dietary Supplement Companies
Japan Dietary Supplements Market, By Ingredients, Form, Application, and Region through 2035
Korea Dietary Supplements Market Analysis by Ingredients, Form, Application, and Region Through 2035
UK Pet Dietary Supplement Market Growth – Trends, Demand & Forecast 2025-2035
USA Pet Dietary Supplement Market Insights – Size, Share & Industry Growth 2025-2035
ASEAN Pet Dietary Supplement Market Report – Demand, Growth & Trends 2025-2035
Veterinary Dietary Supplements Market Size and Share Forecast Outlook 2025 to 2035
Demand for Dietary Supplements in EU Size and Share Forecast Outlook 2025 to 2035
Europe Pet Dietary Supplement Market Trends – Growth, Demand & Outlook 2025-2035
Australia Pet Dietary Supplement Market Analysis – Size, Share & Forecast 2025-2035
North American Dietary Supplements Market Size and Share Forecast Outlook 2025 to 2035
Western Europe Dietary Supplements Market Analysis by Ingredients, Form, Application, and Country Through 2025 to 2035
Intestinal Health Pet Dietary Supplement Market Size and Share Forecast Outlook 2025 to 2035
Dog Intestinal Health Pet Dietary Supplement Market Size and Share Forecast Outlook 2025 to 2035
Dietary Fiber Gummies Market Size and Share Forecast Outlook 2025 to 2035
Dietary Fiber Market Analysis - Size, Share, and Forecast Outlook 2025 to 2035
Food Dietary Fibers Market Size and Share Forecast Outlook 2025 to 2035
Analysis and Growth Projections for Insoluble Dietary Fiber Business

Thank you!
You will receive an email from our Business Development Manager. Please be sure to check your SPAM/JUNK folder too.
Chat With
MaRIA