The diamond jewelry market is expected to grow steadily from USD 389.5 billion in 2025 to USD 622.5 billion by 2035, registering a CAGR of 4.8%.
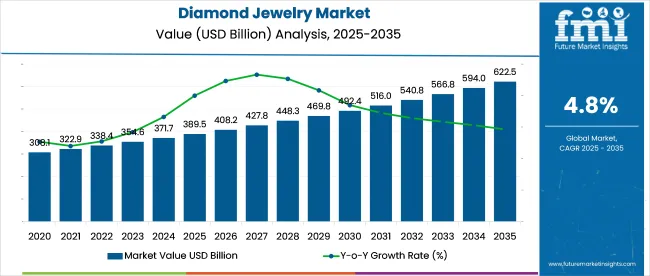
| Metric | Value |
|---|---|
| Industry Value (2025) | USD 389.5 Billion |
| Forecast Value (2035) | USD 622.5 Billion |
| Global CAGR (2025 to 2035) | 4.8% |
Product-wise, rings, necklaces, and earrings maintain dominance with a 43% market share, followed by bracelets, pendants, and other items. Among sales channels, traditional jewelry stores account for the largest portion with 33% in 2025, while online and specialty stores continue to gain traction. The market is primarily driven by women consumers, with men and unisex jewelry segments contributing to expanding product diversity.
The diamond jewelry segment commands significant influence within its parent markets, representing approximately 47% of the global Luxury Jewelry Market valued at over USD 300 billion in 2024. It also holds nearly 42% of the Bridal and Engagement Market, reflecting the cultural importance of diamonds in matrimonial ceremonies. Within the Precious Stones and Gemstones Market, estimated at USD 80 billion, diamond jewelry captures about 38%, underscoring its premium positioning.
The Global Jewelry Market, valued around USD 350 billion, includes diamond jewelry with a 36% share. Despite a smaller footprint in the broader Luxury Goods Market (USD 1.2 trillion) and Fashion & Accessories Market (USD 500 billion) at 12% and 8% respectively, the diamond jewelry market benefits from rising disposable incomes and luxury spending trends.
In November 2024, De Beers Group announced a strategic partnership with a leading online luxury retailer to enhance its digital footprint, aiming to tap into younger, tech-savvy consumers and expand sales channels globally. This initiative reflects the market’s shift towards omnichannel distribution and evolving consumer preferences.
Per capita spending on diamond jewelry varies widely across regions, influenced by income levels, cultural preferences, and economic conditions. Globally, demand is driven by occasions such as weddings, anniversaries, and luxury gifting, with consumers seeking craftsmanship, brand reputation, and design innovation.
The global trade of diamond jewelry is shaped by the interplay of skilled manufacturing, luxury demand, and strategic trading hubs. Countries with advanced cutting and polishing capabilities, along with strong export infrastructure, dominate the supply side. On the demand side, affluent consumers in established and emerging markets drive imports, fueled by cultural significance and growing disposable incomes. This dynamic creates a robust international market with diverse players engaged in production, distribution, and retail of diamond jewelry worldwide.
Major Exporting Countries
Key exporters include India, Belgium, China, Israel, and the United States. India is one of the world’s largest diamond cutting and polishing centers, exporting finished jewelry globally. Belgium, particularly Antwerp, is a major diamond trading hub, known for high-value transactions and distribution. China and the United States also export significant volumes of diamond jewelry, leveraging advanced manufacturing and strong domestic markets. Israel is renowned for precision cutting and high-quality craftsmanship.
Major Importing Countries
Leading importers include the United States, China, United Arab Emirates, Hong Kong, and Japan. These countries have significant luxury markets with strong consumer demand for diamond jewelry. The United States remains the largest single market for diamond jewelry imports, followed by China, where rising wealth is expanding luxury consumption. The UAE and Hong Kong serve as key re-export hubs and regional retail centers, while Japan maintains steady demand driven by affluent consumers.
Rings, necklaces, and earrings dominate product sales, while traditional jewelry stores lead distribution, supported by steady year-on-year growth and emerging unisex trends boosting overall market expansion.
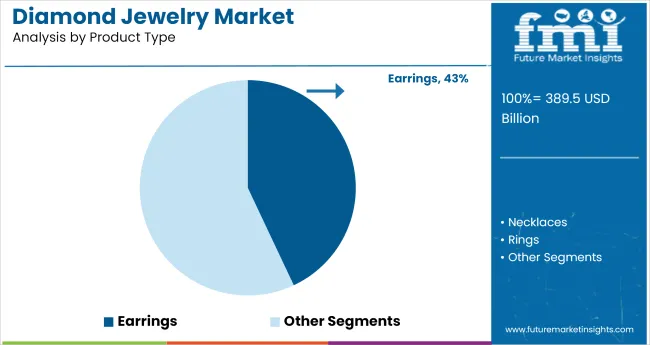
In 2025, Earrings contribute nearly 43% of global jewelry sales, reflecting a 4.7% YoY growth, but face moderate saturation in developed markets. While rings maintain cultural indispensability in weddings and engagements, earrings outperform during festive quarters in Asia.
Necklaces are gaining multifunctionality status, merging fine and fashion jewelry aesthetics. In contrast, bracelets and pendants-though stylistically dynamic-account for a lesser share and remain seasonal. AI-based design personalization is attracting affluent urban buyers, whereas rural markets rely more on traditional motifs and gold purity. The shift toward recycled metals and lab-grown diamonds is reshaping sourcing and pricing strategies.
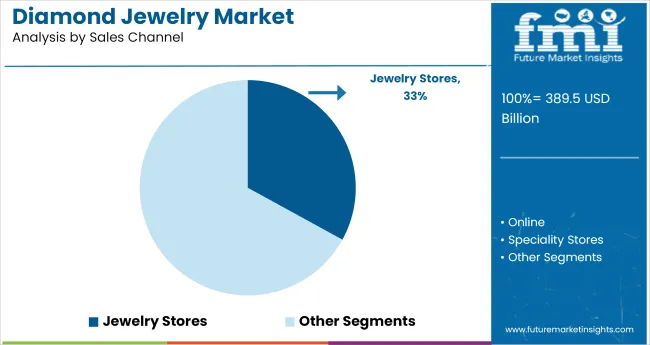
Jewelry stores continue to dominate the sales channel landscape with 33% share in 2025, growing at a modest 3.4% YoY, but their relative influence is declining. Offline trust remains key in high-involvement purchases like solitaires and bridal sets, especially in India and the Middle East. However, online platforms grew 9.8% YoY, driven by digital try-ons, EMIs, and price transparency.
Specialty stores are adapting with omnichannel models, offering online consultations and in-store pickup. While North America shows hybrid retail maturity, LATAM and ASEAN markets still favor store-first buying behavior. The contrast between generational expectations-experience vs. convenience-is reshaping showroom layouts and service models.
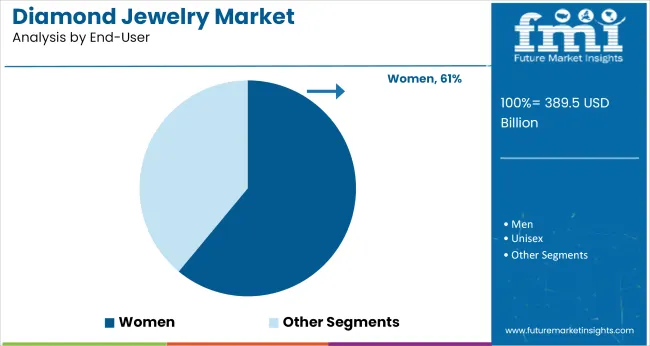
Women represent the dominant user base in 2025, contributing over 61% of jewelry market value, with a 4.3% YoY increase. This segment favors elegant, minimalist designs for daily wear and personalized gold and diamond accessories for gifting occasions. In contrast, unisex jewelry is expanding quickly-posting 7.1% YoY growth-driven by Gen Z buyers embracing fluid fashion norms.
Male-oriented segments remain niche, but watches, chains, and platinum rings are seeing renewed demand in metro markets. The convergence of fashion and identity expression is redefining consumer targeting strategies, pushing brands to diversify collections beyond gendered lines and adopt inclusive brand narratives.
Lab-grown diamond adoption and digital provenance tools are transforming diamond jewellery. Consumers are embracing affordable, traceable stones with personalized online designs, prompting brands to offer hybrid assortments and immersive purchasing experiences.
Surging Demand for Lab-Grown Diamonds Reshaping Product Mix
Lab-grown diamonds now represent around 20% of global diamond jewellery sales, driven by significant price cuts-up to 85% cheaper than natural stones-and ethical supply-chain claims. In the USA, half of engagement ring buyers opt for lab-grown stones, reflecting shifts among millennials. Major brands like Pandora and Cartier have launched dedicated lab-grown lines.
Production hubs in China, India, and Singapore are scaling with CVD and HPHT methods. Retail margins are increasing even as price-sensitive consumers gain access to higher-carat pieces, accelerating market share gains for lab-grown categories.
Digital-First Customization and Provenance Technologies Elevating Sales Channels
Consumer expectations now emphasize origin-proofing and personalized storytelling. Blockchain platforms-like Tracr and Everledger-validate provenance, while GIA’s lab-grown grading system differentiates stone types. Online configurators allow buyers to customize cut, clarity, and setting in real time, with AR previews in virtual showrooms.
E-commerce brands such as Mejuri combine digital engagement tools with in-store experiences, offering virtual design consultations. These technologies enhance purchase confidence and drive higher average order values in both digital and hybrid retail environments.
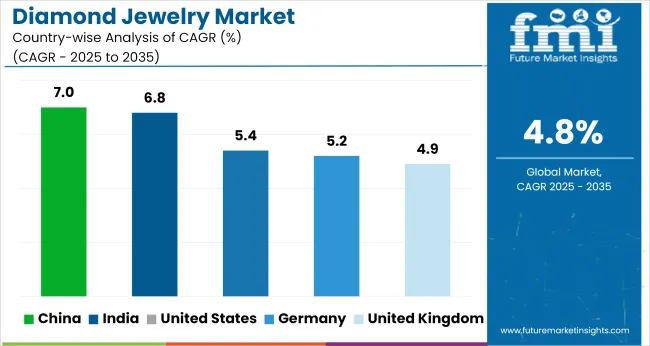
| Countries | CAGR (2025 to 2035) |
|---|---|
| United States | 5.4% |
| United Kingdom | 4.9% |
| Germany | 5.2% |
| India | 6.8% |
| China | 7% |
China and India are leading the global diamond jewelry market growth, with CAGR values of 7.0% and 6.8% respectively-well above the global average of 4.8%. The United States and Germany, both OECD members, show moderate but steady growth due to a combination of premium product demand and brand-driven consumption.
The United Kingdom, with a 4.9% CAGR, aligns closely with the global average, reflecting market maturity and relatively stable demand. GCC and ASEAN markets, though not listed, are expected to exhibit luxury-driven demand with high per capita expenditure in affluent subregions.The report covers detailed analysis of 40+ countries and the top five countries have been shared as a reference.
Changing relationship milestones and personalization trends are driving a projected CAGR of 5.4% from 2025 to 2035 in the United States diamond jewelry market. Millennials and Gen Z are shifting the narrative toward ethical sourcing and minimalist designs. Engagement ring trends are leaning toward custom and vintage-inspired settings.
Major brands are investing in AR-powered virtual try-ons and concierge services to elevate omnichannel experiences. Department stores and DTC brands are equally competing for affluent and aspirational buyers, with increased visibility during seasonal peaks and milestone events.
Refined consumer preferences and growing appetite for traceable luxury contribute to a 4.9% CAGR between 2025 and 2035 in the United Kingdom’s diamond jewelry market. Buyers prioritize provenance, often opting for conflict-free diamonds with verifiable sourcing documentation.
Timeless designs in solitaires and tennis bracelets remain popular, especially in legacy households. Independent jewelers see strong interest from urban buyers seeking individuality over mass-market designs. Custom commissions and repair-restyle services are gaining popularity. The market benefits from international tourism and digital retail touchpoints post-Brexit.
High-value purchases in Germanyjewelry market are set to rise at a CAGR of 5.2% from 2025 to 2035, backed by a national emphasis on quality, precision, and minimalist aesthetics. Buyers increasingly opt for understated yet high-purity pieces that reflect durability and design simplicity. Regional goldsmiths and atelier brands offer curated collections combining diamonds with platinum and recycled metals.
Traditional purchase occasions like weddings and anniversaries still dominate, though personalization is rising across younger segments. Transparency around origin and composition supports consumer trust, while in-store consultations remain an integral part of the buying process.
Rising incomes and deep-rooted gifting culture are expected to push India’s diamond jewelry market to grow at a 6.8% CAGR through 2035. Branded outlets are expanding in tier-2 cities, offering certified stones and EMI-based purchases. Diamond adoption is increasing in daily-wear categories such as pendants and office-wear rings.
Bridal buyers still dominate volume sales, though gifting occasions like anniversaries and festivals are becoming key contributors. Trust in certification, better designs, and rising female-first purchases support this ongoing formalization. Online channels offer virtual consultations, increasing accessibility beyond metros.
China’s preference for wearable luxury and tech-integrated retailing is fueling a projected 7.0% CAGR from 2025 to 2035. Middle-income consumers in urban clusters increasingly choose lab-created and lightweight diamond pieces for daily use. Experiential store formats and livestream selling have grown rapidly in post-pandemic retail.
Brands leverage mini-collections, influencer tie-ups, and financing options to attract digitally native buyers. Demand peaks around Lunar New Year, Valentine’s Day, and graduation season. Provenance and authenticity remain key, with blockchain-backed certification growing in popularity.
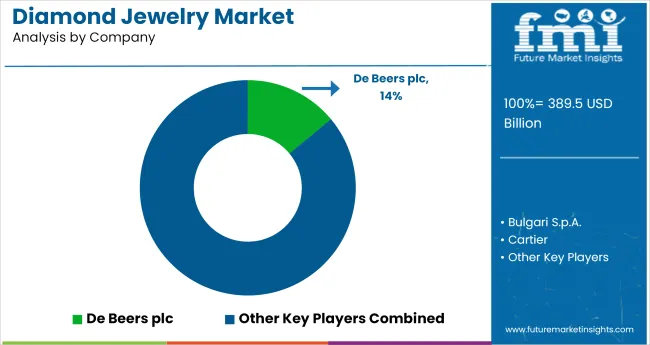
Leading Company - De Beers plcMarket Share - 14%
The diamond jewelry market is dominated by luxury leaders such as De Beers plc, Tiffany & Co., and Cartier, who control significant brand equity, vertically integrated operations, and exclusive access to high-quality diamonds. These dominant players drive consumer trust through ethical sourcing, timeless design, and global retail footprints.
Key players including Bulgari S.p.A., Signet Jewelers, and Pandora Jewellery, LLC focus on accessible luxury, personalization, and multi-channel retail strategies. Emerging players like Chow Tai Fook, Swarovski AG, Petra Diamonds, and Trans Hex Group cater to regional markets and new-age consumers with lab-grown alternatives and modern collections. Growth is driven by gifting trends, weddings, and rising demand for traceable, conflict-free diamonds.
Recent Industry News
| Report Attributes | Details |
|---|---|
| Market Size (2025) | USD 389.5 billion |
| Projected Market Size (2035) | USD 622.5 billion |
| CAGR (2025 to 2035) | 4.8% |
| Base Year for Estimation | 2024 |
| Historical Period | 2020 to 2024 |
| Forecast Period | 2025 to 2035 |
| Quantitative Units | USD billion for value, Units Sold for volume |
| Product Type Segments | Rings, Necklaces, Earrings, Bracelets, Pendants, Others |
| Sales Channel Segments | Jewelry Stores, Online, Specialty Stores, Departmental Stores, Others |
| End-User Segments | Women, Men, Unisex |
| Countries Covered | United States, Canada, Brazil, Mexico, Germany, United Kingdom, France, Italy, China, India, Japan, South Korea, Saudi Arabia, UAE, South Africa, Australia |
| Key Players Influencing the Market | Tiffany & Co., Bulgari S.p.A., Cartier, Signet Jewelers, De Beers plc, Pandora Jewellery, LLC, Chow Tai Fook Jewellery Group Limited, Swarovski AG, Petra Diamonds Limited, Trans Hex Group |
| Additional Attributes | Dollar by sales, share by jewelry type and end-user, trends in consumer preferences across geographies, omni-channel retail performance, demand seasonality insights, and market potential in emerging luxury hubs. |
By product type, Market is divided into Rings, Necklaces, Earrings, Bracelets, Pendants, and Others.
By sales channel, the market includes Jewelry Stores, Online, Specialty Stores, Departmental Stores, and Others.
In terms of end users, the market is divided between Women, Men, and Unisex.
Region wise, the market is divided into North America, Latin America, Europe, South Asia, East Asia, Oceania, and the Middle East & Africa (MEA).
Market is expected to be valued at USD 389.5 billion in 2025.
Market is forecast to reach USD 622.5 billion by 2035.
Market is projected to grow at a CAGR of 4.8% over the forecast period.
Earrings lead the Market with a 43% share in 2025.
De Beers plc is the leading company in the Diamond Jewelry Market, holding a 14% market share.


Our Research Products

The "Full Research Suite" delivers actionable market intel, deep dives on markets or technologies, so clients act faster, cut risk, and unlock growth.

The Leaderboard benchmarks and ranks top vendors, classifying them as Established Leaders, Leading Challengers, or Disruptors & Challengers.

Locates where complements amplify value and substitutes erode it, forecasting net impact by horizon

We deliver granular, decision-grade intel: market sizing, 5-year forecasts, pricing, adoption, usage, revenue, and operational KPIs—plus competitor tracking, regulation, and value chains—across 60 countries broadly.

Spot the shifts before they hit your P&L. We track inflection points, adoption curves, pricing moves, and ecosystem plays to show where demand is heading, why it is changing, and what to do next across high-growth markets and disruptive tech

Real-time reads of user behavior. We track shifting priorities, perceptions of today’s and next-gen services, and provider experience, then pace how fast tech moves from trial to adoption, blending buyer, consumer, and channel inputs with social signals (#WhySwitch, #UX).

Partner with our analyst team to build a custom report designed around your business priorities. From analysing market trends to assessing competitors or crafting bespoke datasets, we tailor insights to your needs.
Supplier Intelligence
Discovery & Profiling
Capacity & Footprint
Performance & Risk
Compliance & Governance
Commercial Readiness
Who Supplies Whom
Scorecards & Shortlists
Playbooks & Docs
Category Intelligence
Definition & Scope
Demand & Use Cases
Cost Drivers
Market Structure
Supply Chain Map
Trade & Policy
Operating Norms
Deliverables
Buyer Intelligence
Account Basics
Spend & Scope
Procurement Model
Vendor Requirements
Terms & Policies
Entry Strategy
Pain Points & Triggers
Outputs
Pricing Analysis
Benchmarks
Trends
Should-Cost
Indexation
Landed Cost
Commercial Terms
Deliverables
Brand Analysis
Positioning & Value Prop
Share & Presence
Customer Evidence
Go-to-Market
Digital & Reputation
Compliance & Trust
KPIs & Gaps
Outputs
Full Research Suite comprises of:
Market outlook & trends analysis
Interviews & case studies
Strategic recommendations
Vendor profiles & capabilities analysis
5-year forecasts
8 regions and 60+ country-level data splits
Market segment data splits
12 months of continuous data updates
DELIVERED AS:
PDF EXCEL ONLINE
India Lab Grown Diamond Jewelry Market Size and Share Forecast Outlook 2025 to 2035
Diamond and CBN Micron Powder Market Size and Share Forecast Outlook 2025 to 2035
Diamond Tool Grinding Machine Market Size and Share Forecast Outlook 2025 to 2035
Diamond Wall Saw Market Size and Share Forecast Outlook 2025 to 2035
Diamond-like Carbon Coatings market Size and Share Forecast Outlook 2025 to 2035
Diamond Like Carbon (DLC) Coating Market Size and Share Forecast Outlook 2025 to 2035
Diamond Core Drilling Market Analysis - Size, Share, and Forecast Outlook 2025 to 2035
Diamond Wire Market Size & Outlook 2025 to 2035
Diamond-Blackfan Anemia (DBA) Syndrome Therapeutics Market - Growth & Innovations 2025 to 2035
Competitive Overview of Diamond Core Drilling Market Share
Dental Diamond Bur Market Size and Share Forecast Outlook 2025 to 2035
Synthetic Diamond Market Size and Share Forecast Outlook 2025 to 2035
Industrial Diamond Market Size and Share Forecast Outlook 2025 to 2035
CVD Lab-grown Diamond Market Size and Share Forecast Outlook 2025 to 2035
Jewelry Organizer Market Trends - Growth & Forecast 2025 to 2035
Jewelry Cleaners Market
Demi-fine Jewelry Market Forecast and Outlook 2025 to 2035
Ultrasonic Jewelry Cleaning Machine Market Size and Share Forecast Outlook 2025 to 2035
Evaluating USA Luxury Fine Jewelry Market Share & Provider Insights
US Luxury Fine Jewelry Market Insights 2024 to 2034

Thank you!
You will receive an email from our Business Development Manager. Please be sure to check your SPAM/JUNK folder too.
Chat With
MaRIA