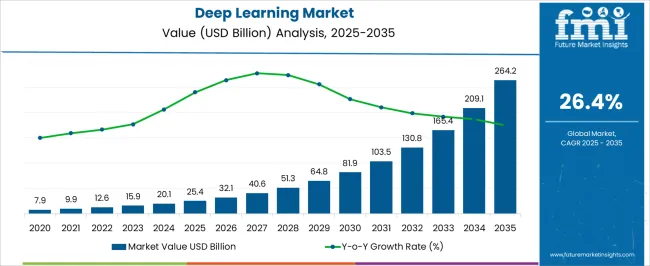
The Deep Learning Market is estimated to be valued at USD 25.4 billion in 2025 and is projected to reach USD 264.2 billion by 2035, registering a compound annual growth rate (CAGR) of 26.4% over the forecast period.
| Metric | Value |
|---|---|
| Deep Learning Market Estimated Value in (2025E) | USD 25.4 billion |
| Deep Learning Market Forecast Value in (2035F) | USD 264.2 billion |
| Forecast CAGR (2025 to 2035) | 26.4% |
The deep learning market is advancing rapidly as enterprises increasingly adopt AI-driven architectures to enable intelligent decision-making, automate processes, and deliver real-time analytics. The proliferation of big data, combined with improvements in processing power, is enabling deeper neural network architectures that support complex pattern recognition across industries. Hardware accelerators such as GPUs and AI-specific chips are being deployed at scale to meet the computational demands of training and inference workloads.
Cloud-native infrastructure and edge deployment models are making deep learning accessible to a wider range of enterprises, fueling democratization of AI capabilities. Industry-specific models are being fine-tuned for tasks such as fraud detection, predictive maintenance, and customer engagement.
Investments by hyperscalers, chipmakers, and software platform vendors are strengthening the overall ecosystem, driving competitive innovation and integration. As demand continues to rise across sectors like healthcare, finance, and mobility, the market is expected to sustain double-digit growth, supported by robust R&D funding, favorable policy support, and enterprise digital transformation mandates.
The market is segmented by Product, Application, and End User and region. By Product, the market is divided into Hardware, Software, and Services. In terms of Application, the market is classified into Image Recognition, Signal Recognition, Translation, and Data Mining. Based on End User, the market is segmented into Automotive, Media & Entertainment, Aerospace & Defence, BFSI, Retail, and Healthcare. Regionally, the market is classified into North America, Latin America, Western Europe, Eastern Europe, Balkan & Baltic Countries, Russia & Belarus, Central Asia, East Asia, South Asia & Pacific, and the Middle East & Africa.
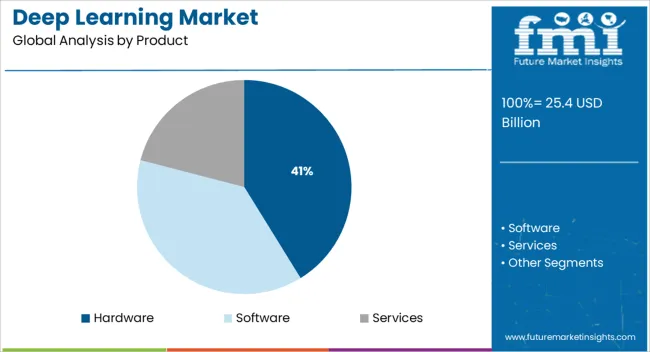
The hardware product segment is expected to capture 41.2% of total revenue in 2025, making it the leading product category in the deep learning market. This dominance is attributed to the high-performance computational requirements of training deep neural networks, which rely heavily on GPUs, TPUs, FPGAs, and custom ASICs.
The increasing complexity of algorithms and the need for low latency during inference have intensified demand for specialized hardware. Enterprise investments in AI infrastructure have been driven by the need to accelerate model training and reduce time to market for AI-driven applications.
Data centers, research institutions, and edge deployment environments are adopting powerful hardware configurations to support real-time processing and scalable deployment. Strategic partnerships between AI chipmakers and cloud service providers have also strengthened hardware accessibility, reinforcing its pivotal role in the ecosystem.
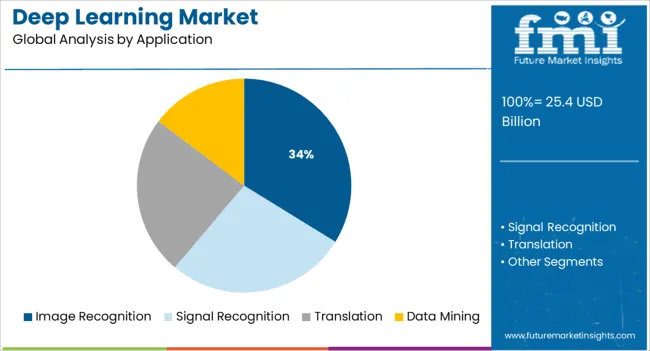
In the application category, image recognition is projected to account for 33.8% of the market revenue in 2025, securing its position as the top application. This is primarily due to the widespread integration of computer vision across industries such as healthcare, retail, manufacturing, and security.
Deep convolutional neural networks have enhanced accuracy in tasks such as object detection, facial recognition, and anomaly detection, fueling enterprise demand. The application’s relevance has been amplified by its role in automation, surveillance, quality inspection, and content moderation.
Growth has also been reinforced by adoption in edge computing environments and mobile platforms, where real-time image interpretation is essential. As AI models become more efficient and scalable, the use of image recognition is expected to expand into emerging use cases, further solidifying its leadership.
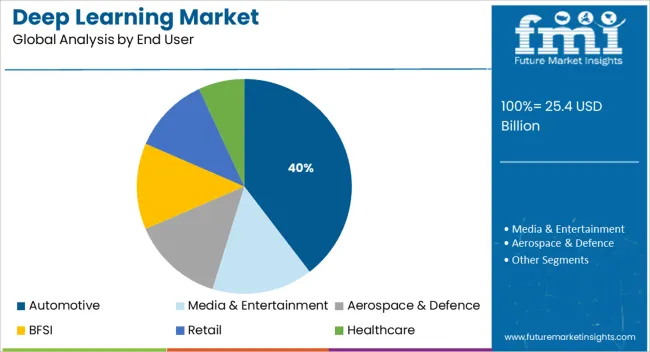
The automotive end user segment is forecasted to contribute 39.6% of total deep learning market revenue in 2025, establishing it as the leading vertical. This is being driven by the increasing integration of deep learning in advanced driver assistance systems and autonomous vehicle development.
Automakers and technology providers are leveraging AI models for real-time decision making in navigation, object detection, lane recognition, and driver behavior analysis. The growing complexity of sensor fusion from lidar, radar, and cameras necessitates robust deep learning frameworks to process and respond to dynamic driving environments.
Connected car ecosystems are also utilizing deep learning for in-vehicle personalization, predictive maintenance, and voice-based interaction. Significant R&D investments, regulatory support for road safety innovations, and the push toward electrification and autonomy are expected to sustain the automotive sector’s leading position in deep learning adoption through the forecast period.
Rising necessity for hardware platforms with high computing power to execute deep learning algorithms is one of the major factors that is expected to accelerate the growth of the Deep Learning Market during the forecast period. In addition, the growing usage of deep learning in data analytics and database systems are expected to create lucrative growth opportunities for Deep Learning Market.
The technology is gaining prominence because of advancements in data center capabilities, high computing power, and the ability to perform tasks without human interactions. Moreover, the rapid adoption of cloud-based technology across several industries is fueling the growth of the market. Deep learning algorithms can perform several repetitive and routine tasks more efficiently within a shorter time than human beings. In addition, the quality of the work is maintained and provides accurate insights.
Thus, implementing deep learning in the organization can save time and money, which eventually frees up the employees to perform creative tasks that need human involvement. Therefore, deep learning is considered a disruptive technology across several end-use industries, uplifting the demand for technology.
The increasing adoption of cloud-based services and large-scale generation of unstructured data has surged the demand for deep learning solutions. Also, the growing applications of deep learning in recent years for image/speech recognition, data mining, and language translations, and the growing number of humanoid robots, for example, Sophia, developed by Hanson Robotics, are some of the major factors thar are anticipated to fuel the growth of the Deep Learning Market during the forecast period.
Growing investments for developing machine learning and deep learning applications in the region by key market players are expected to accelerate market growth. Moreover, the rapid increase in the amount of data being generated in different end-use industries is expected to provide traction to the industry growth. Additionally, the increasing need for human and machine interaction is offering new growth avenues to solution providers for providing enhanced solutions and capabilities.
Moreover, the advancements in technologies, the presence of limited structured data to increase demand for deep learning solutions, cumulative spending in healthcare, travel, tourism, and hospitality industries, and untapped potential in emerging markets are anticipated to offer favorable growth opportunities to the market growth.
There are certain restraints and challenges faced which are expected to impede the growth of the Deep Learning Market growth. The factors such as lack of technical expertise in deep learning and the absence of standards and protocols are limiting the market growth.
In addition, complex integrated systems and the integration of deep learning solutions and software into the existing systems is a difficult task which confines growth. Besides, increasing complexity in hardware due to complex algorithms, lack of flexibility and multitasking, and deployment of Deep Learning for applications such as NLP in regional dialects are the potential restraints that are hindering the overall growth of the global Deep Learning Market.
In terms of regional platform, North America holds the largest market share in Deep Learning market. The region is expected to accumulate a 36.7% revenue share in 2025. The widespread adoption of deep learning technology is one of the major factors that is expected to propel the regional growth during the forecast period. There is high growth of deep learning market in the region, due to the presence of prominent players in the region that offers deep learning services and hardware such as IBM Corporation, Qualcomm Technologies, Inc. and Intel Corporation, etc.
Increased investments in artificial intelligence and neural networks, the high adoption of image and pattern recognition in the region are the major factors that are anticipated to open new growth avenues for the Deep Learning Market over the analysis period. Moreover, the region is one of the early adopters of advanced technologies, rendering organizations adopt deep learning capabilities at a faster pace.
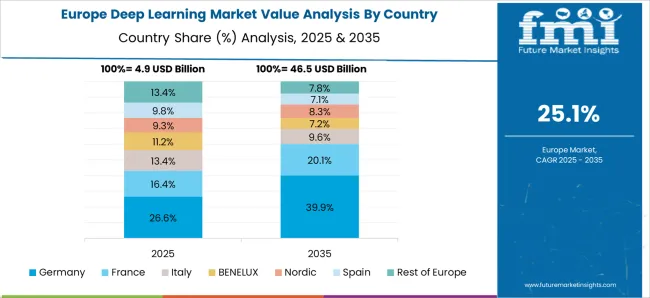
According to Future Market Insights, Europe is expected to hold significant growth opportunities for Deep Learning Market, and is expected to reach at a share of 24.5% in 2025.
Increased government support is expected to provide a positive impact on the growth of the industry in the region. The establishment of subcommittees on artificial intelligence and machine learning within the federal government is providing traction for the growth.
Europe has contributed significantly to the market growth as several new measures have been taken to support the artificial intelligence sector in the region to boost growth and deliver a digital economy. This, in turn, has offered considerable growth opportunities in the deep learning space. The UK is underpinning the technology to grow further in the areas of autonomous vehicles, smart devices, and cyber security.
According to Future Market Insights, Asia-Pacific is expected to grow with lucrative growth opportunities for Deep Learning Market, and is expected to reach at a significant share of 21.8% in 2025.
Deep learning is becoming more popular as this technology is employed in more than only electrical items like smartphones, tablets, and PCs, and yet also healthcare and automotive products. The rapid economic development of key nations such as China and India play a major role in encouraging the growth of the Asia Pacific Deep Learning Market.
Furthermore, rising government support is likely to have a positive impact on the region's industry growth. The growing need for the deep learning software, like signal recognition, image recognition, and data mining, in industries like healthcare, automotive, IT and telecommunications, aerospace & defence, as well as ongoing projects and the formation of artificial intelligence and machine learning subcommittees within the federal government, are the major factors that are projected to escalate the growth of the Deep Learning Market in Asia Pacific.
According to Future Market Insights, Middle East & Africa is expected to provide significant growth opportunities for Deep Learning Market, and is expected to reach at a share of 13.0% in 2025.
Middle East & Africa is expected to represent a significant share in the Deep Learning Market, owing to growing funding in artificial intelligence and neural networks. The region's widespread use of image and monitoring purposes is estimated to generate new growth prospects over the forecast period.
There are many prominent market players in the Deep Learning Market such as Augury, Alation, Algorithmia, Avora, Boast.ai, ClosedLoop.ai, Cognino AI, Databand, DataVisor, Exceed.ai, Indico, JAXJOX, LeadGenius, Netra, Particle, Resurface Labs, RideVision, Savvie, SECURITI.ai, SkyHive, Stravito, Uniphore, and Vertia.ai, among others, that are working hand-in-hand to provide the best-in-class Deep Learning for enhancing the global arena. However, there are many global start-ups in the Deep Learning Market, which are stepping forward in matching the requirements of the Deep Learning domain.
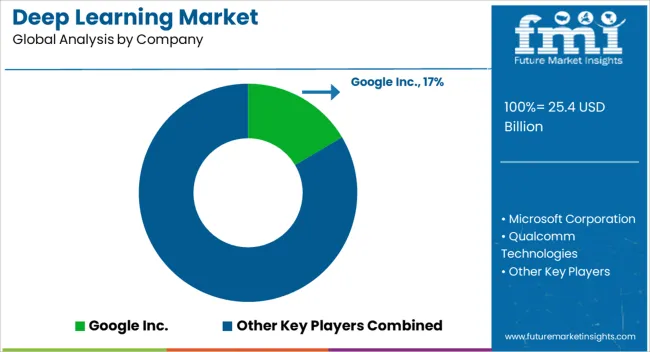
Some of the key participants present in the global Deep Learning market include NVIDIA Corporation, Intel Corporation, General Vision, Graphcore, General Vision Inc., Xilinx, Qualcomm Technologies, Google Inc., Microsoft Corporation, AWS, Sensory Inc., IBM Corporation, Samsung Electronics, Micron Technology, and Mellanox Technologies, among others.
Attributed to the presence of such high number of participants, the market is highly competitive. While global players such as NVIDIA Corporation, Intel Corporation, General Vision, Graphcore, General Vision Inc., and Xilinx, account for a considerable market size, several regional level players are also operating across key growth regions, particularly in North America.
| Report Attribute | Details |
|---|---|
| Growth Rate | CAGR of 26.4% from 2025 to 2035 |
| Base Year for Estimation | 2024 |
| Market Value in 2025 | USD 12,569.0 Million |
| Market Value in 2035 | USD 130,667.0 Million |
| Historical Data | 2020 to 2024 |
| Forecast Period | 2025 to 2035 |
| Quantitative Units | Revenue in USD Million and CAGR from 2025-2035 |
| Report Coverage | Revenue Forecast, Volume Forecast, Company Ranking, Competitive Landscape, Growth Factors, Trends and Pricing Analysis |
| Segments Covered | Product, Application, End User, Region |
| Regions Covered | North America; Latin America; Europe; Asia Pacific; Middle East and Africa |
| Key Countries Profiled | USA, Canada, Brazil, Mexico, Germany, UK, France, Spain, Italy, China, Japan, South Korea, Malaysia, Singapore, Australia, GCC, South Africa, Israel |
| Key Companies Profiled | NVIDIA Corporation; Intel Corporation; General Vision Inc.; Graphcore; Xilinx; Qualcomm Technologies; Google Inc.; Microsoft Corporation; Amazon Web Services; Sensory Inc.; IBM Corporation; Samsung Electronics; Micron Technology; Mellanox Technologies; Facebook Inc.; SAS Institute Inc. |
| Customization | Available Upon Request |
The global deep learning market is estimated to be valued at USD 25.4 billion in 2025.
The market size for the deep learning market is projected to reach USD 264.2 billion by 2035.
The deep learning market is expected to grow at a 26.4% CAGR between 2025 and 2035.
The key product types in deep learning market are hardware, software and services.
In terms of application, image recognition segment to command 33.8% share in the deep learning market in 2025.


Full Research Suite comprises of:
Market outlook & trends analysis
Interviews & case studies
Strategic recommendations
Vendor profiles & capabilities analysis
5-year forecasts
8 regions and 60+ country-level data splits
Market segment data splits
12 months of continuous data updates
DELIVERED AS:
PDF EXCEL ONLINE
Deep Brain Stimulator Market Size and Share Forecast Outlook 2025 to 2035
Deep Packet Inspection And Processing Market Size and Share Forecast Outlook 2025 to 2035
Deep Sea Robot Market Size and Share Forecast Outlook 2025 to 2035
Deep Fryer Machine Market Size and Share Forecast Outlook 2025 to 2035
Deep Depth Subsea Umbilicals, Risers and Flowlines Market Size and Share Forecast Outlook 2025 to 2035
Deep Tech Market Analysis – Innovations & Forecast 2024-2034
AI-Powered Deepfake Detection – Protecting Digital Identities
Commercial Deep Fryer Parts & Accessories Market Size and Share Forecast Outlook 2025 to 2035
Gas Commercial Deep Fryers Market Size and Share Forecast Outlook 2025 to 2035
Electric Commercial Deep Fryers Market Analysis – Trends, Growth & Forecast 2025 to 2035
Specialty Commercial Deep Fryers Market Size and Share Forecast Outlook 2025 to 2035
Learning Management System (LMS) Market Size and Share Forecast Outlook 2025 to 2035
Learning Analytics Solution Market Analysis by Solution, Deployment Mode, Service, End User, and Region Through 2035
E-Learning Solution Market by Solution, Deployment, & Region Forecast till 2035
Microlearning Platforms Market Size and Share Forecast Outlook 2025 to 2035
Microlearning Market Size and Share Forecast Outlook 2025 to 2035
Remote Learning Technology Spending Market Analysis by Technology Software, Technology Services, Learning Mode, End User and Region Through 2025 to 2035
Machine Learning As A Services Market
Augmented Learning Market
Self-supervised Learning Market Size and Share Forecast Outlook 2025 to 2035

Thank you!
You will receive an email from our Business Development Manager. Please be sure to check your SPAM/JUNK folder too.
Chat With
MaRIA