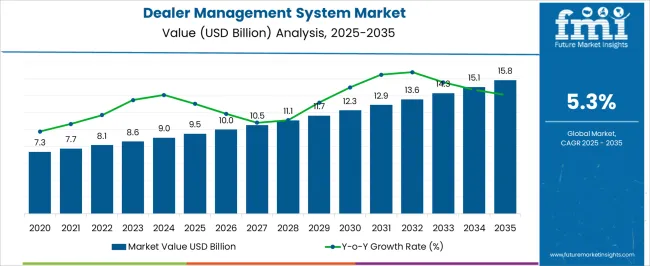
The Dealer Management System Market is estimated to be valued at USD 9.5 billion in 2025 and is projected to reach USD 15.8 billion by 2035, registering a compound annual growth rate (CAGR) of 5.3% over the forecast period.

| Metric | Value |
|---|---|
| Dealer Management System Market Estimated Value in (2025 E) | USD 9.5 billion |
| Dealer Management System Market Forecast Value in (2035 F) | USD 15.8 billion |
| Forecast CAGR (2025 to 2035) | 5.3% |
The dealer management system market is expanding steadily due to the increasing digitization of dealership operations, the need for integrated solutions, and the rising focus on customer relationship management. Growing adoption of data driven tools that streamline inventory, sales, and service workflows has positioned dealer management systems as essential for efficiency and profitability.
Advancements in automation, analytics, and mobility are further enhancing operational transparency and decision making across dealership networks. Regulatory requirements related to data security and compliance have also accelerated system adoption.
The future outlook remains strong as dealerships and fleet operators increasingly prioritize scalable platforms that unify operations, improve customer engagement, and support connected vehicle ecosystems.

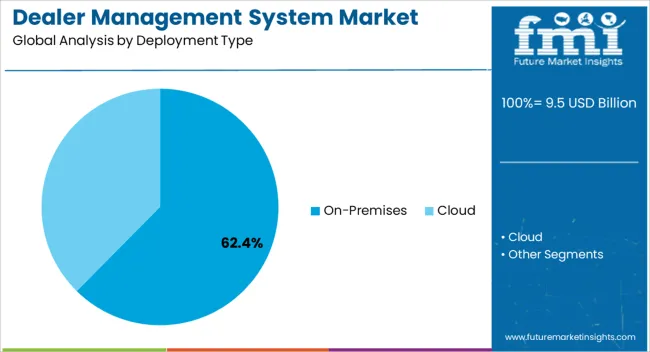
The on premises deployment type segment is projected to hold 62.40% of total market revenue by 2025, making it the most significant category. This dominance is driven by the preference for greater control over data management, system customization, and enhanced security offered by on premises solutions.
Enterprises handling sensitive customer and vehicle information have shown higher reliance on in house deployment models to maintain compliance and minimize cyber risks. Additionally, legacy investments and integration with existing IT infrastructure have reinforced the demand for on premises systems.
This combination of security, control, and compatibility with traditional workflows has established on premises deployment as the leading choice in the dealer management system market.

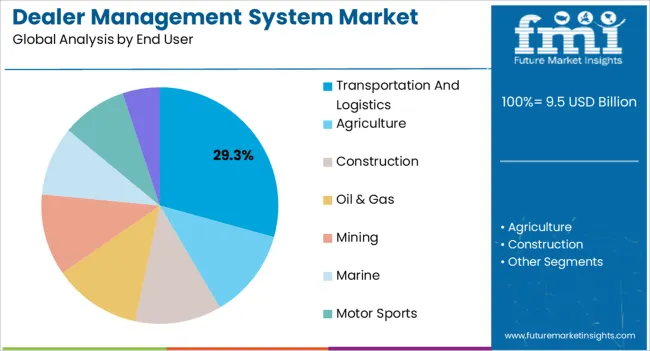
The transportation and logistics segment is anticipated to account for 29.30% of total market revenue by 2025 within the end user category. This leadership is attributed to the sector’s growing reliance on dealer management systems for fleet maintenance, spare parts management, and operational efficiency.
Rising demand for real time tracking, predictive maintenance, and optimized asset utilization has driven adoption across logistics providers and transportation enterprises. The ability of these systems to streamline complex multi site operations and enhance service delivery has further strengthened their appeal.
As global trade and e commerce continue to grow, transportation and logistics companies are increasingly adopting dealer management systems to ensure efficiency, compliance, and competitiveness, securing the segment’s prominence in the market.
Previously, the market was thriving at a lower CAGR of 3.5% (2020 to 2025), resulting in a market size of USD 8,200.5 million in 2025.
Pandemic years wreaked havoc on companies and resulted in the closure of vehicle dealerships. Auto dealers can use dealer management systems to keep up with current market trends and changes.
As a result, a slowdown in dealer business in 2024 slowed the growth of the dealer management systems market slightly. Despite these conditions, according to Forbes, dealerships in selected states of the United States continued to operate with formal licenses from the government to run the business during the pandemic. As it is one of the important industries, particularly in the transportation industry.
The United States government, according to the National Automobile Dealers Association (NADA), allowed vehicle dealerships to operate during these years. Demand for the dealer management system has increased in the region because vehicle retailers have reopened.
The automotive sector has seen key technological improvements during the last few decades. Over time, the impact of new technologies has transformed the sector. Automobiles can now employ innovative solutions thanks to improvements in digital technologies.
The dealer management system is an ideal solution for car dealerships that need to handle spare parts inventory and work orders. To track manufacturer and customer relationships, the system integrates customer relationship management (CRM) and business intelligence technologies. Several car dealerships rely heavily on the dealer management system to keep track of their inventory and sales.
New and used vehicle sales, consumer finance, vehicle repair, and maintenance services, and parts inventory management are all driven by the dealer management system. Financial reporting, payroll services, and cash flow management are also available.
Automotive stores may order vehicles and components, handle warranties, and get vehicle records using the system, which integrates with OEM data processing systems. As a result, the automotive industry's rapid adoption of a novel dealer management system is propelling market expansion. Furthermore, they cater to the specific requirements of the retail automobile industry.
Overall market expansion is hampered by security concerns caused by a lack of cyber security solutions. The global market is growing due to real-time insight, simpler business operations, and engaging customer communication.
With a predicted CAGR of 6%, demand for dealer management systems from the transportation and logistics industries is expected to rise throughout the forecast period. The transportation and logistics industry contributes a substantial amount of income to the market.
In the transportation and logistics industries, demand for cloud-based dealer management systems has increased, and this trend is projected to continue during the forecast period.
The marine and motorsports sectors, in addition to transportation and logistics, present considerable growth potential for the market. Another significant end-user of dealer management systems is in the construction industry.
| Category | By Deployment Type |
|---|---|
| Top Segment | On-premises |
| Market Share in Percentage | 61.2% |
| Category | By End User |
|---|---|
| Top Segment | Agriculture Sector |
| Market Share in Percentage | 17.6% |
In the global market, the on-premise deployment category had the majority revenue share, with a predicted CAGR of 5.1%. On-premise technology and software are installed on hardware within the company's premises so that employees have physical access to the data.
The cloud-based deployment segment is expected to increase rapidly over the projected period, owing to rising demand and usage of cloud-based deployment. Public and private clouds can be used in a cloud-based deployment architecture.
| Regional Market Comparison | Global Market Share in Percentage |
|---|---|
| North America | 28.8% |
| Europe | 22.3% |
During the forecast period, innovation in the dealer management system industry and an increase in vendors of dealer management systems are expected to boost the market in North America, which is expected to reach USD 15.8 billion by 2035, with a CAGR of 6%.
| Regional Market Comparison | Global Market Share in Percentage |
|---|---|
| United States | 16.5% |
| Germany | 7.1% |
| Japan | 4.2% |
| Australia | 2.3% |
Due to the increasing adoption of dealer management systems in the industry, Asia Pacific is likely to be an interesting region for the market. In the near future, the market in South America, the Middle East, and Africa is likely to grow rapidly.
Due to the region's developing logistics business, Asia Pacific countries, particularly China, Japan, and India, are driving the region's expansion. Furthermore, the highly linked and advanced economies of Southeast Asian countries, as well as growing awareness of the dealer management system, are fueling the market's growth. Moreover, new government programs and regulations are projected to aid industry expansion.
| Regions | CAGR (2025 to 2035) |
|---|---|
| United States of America | 6% |
| United Kingdom | 5.3% |
| China | 3.9% |
| Japan | 6.2% |
| India | 7.5% |
The development of innovative and efficient goods is the primary focus of players in the market. Research shows how the competitors are taking advantage of the opportunities present in the market.
Leading players in the global market are putting more emphasis on improving the quality of services they provide. They are increasing capital inflow to research and development operations in order to achieve this goal.
Some companies in the global market are increasing their participation in new product launch activities. Aside from that, several stakeholders are putting more emphasis on making their products as cost-effective as possible.
As a result of these developments, the worldwide market is expected to grow at a faster rate in the approaching years. Manufacturers use dealer management systems, as well as a remote help desk, to optimize inventory management, dealer operations, and customer retention.
Some Recent Developments by the Dealer Management System Providers are:

The global dealer management system market is estimated to be valued at USD 9.5 billion in 2025.
The market size for the dealer management system market is projected to reach USD 15.8 billion by 2035.
The dealer management system market is expected to grow at a 5.3% CAGR between 2025 and 2035.
The key product types in dealer management system market are on-premises and cloud.
In terms of end user, transportation and logistics segment to command 29.3% share in the dealer management system market in 2025.


Full Research Suite comprises of:
Market outlook & trends analysis
Interviews & case studies
Strategic recommendations
Vendor profiles & capabilities analysis
5-year forecasts
8 regions and 60+ country-level data splits
Market segment data splits
12 months of continuous data updates
DELIVERED AS:
PDF EXCEL ONLINE
Automotive Dealer Management System Market Size and Share Forecast Outlook 2025 to 2035
Tax Management Market Size and Share Forecast Outlook 2025 to 2035
Key Management as a Service Market
Cash Management Supplies Packaging Market Size and Share Forecast Outlook 2025 to 2035
Fuel Management Software Market Size and Share Forecast Outlook 2025 to 2035
Risk Management Market Size and Share Forecast Outlook 2025 to 2035
SBOM Management and Software Supply Chain Compliance Market Analysis - Size, Share, and Forecast Outlook 2025 to 2035
Case Management Software (CMS) Market Size and Share Forecast Outlook 2025 to 2035
Farm Management Software Market Size and Share Forecast Outlook 2025 to 2035
Lead Management Market Size and Share Forecast Outlook 2025 to 2035
Pain Management Devices Market Growth - Trends & Forecast 2025 to 2035
Data Management Platforms Market Analysis and Forecast 2025 to 2035, By Type, End User, and Region
Cash Management Services Market – Trends & Forecast 2025 to 2035
CAPA Management (Corrective Action / Preventive Action) Market
Exam Management Software Market
Waste Management Carbon Credit Market Size and Share Forecast Outlook 2025 to 2035
Waste Management Market Size and Share Forecast Outlook 2025 to 2035
Quote Management Software Market Size and Share Forecast Outlook 2025 to 2035
Trade Management Software Market Size and Share Forecast Outlook (2025 to 2035)
Fleet Management Market Analysis - Size, Share & Forecast 2025 to 2035

Thank you!
You will receive an email from our Business Development Manager. Please be sure to check your SPAM/JUNK folder too.
Chat With
MaRIA