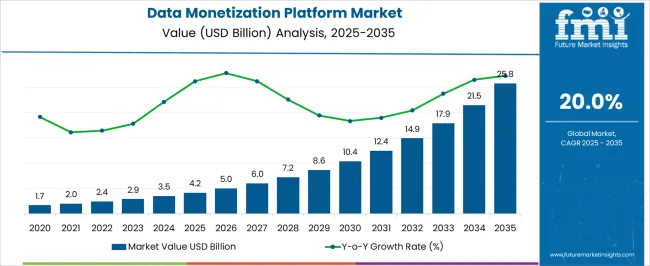
The Data Monetization Platform Market is estimated to be valued at USD 4.2 billion in 2025 and is projected to reach USD 25.8 billion by 2035, registering a compound annual growth rate (CAGR) of 20.0% over the forecast period.
| Metric | Value |
|---|---|
| Data Monetization Platform Market Estimated Value in (2025 E) | USD 4.2 billion |
| Data Monetization Platform Market Forecast Value in (2035 F) | USD 25.8 billion |
| Forecast CAGR (2025 to 2035) | 20.0% |
The data monetization platform market is evolving rapidly as organizations across sectors increasingly recognize the financial and strategic value of their data assets. Businesses are moving beyond internal analytics and are now leveraging data as a commercial asset to generate new revenue streams.
This shift is being accelerated by advancements in data integration, cloud infrastructure, and privacy preserving technologies that enable secure and scalable data exchange. Enterprises are prioritizing platforms that offer comprehensive capabilities including data governance, compliance support, and flexible monetization models such as data marketplaces and APIs.
The demand is further reinforced by growing investments in digital transformation and the need for real time insights to support decision making. As more organizations formalize data strategies and seek ways to monetize non sensitive data while maintaining compliance with global data protection regulations, the market is expected to witness continued growth with strong participation from both large and small enterprises.
The market is segmented by Component, Deployment Mode, Enterprise Size, and Industry and region. By Component, the market is divided into Platform and Services. In terms of Deployment Mode, the market is classified into On-premise and Cloud. Based on Enterprise Size, the market is segmented into Small Offices, Small Enterprises, Medium-sized Enterprises, Large Enterprises, and Very Large Enterprises. By Industry, the market is divided into Services, Distribution Services, Public Sector, Finance, Manufacturing and Resources, and Others. Regionally, the market is classified into North America, Latin America, Western Europe, Eastern Europe, Balkan & Baltic Countries, Russia & Belarus, Central Asia, East Asia, South Asia & Pacific, and the Middle East & Africa.
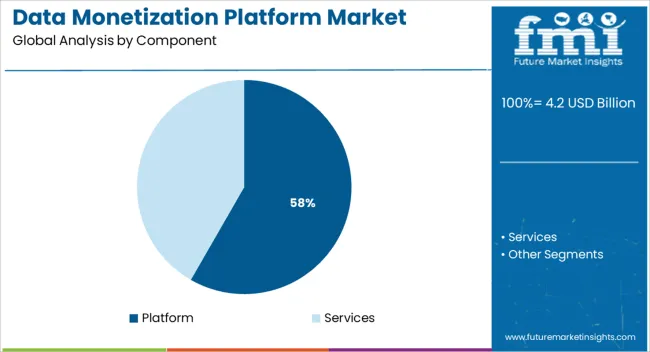
The platform segment is projected to contribute 58.30% of the total market revenue by 2025 within the component category, making it the leading segment. This dominance is driven by the comprehensive functionality that platforms offer including data ingestion, processing, monetization workflow orchestration, and compliance management.
Platforms are enabling businesses to consolidate data assets, identify monetization opportunities, and execute transactions securely within a unified interface. The ability to integrate with existing data ecosystems and support diverse monetization models has made these platforms central to enterprise data strategies.
Furthermore, the rising demand for scalable, AI powered platforms capable of enabling insights as a service has accelerated investment in this segment, establishing its strong foothold in the market.
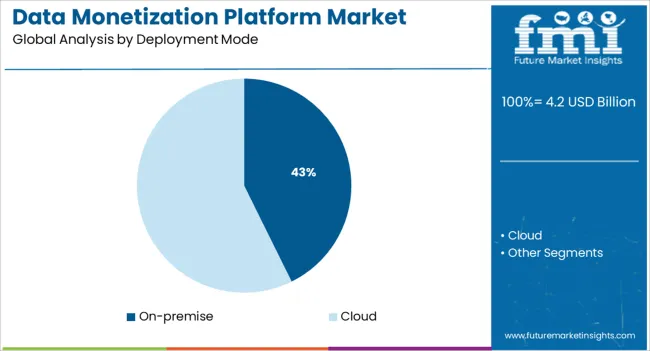
The on premise segment is anticipated to account for 42.70% of market revenue by 2025 within the deployment mode category. This preference is supported by data sensitive industries such as banking, healthcare, and defense that require higher control over infrastructure, privacy, and regulatory compliance.
Organizations operating in jurisdictions with strict data sovereignty laws have continued to favor on premise solutions to manage sensitive customer and operational data securely. The ability to customize deployment, maintain in house data governance policies, and ensure lower latency has reinforced the demand for on premise platforms.
Despite the growing adoption of cloud native solutions, on premise remains a critical deployment choice for enterprises that prioritize control and compliance.
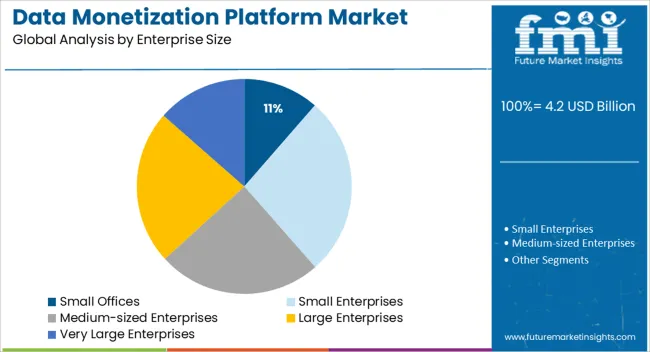
The small offices segment is expected to hold 11.40% of the total revenue by 2025 within the enterprise size category. This share is attributed to the increasing accessibility of lightweight data monetization tools and modular platforms that cater to the specific needs of small scale operations.
Small offices are adopting these solutions to gain competitive edge by unlocking additional revenue sources from internal data while maintaining lean operations. The rise of self service analytics tools, embedded data visualization, and plug and play integration options has allowed small offices to participate in the broader data economy.
Additionally, the availability of subscription based and open source monetization solutions has removed traditional cost barriers, encouraging wider adoption within this segment.
Increased implementation amongst telecommunications service providers, as well as heightened recognition of the potential advantages of data monetization, will open up new opportunities over the forecast period. It is costly to keep and archive a large volume of data on physical storage devices or hardware. In this case, cloud-based solutions provide enormous computational and storage capabilities.
This has generated an opportunity for the monetization of cloud-based data. Furthermore, cloud technology encourages businesses to exchange real-time data.
Organizations are focused on delivering particular services to enhance the customer experience, and achieving operational effectiveness at a cheaper cost and in less duration is expected to drive the requirement for analytics solutions in the data monetization platform industry.
Furthermore, the data monetization platform trend is being pushed by changing customers' requirements, increasing margin pressure and competition, and the transition to real-time payment infrastructures, which is expected to open up new market possibilities.
Furthermore, the number of data and real-world evidence in the healthcare industry has grown dramatically. Using this data will allow us to envision and build new techniques and tactics for clinical development, accelerate innovation, and enhance clinical results. Using a strong big data analytics and monetization platform will allow healthcare organizations to capitalize on data.
| Attributes | Details |
|---|---|
| Data Monetization Platform Market Value (2025) | USD 4.2 billion |
| Data Monetization Platform Market Expected Value (2035) | USD 25.8 billion |
| Data Monetization Platform Market Projected CAGR (2025 to 2035) | 21.8% |
| Data Monetization Platform Market Historical CAGR (2020 to 2024) | 20% |
As sectors like telecom, healthcare, and finance undergo a seismic shift, the data monetization platform industry is seeing a gold rush. The global market for data monetization platforms increased from USD 1.7 Million to USD 2005 Million between 2020 and 2024 with a CAGR of 20%.
The rising volume of business data, technical improvements in big data and analytics solutions, and the necessity of creating new sources of revenue from data volumes have raised the demand for data monetization platforms. As firms are paying attention to uncovering the value in their otherwise unused data, a strategy for data monetization platforms becomes extremely relevant.
Short Term (2025 to 2025): The increasing use of these solutions by different companies in the financial services, healthcare industries, mobile carriers, and telecommunication sectors is also expected to contribute to the growth of the worldwide data monetization market.
Medium Term (2025 to 2035): One of the most significant aspects that are likely to boost demand for the data monetization platform during this timeframe is the rapid developments in big data as well as big data analytics.
Long Term (2035 to 2035): As cloud computing technology stimulates businesses to share real-time data, it is predicted to open the door for subscription-based data exchange platforms, leading to market expansion over this period.
During the forecast period, the global data monetization platform market is anticipated to grow from USD 4.2 Million in 2025 to USD 25.8 Million by 2035 with a CAGR of 21.8%.
Based on enterprise size, the data monetization market is categorized into small offices, small enterprises, medium-sized enterprises, large enterprises, and very large enterprises.
The very large enterprises segment dominated the market in 2024 accounting for 26% of the global market. This segment is estimated to grow at a CAGR of 8.9% over the forecast period. This is caused by the increasing existence of very large businesses with global domination. These very large enterprises have clients all across the world and along the value chain.
They have sufficient technological knowledge, business plans, and cash. In the industry, there is an increasing necessity for new technologies such as cloud computing and artificial intelligence (AI). To ensure company continuity, very large enterprises can easily invest in such modern technology and adopt data monetization platforms since they have a large capital.
However, the small office segment is anticipated to grow the fastest recording a CAGR of 22.7% over the forecast period. This segment possessed a 14% share of the global market in 2024. Increasing adoption of data monetization platforms by small offices to keep up with the competition is likely to drive segment growth over the forecast period.
Moreover, small offices are projected to encounter resource constraints, leading to economic complications and an increasing need to optimize costs. Hence, the increasing influence of cloud-based data monetization platforms is likely to make a significant contribution in assuring lower operating costs and greater productivity, consequently favorably boosting segment growth.
Depending on the industry, the data monetization market is classified into services, distribution services, public sector, finance, manufacturing and resources, and others.
The finance segment dominated the market in 2024 and detained 28.3% of the global market share. This segment is projected to expand at a CAGR of 14.1% over the forecast period. This is due to the increasing presence of data-rich enterprises in the banking industry. This has resulted in a huge need for data monetization in the banking sector. Additionally, data monetization systems in financial institutions increase client engagements and operating income by more than 50%.
Such factors are expected to drive market expansion throughout the forecast period. Additionally, the trend of monetizing payments data is being driven by shifting customer requirements, the transition to real-time payment infrastructure, and rising measurable terms and profitability.
However, the public sector segment is estimated to grow fastest over the forecast period exhibiting a CAGR of 18.1%. This segment held a 14.2% share of the global market in 2024. The development of digitization has cleared the path for data monetization platforms in this industry. The public sector has a global reach and several sources of revenue.
As a result, they produce enormous amounts of data. Furthermore, the volume of data and real-world evidence has increased dramatically across the public sector. Using this data will assist in envisioning and building new ideas and tactics for development, accelerate innovation, and enhance outcomes.
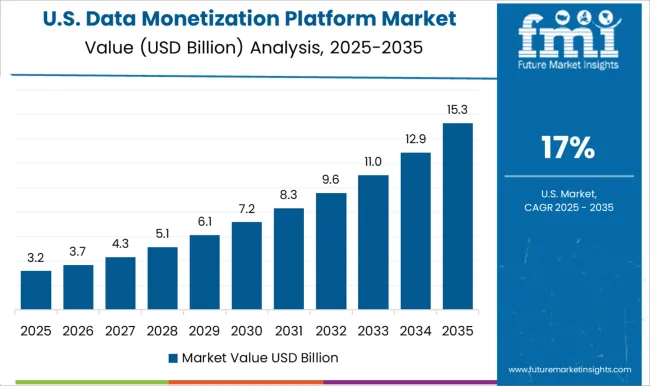
North America dominated the market in 2024 holding a 32.9% share of the global market due to the increased penetration and use of data monetization services, software, and platforms, as well as the existence of a significant number of data providers in the region. The North American data monetization platform market is projected to grow at a CAGR of 15.1%
The United States is the largest income source in North America, with the greatest number of data monetization companies situated there. The United States data monetization platform market accounted for a 23.4% share in 2024 and is estimated to grow at a CAGR of 13.8% over the forecast period.
The rapid growth of the United States data monetization platform market can be ascribed to increased penetration and acceptance of data monetization platforms in the country. Businesses across the United States are spending in and rapidly implementing sophisticated technologies such as cloud computing, big data, and analytics.
This provided the United States with the advantage of being the first to market. Furthermore, the increased desire among firms to automate decision-making processes, reduced infrastructural costs, and technological advancements have all had a substantial impact on the country's prosperity.
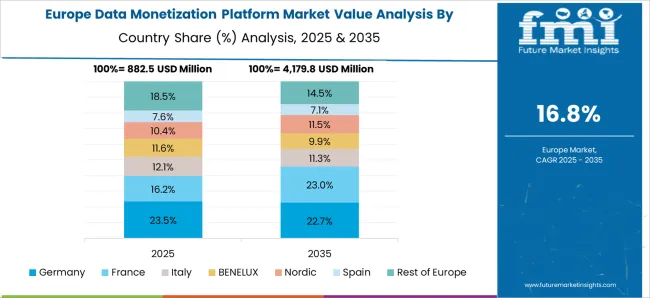
Europe had the second-highest market share, accounting for 20.7% of the global market in 2024. During the projected period, the data monetization platforms market is expected to develop at a CAGR of 16.4%. The European data monetization platforms are largely driven by factors including growing cloud computing penetration, massive expenditures in data centers by significant regional firms, and increased use of AI for data processing.
Germany is the fastest-growing country in Europe when it comes to the adoption of data monetization platforms and recorded holding a 12.5% market share in 2024. During the forecast period, the market is expected to grow at a CAGR of 17.8%.
The German data monetization platform market is largely driven by the necessity to transform into analytics-driven companies, which enhances the demand for data monetization platforms and services to boost organizational decision-making skills. As a result, increased acceptance of data-driven decision-making would enhance demand and necessity for data monetization, assisting the expansion of the market in Germany.
Asia Pacific is predicted to grow significantly because of the growing adoption of digital solutions such as IoT, mobility, AI, cloud, and over-the-top services, as well as increased investments in technological improvements in the region. South Asia and East Asia held 14.3% and 18.6% of the global market respectively in 2024.
South Asia and East Asia are likely to expand the quickest throughout the forecast period, with CAGRs of 22.5% and 20.4%, respectively. The two most significant countries in this region that contribute to this enormous income generation are China and Japan.
China:
| Country | China |
|---|---|
| Market Share (2024) | 7.5% |
| CAGR (2025 to 2035) | 19.2% |
| Growth Factors | The Chinese data monetization platform market is growing the fastest in the Asia Pacific region. China generates the most income in the regional market. This is due to the existence of a high number of MSMEs and big enterprises, as well as the ongoing digitalization of business operations and the increase in the volume of data created each day. The expanding corporate competitiveness is also putting pressure on businesses to capitalize on the value of data, which is increasing the usage of data monetization solutions. |
Japan:
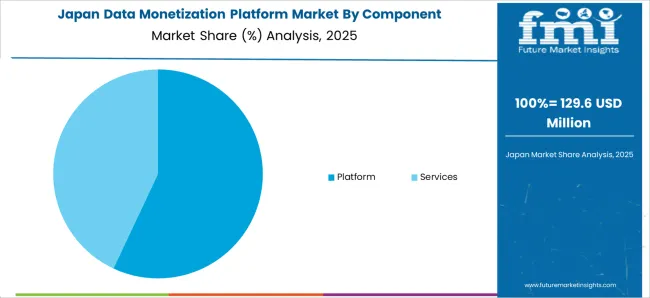
| Country | Japan |
|---|---|
| Market Share (2024) | 6.5% |
| CAGR (2025 to 2035) | 21.9% |
| Growth Factors | Japanese data monetization platform market holds a significant share of the global market. The commercialization of AI, big data, and IoT technologies, as well as the necessity for additional improvements to effectively use the latest technology, are projected to increase the country's adoption of data monetization platforms and services. Furthermore, advances in networking technology, the quick rise of e-commerce, increased manufacturing and the automotive industry, and increased administrative regulations have all aided market expansion. |
A data monetization platform is utilized in a variety of sectors to offer suppliers prospects for development. There is some rivalry in the sector. New entrants are focusing on developing unique techniques to improve the client experience. Diverse technologies are becoming more available as a result of strategic movements by market participants and new advances in data monetization platforms.
Top Start-ups to Keep an Eye on:
| Start-up Company& | Nami ML |
|---|---|
| Country& | United States |
| Description | Nami ML offers a subscription-based service for monetizing applications. The startup's software development kit (SDK) links into applications, permitting marketers to easily create and implement paywalls. The Naomi Control Center enables application developers to alter all elements of subscriptions and other in-app purchases. It also records income and consumer data in real-time to promote user conversion to paying subscribers. |
| Start-up Company | Keylight |
|---|---|
| Country | Germany |
| Description | Keylight creates subscription commerce solutions for both B2B and B2C organizations. The startup's automated subscription platform designs and deploys flexible subscription solutions. It then allows organizations in many sectors to easily handle and sell memberships. It can be tailored to a brand's visual identity and interacts with subscription, sales, and resale channels. |
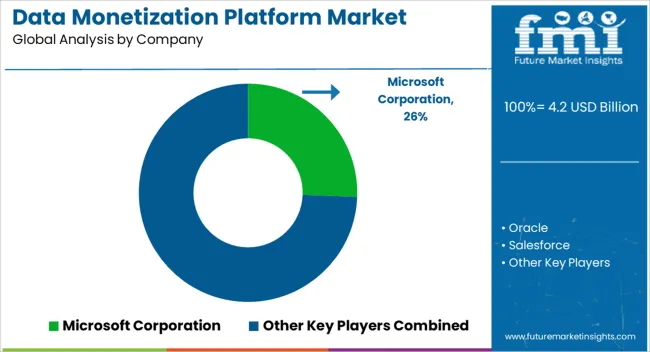
Competition heats up in the Data Monetization Market: Accenture Plc., IBM Corporation, and Infosys Limited, Inc. are Monopolizing the Market
Accenture is a multinational professional services firm that specializes in digital, cloud, and security. It provides strategy and consulting, technology, and operations services, all driven by the world's biggest network of advanced technology and intelligent operations centers, combining unrivaled knowledge and specialized capabilities across more than 40 sectors. Every day, its professionals deliver on the promise of technology and human inventiveness, serving clients. It believes in the potential of transformation to add value and achieve shared success for its clients, employees, shareholders, partners, and communities.
IBM combines technology and knowledge, offering customers infrastructure, software, and consulting services as they seek the digital transformation of the world's mission-critical industries. It brings together all of the essential technologies and services, regardless of source, to assist clients in solving the most critical business challenges.
Infosys Limited is a global Indian information technology corporation that specializes in business consulting, information technology, and outsourcing. Banking software products and services under the brand name Infosys Finacle are redefining the way banks function by offering comprehensive and integrated assistance. Infosys offers IT services to ensure data privacy and security. It also focuses on cloud computing.
Recent Developments
The global data monetization platform market is estimated to be valued at USD 4.2 billion in 2025.
The market size for the data monetization platform market is projected to reach USD 25.8 billion by 2035.
The data monetization platform market is expected to grow at a 20.0% CAGR between 2025 and 2035.
The key product types in data monetization platform market are platform and services.
In terms of deployment mode, on-premise segment to command 42.7% share in the data monetization platform market in 2025.


Full Research Suite comprises of:
Market outlook & trends analysis
Interviews & case studies
Strategic recommendations
Vendor profiles & capabilities analysis
5-year forecasts
8 regions and 60+ country-level data splits
Market segment data splits
12 months of continuous data updates
DELIVERED AS:
PDF EXCEL ONLINE
Data Center Market Forecast and Outlook 2025 to 2035
Datacenter Infrastructure Services Market Size and Share Forecast Outlook 2025 to 2035
Data Acquisition Hardware Market Size and Share Forecast Outlook 2025 to 2035
Data Center Automatic Transfer Switches and Switchgears Market Size and Share Forecast Outlook 2025 to 2035
Data Discovery Market Size and Share Forecast Outlook 2025 to 2035
Data Masking Technology Market Size and Share Forecast Outlook 2025 to 2035
Data Centre Rack Server Market Size and Share Forecast Outlook 2025 to 2035
Data Center Power Management Industry Analysis in Western Europe Size and Share Forecast Outlook 2025 to 2035
Data Center Power Management Industry Analysis in Korea Size and Share Forecast Outlook 2025 to 2035
Data Center Liquid Cooling Market Size and Share Forecast Outlook 2025 to 2035
Data Business in Oil & Gas Market Size and Share Forecast Outlook 2025 to 2035
Data Centre Colocation Market Size and Share Forecast Outlook 2025 to 2035
Data Lake Market Size and Share Forecast Outlook 2025 to 2035
Data Center RFID Market Size and Share Forecast Outlook 2025 to 2035
Data Center Accelerator Market Size and Share Forecast Outlook 2025 to 2035
Data Lakehouse Market Size and Share Forecast Outlook 2025 to 2035
Data Center Outsourcing Market Size and Share Forecast Outlook 2025 to 2035
Data Center Refrigerant Market Size and Share Forecast Outlook 2025 to 2035
Data Center Fire Detection And Suppression Market Size and Share Forecast Outlook 2025 to 2035
Data Center Security Market Size and Share Forecast Outlook 2025 to 2035

Thank you!
You will receive an email from our Business Development Manager. Please be sure to check your SPAM/JUNK folder too.
Chat With
MaRIA