The Data Center Substation Market is estimated to be valued at USD 11.8 billion in 2025 and is projected to reach USD 22.2 billion by 2035, registering a compound annual growth rate (CAGR) of 6.5% over the forecast period.
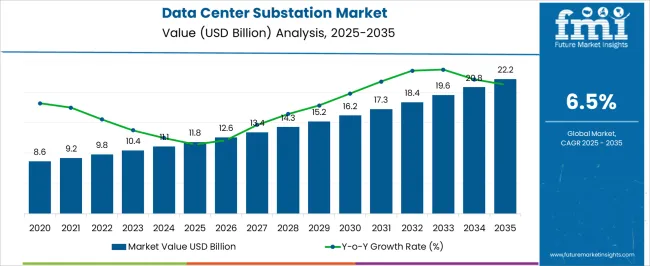
| Metric | Value |
|---|---|
| Data Center Substation Market Estimated Value in (2025 E) | USD 11.8 billion |
| Data Center Substation Market Forecast Value in (2035 F) | USD 22.2 billion |
| Forecast CAGR (2025 to 2035) | 6.5% |
The data center substation market is expanding steadily as digital transformation, cloud adoption, and hyperscale infrastructure investments accelerate worldwide. The increasing reliance on data driven applications and the continuous rise in energy intensive workloads such as artificial intelligence and big data analytics are driving demand for highly reliable and efficient power distribution systems.
Governments and enterprises are prioritizing investments in advanced grid infrastructure to ensure uninterrupted power supply and operational resilience for mission critical facilities. Additionally, innovations in smart grid technologies, digital monitoring systems, and sustainable power solutions are shaping the adoption of modern substations in data center environments.
With growing pressure to minimize downtime and achieve carbon reduction goals, the market outlook remains positive, supported by large scale investments and strategic partnerships in power infrastructure tailored for data centers.
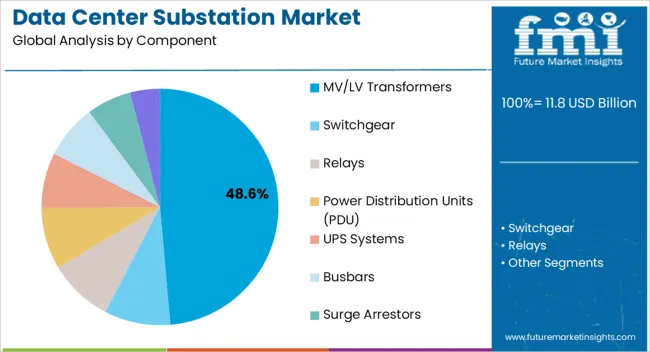
The MV LV transformers segment is projected to account for 48.60% of total revenue by 2025 within the component category, making it the most prominent segment. This dominance is being driven by the critical role of transformers in enabling stable voltage regulation and efficient energy transfer within data center power networks.
Their ability to handle high load fluctuations, ensure minimal power loss, and support redundancy systems has positioned them as a cornerstone of reliable substation infrastructure. The surge in hyperscale and colocation data centers has further amplified the requirement for medium and low voltage transformers to manage expanding workloads efficiently.
As demand for scalable and resilient energy distribution grows, MV LV transformers are expected to maintain their leadership in the component segment.
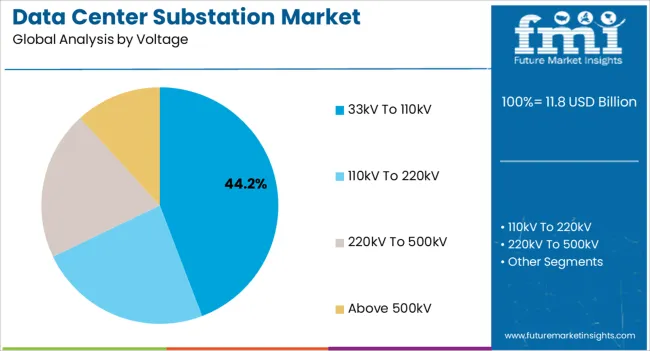
The 33kV to 110kV segment is expected to hold 44.20% of total market revenue by 2025 within the voltage category, establishing it as the dominant segment. This growth is attributed to its suitability in meeting the high power demands of large scale data centers, where operational reliability and grid integration are paramount.
Substations within this voltage range ensure efficient transmission, reduced line losses, and robust performance under heavy load conditions. Their adoption has been reinforced by the expansion of hyperscale facilities and increased regulatory focus on grid stability and energy efficiency.
The flexibility of this voltage range to support both current requirements and future scalability needs has secured its position as the preferred choice, underpinning its dominance in the voltage segment.
The data center substation demand is estimated to rise at 6.5% CAGR between 2025 and 2035 in comparison to the 4.4% CAGR registered from 2020 to 2025. Increasing establishments of enterprises have considerably increased data generation, which is expected to boost the demand for data center substations across the globe in the forthcoming years.
The increasing use of social media and a surge in online video content streaming have resulted in increased data volumes that are managed by data centers. This is fueling the growth in the market.
Driven by crucial factors, the global data center substation industry size is anticipated to expand from USD 10,427.4 million in 2025 to USD 19,634.5 million by 2035.
The increasing replacement of traditional electrical substation infrastructure with high-quality, upgraded, smart, and digital systems is expected to boost the growth of the data center substation industry.
In March 2024, Hitachi ABB Power Grids launched its smart digital substation offering. This offering brings together the latest advancements in digital substation technology with the prescriptive, predictive, and prognostic capabilities of Hitachi’s Lumada Asset Performance Management solution.
Smart digital substation increases reliability, integrates new forms of clean energy, and delivers energy services in smart and safe ways which are required for navigating the shift toward distributed and less predictable renewable power generation.
Countries in South Asia Pacific and the Middle East and Africa, such as India, Thailand, Mexico, and Brazil, are expected to witness growth opportunities due to the factors such as:
In January 2025, CtrlS announced the deployment of Asia’s notable gas-insulated substation (GIS) in Mumbai, which is unique in the Indian data center industry. The gas-insulated substation is currently equipped with 300MW and can scale up to 700MW. It is backed by three different sources and diversified paths ensuring 100% availability of power. This happens to be the first of its kind deployment of power infrastructure by any data center company in the Asia Pacific region. Such developments are expected to create key opportunities for players operating in the global data center substation market over the assessment period.
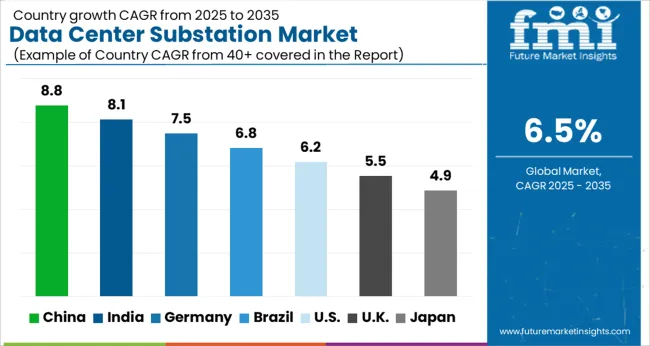
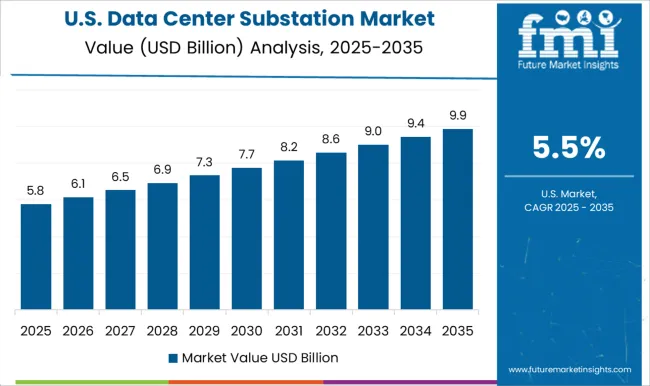
The data center substation market in the United States is booming, accounting for a 24.6% share in 2025. The country's well-developed IT infrastructure, coupled with the high adoption rate of advanced technologies, is driving the demand for data centers. Several data-driven industries, such as finance, healthcare, and retail, are also boosting the demand for data centers, increasing the deployment of data centers across the country.
The increasing demand for cloud-based solutions and edge computing, coupled with the adoption of renewable energy solutions, is driving growth in the market in the United States. The United States government's push toward energy efficiency and sustainable solutions is also creating opportunities. These opportunities are for investment in renewable energy sources and energy-efficient solutions for data centers.
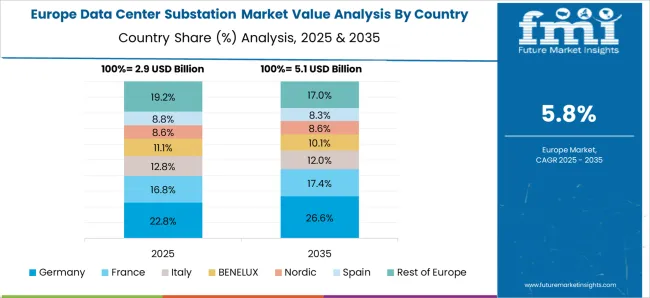
Germany is the fourth notable market for data centers globally, accounting for 4.5% of the market share in 2025. The country has a well-developed IT infrastructure, and a high level of digitalization in industries such as automotive, manufacturing, and healthcare, which is driving the demand for data centers. With the increased adoption of renewable energy solutions, particularly in wind and solar power, Germany is witnessing growth in the data center substation market.
Japan is estimated to account for nearly 3.4% share of the global data center substation industry in 2035. The country is predicted to remain one of the most attractive markets during the forecast period. A few of the key factors increasing the demand for data centers substation in the country are:
Numerous players are investing in data center infrastructure in Japan either by building their own data centers or acquiring large wholesale space within global data center service providers. These include financial services firms, IT companies, and global multimedia and content providers, which are expected to continue fueling sales over the forecast period.
The data center substation demand in Finland is expected to account for nearly 13.0% of Europe’s market share through 2035. Increasing investments by colocation service providers in Europe’s colocation market are driving sales of data center substations. In addition to this, growth in the number of cloud service providers and information technology providers are boosting sales in the country.
Businesses in Finland enjoy one of the best digital infrastructures in the world, ranked second in the Network Readiness Index by the World Economy Forum. The ultra-fast optic cable between Germany and Finland (C-Lion1) brings the Nordic digital markets to the heart of Central Europe. Thus, the low cost of operation combined with the state-of-the-art connectivity makes Finland a prominent pocket in Europe’s data center substation industry.
The sales in the India data center substation industry are projected to increase at an impressive 10.3% CAGR between 2025 and 2035. Growing internet user base, increasing data generation, and government initiatives such as the Digital India mission are transforming India into a significantly growing data center substation hub.
India is a good fit for global data center operators looking for expansion in Asia due to its large domestic consumer base. As the world’s second-most populous country with an ever-increasing smartphone adoption rate, India is an attractive market for hyper scalers to entities. Further, it provides large-scale internet, networking, and cloud services to organizations.
Surging Demand for Gas-Insulated Switchgear to Fuel Growth
Based on components, sales in the switchgear segment accounted for 22.7% of the total data center substation industry share in 2025.
As data center substations have complex and massive systems architectures, power failure in the substation may affect the productivity of the overall system. The growing need to avoid power disruption in data center operations and to control the electrical supply in the data centers is anticipated to drive the market over the forecast period.
Switching devices such as switchgear is used in the data center substation architectures to control the power supply and protect the devices in case of electricity breakdown. Backed by the aforementioned factors, sales are expected to gain traction in this segment over the assessment period.
In terms of voltage, the above 500kV segment is projected to hold nearly 34.5% share of the market during the forecast period. The segment is likely to witness growth at a CAGR of 7.4% through 2035. Substations with high voltage are designed to handle the high-power demand of mission-critical facilities such as data centers to provide reliable and quality power supply to server buildings. In addition, surging demand for high-voltage substations is likely to fuel sales in the market.
The competition in the data center substation industry is intense, and it's no surprise that the leading players like ABB Ltd. and Siemens AG are continuously working to maintain their market positions. These companies invest notably in research and development to bring innovative solutions to the market that can cater to the evolving needs of data centers.
Apart from the leading players, several small companies and startups are trying to enter the market by offering niche products and services. These new entrants are leveraging technology to disrupt the market and carve out a niche for themselves.
Competition is not the only challenge that companies in the industry face. One of the biggest challenges is the complexity of the data center substation infrastructure, which requires high levels of technical expertise to design and implement. Companies need to have a deep understanding of the unique requirements of data centers to provide customized solutions that meet the specific needs of their clients.
One trend that is gaining traction in the data center substation industry is the push toward green energy. With the growing awareness of climate change and the need to reduce carbon emissions, companies are exploring new technologies and solutions that can help them achieve their sustainability goals. This presents a significant opportunity for companies to differentiate themselves in the market by offering green solutions that align with the changing needs of the industry.
Leading data center substation industry players are increasing their investments in research and development to support future technologies. It demonstrates strong competition amongst key players and calls for constant development and innovation in data center substation designs. For instance:
In March 2024, Eaton introduced EnergyAware UPS for data center operations. EnergyAware is designed for data center applications and can be used in any high-capacity IT load, whether industrial or manufacturing.
| Strategies to Expand | Description |
|---|---|
| Diversify product range | Expand the range of products and services offered to cater to a wide audience and gain a competitive edge. |
| Invest in research and development | Invest in research and development to come up with innovative solutions to meet the changing needs of customers. |
| Target emerging markets | Identify and target emerging markets to tap into new customer bases and increase sales revenue. |
| Strengthen customer service | Focus on providing excellent customer service to build brand loyalty and increase customer retention. |
| Build partnerships | Collaborate with other industry players to expand reach and access new markets. |
| Leverage digital marketing | Utilize digital marketing tools such as social media and search engine optimization to increase brand awareness and lead generation. |
| Offer value-added services | Offer value-added services such as maintenance and support to provide customers with a complete solution and increase customer satisfaction. |
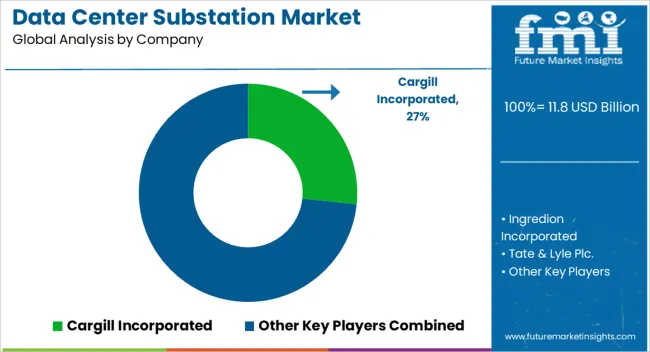
The global market is moderately competitive, with tier-1 manufacturers accounting for 35% to 40% of the total market share. Some leading participants are DSM, DuPont, Roquette Freres, Cargill Incorporated, Ingredion Incorporated, Tate and Lyle Plc., SunOpta, ADM Company, and Ajinomoto Inc.
To grow their worldwide reach, players are investing in mergers, acquisitions, collaborations, and partnerships. In addition, players are taking a variety of measures, such as utilizing new technologies. To generate novel products and improve sales and distribution channels.
For example,
Some key companies are as follows:
| Attribute | Details |
|---|---|
| Forecast Period | 2025 to 2035 |
| Historical Data Available for | 2020 to 2025 |
| Market Analysis | USD million for Value |
| Key Regions Covered | North America; Latin America; Europe; East Asia; South Asia & Pacific; and the Middle East & Africa |
| Key Segments Covered | Component, Voltage, and Region |
| Key Companies Profiled |
General Electric; Schneider Electric; Siemens Energy; ABB Group; Eaton; Hitachi ABB Powergrids Inc.; NR Electric Co., Ltd; NEI Electric Power Engineering, Inc.; Tesco Automation Inc.; S&C Electric Company; Kirby Group; Mortenson Company; Sify Technologies Limited; Black & Veatch Holding Company; Hyosung Heavy Industries |
| Report Coverage | Market Forecast, Company Share Analysis, Competition Intelligence, DROT Analysis, Market Dynamics and Challenges, and Strategic Growth Initiatives |
| Customization & Pricing | Available upon Request |
The global data center substation market is estimated to be valued at USD 11.8 billion in 2025.
The market size for the data center substation market is projected to reach USD 22.2 billion by 2035.
The data center substation market is expected to grow at a 6.5% CAGR between 2025 and 2035.
The key product types in data center substation market are mv/lv transformers, switchgear, relays, power distribution units (pdu), ups systems, busbars, surge arrestors and others.
In terms of voltage, 33kv to 110kv segment to command 44.2% share in the data center substation market in 2025.


Our Research Products

The "Full Research Suite" delivers actionable market intel, deep dives on markets or technologies, so clients act faster, cut risk, and unlock growth.

The Leaderboard benchmarks and ranks top vendors, classifying them as Established Leaders, Leading Challengers, or Disruptors & Challengers.

Locates where complements amplify value and substitutes erode it, forecasting net impact by horizon

We deliver granular, decision-grade intel: market sizing, 5-year forecasts, pricing, adoption, usage, revenue, and operational KPIs—plus competitor tracking, regulation, and value chains—across 60 countries broadly.

Spot the shifts before they hit your P&L. We track inflection points, adoption curves, pricing moves, and ecosystem plays to show where demand is heading, why it is changing, and what to do next across high-growth markets and disruptive tech

Real-time reads of user behavior. We track shifting priorities, perceptions of today’s and next-gen services, and provider experience, then pace how fast tech moves from trial to adoption, blending buyer, consumer, and channel inputs with social signals (#WhySwitch, #UX).

Partner with our analyst team to build a custom report designed around your business priorities. From analysing market trends to assessing competitors or crafting bespoke datasets, we tailor insights to your needs.
Supplier Intelligence
Discovery & Profiling
Capacity & Footprint
Performance & Risk
Compliance & Governance
Commercial Readiness
Who Supplies Whom
Scorecards & Shortlists
Playbooks & Docs
Category Intelligence
Definition & Scope
Demand & Use Cases
Cost Drivers
Market Structure
Supply Chain Map
Trade & Policy
Operating Norms
Deliverables
Buyer Intelligence
Account Basics
Spend & Scope
Procurement Model
Vendor Requirements
Terms & Policies
Entry Strategy
Pain Points & Triggers
Outputs
Pricing Analysis
Benchmarks
Trends
Should-Cost
Indexation
Landed Cost
Commercial Terms
Deliverables
Brand Analysis
Positioning & Value Prop
Share & Presence
Customer Evidence
Go-to-Market
Digital & Reputation
Compliance & Trust
KPIs & Gaps
Outputs
Full Research Suite comprises of:
Market outlook & trends analysis
Interviews & case studies
Strategic recommendations
Vendor profiles & capabilities analysis
5-year forecasts
8 regions and 60+ country-level data splits
Market segment data splits
12 months of continuous data updates
DELIVERED AS:
PDF EXCEL ONLINE
Datacenter Infrastructure Services Market Size and Share Forecast Outlook 2025 to 2035
Datacenter Grid Interface Equipment Market Analysis - Size, Share, and Forecast Outlook 2025 to 2035
Data Center Market Forecast and Outlook 2025 to 2035
Data Center Automatic Transfer Switches and Switchgears Market Size and Share Forecast Outlook 2025 to 2035
Data Center Power Management Industry Analysis in Western Europe Size and Share Forecast Outlook 2025 to 2035
Data Center Power Management Industry Analysis in Korea Size and Share Forecast Outlook 2025 to 2035
Data Center Liquid Cooling Market Size and Share Forecast Outlook 2025 to 2035
Data Center RFID Market Size and Share Forecast Outlook 2025 to 2035
Data Center Accelerator Market Size and Share Forecast Outlook 2025 to 2035
Data Center Outsourcing Market Size and Share Forecast Outlook 2025 to 2035
Data Center Refrigerant Market Size and Share Forecast Outlook 2025 to 2035
Data Center Fire Detection And Suppression Market Size and Share Forecast Outlook 2025 to 2035
Data Center Security Market Size and Share Forecast Outlook 2025 to 2035
Data Center Construction Market Size and Share Forecast Outlook 2025 to 2035
Data Center Immersion Cooling Market Size and Share Forecast Outlook 2025 to 2035
Data Center GPU Market Size and Share Forecast Outlook 2025 to 2035
Data Center Power Market Size and Share Forecast Outlook 2025 to 2035
Data Center Chillers Market Size and Share Forecast Outlook 2025 to 2035
Data Center Industry Analysis in Egypt Size and Share Forecast Outlook 2025 to 2035
Data Center Virtualization Market Size and Share Forecast Outlook 2025 to 2035

Thank you!
You will receive an email from our Business Development Manager. Please be sure to check your SPAM/JUNK folder too.
Chat With
MaRIA