Dark Store Market Analysis Size and Share Forecast Outlook 2023 to 2033

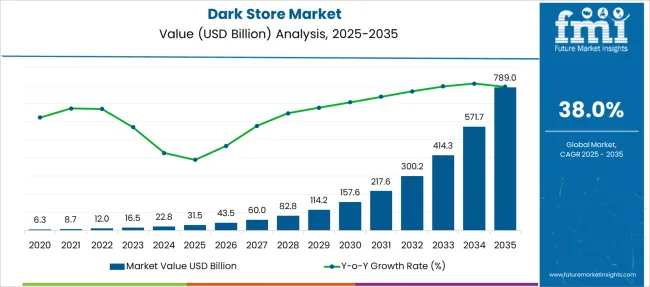
The dark store market is likely to thrive at a robust CAGR of 38% from 2023 to 2033. The market is anticipated to cross a market share of USD 414.31 Billion by 2033 while it holds a value of USD 16.54 Billion in 2023.

Attribute Details
Market Size Value in 2023 USD 16.54 Billion
Market Forecast Value in 2033 USD 414.31 Billion
Global Growth Rate 2023 to 2033 38% CAGR
Forecast Period 2023 to 2033

The research report on the dark store market explains that the changing lifestyle, along with the expanding online shopping activities, has started fueling the demand for dark stores. The concept of dark store works on the Direct-To-Customer (D2C), which is another business strategy of B2C retail sales.

The rising popularity of instant delivery options is a sophisticated way of storing groceries while integrating them with online delivery systems. The retailers apply this D2C strategy to increase their supply chain and extend their distribution channel. The advent of 5G network bandwidth, along with Artificial Intelligence understanding human preferences, is fueling the demand for dark stores around the globe.

Advanced technology to understand the customer’s intent and target the potential customer segment with the right set of marketing has helped the market. A dark store can be defined as a brick-and-mortar location that is shut down and has been transformed into a center for fulfillment operations. Though these spaces are not open to visitors, providing more space for storage and an easy way to deliver orders. This fuels the demand for dark stores across the globe.

Apart from the concept not being new, the pandemic has fueled the demand for a storage space that can fulfill the storage, logistics, and management needs of an online grocery store. Furthermore, the advancements include the dark store with multiple delivery options such as curbside pickup, in-store pickup, and home delivery. With advanced platform designs and enhanced networks, the market is more connected than ever. Thus, the opportunity for businesses that add ease to people’s life helps the business grow at a faster pace. The dark store provides a space for the product owner to cater to the audience and broader reach, expanding the dark store market size.

2018 to 2022 Dark Store Market Outlook Compared to Forecast from 2023 to 2033

The global dark store market was thriving at a CAGR of 24.5% between 2018 and 2022. The comparatively lower CAGR was attributed to the building phase of the market. COVID-19 has had a positive impact on the dark store market. Even in some parts of the world, the requirement of dark stores serving in a D2C manner was triggered due to the rising virus threat. Companies introduce their dark stores to reach customers directly from the production facility.

As per the report, multiple D2C brands in India have crossed Rs 100 crore in revenue in 3-5 years after their introduction. The market holds numerous opportunities for the future as it is anticipated to rise at a CAGR of 38% during the forecast period, attributing its growth to faster deliveries and a highly interactive shopping experience.

Key Drivers and Restraints Shaping the Dark Store Market

Drivers:

The rising demand for dark stores is attributed to the benefits related to the concept of a dark store, such as quick and contact-free shopping, enhanced distribution and quicker delivery, a wide audience, improved SKU management, and extended distribution channels. The need for social distance and contactless transactions.

Dark stores let end users purchase their groceries or food item without letting them enter the dark store. The increased number of physical stores transformed into dark stores due to the higher sales and better showcasing of the products. The higher adoption of dark stores as the space lets you cater to a much larger potential audience due to the availability of 24/7. The advanced 5G networks with smartphones penetrating the urban strata of the regions push the demand for dark stores. Better stock-keeping unit management through enhanced click-and-collect capabilities helps the market perform better. The busy lifestyle of end users has let them shop through these dark store portals.

Restraints:

The major restraints for the market are lower awareness and people preferring conventional methods over virtual shopping. Furthermore, the major restriction for the market is the challenge of perishability. The location of the dark store should be in the high-order prone areas, which is not always possible for the supplier.

Dark Store Market Analysis by Product Category and Fulfillment Type

Which segment is the most fruitful in the Dark Store Market by Age Group Category?

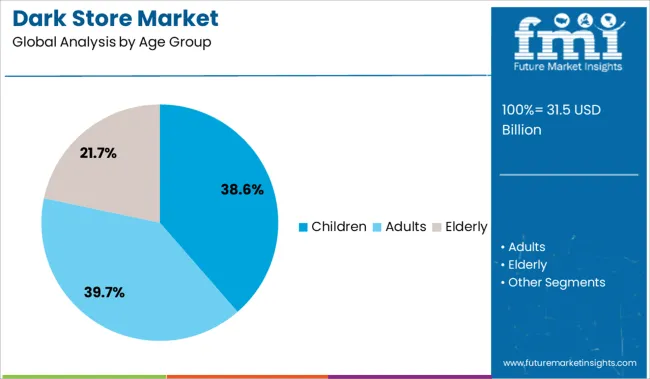
The age group category is divided into children, adults, and the elderly. The adult segment holds the higher traction for the dark store market, followed by the elderly age group. The adult segment has the highest access to the internet, and it follows most of the online shopping trends. At the same time, the elderly age group looks for ease when it comes to ordering groceries and household stuff through dark stores.

The Kesari Mahratta Trust reports that the adult age group holds a share of 42% (31-40 years old), while the elderly class holds a share of 16% (Above 60 years) and 15.1% (Between 41-50 years).

Which segment is the most fruitful in the Dark Store Market by Delivery Option Category?

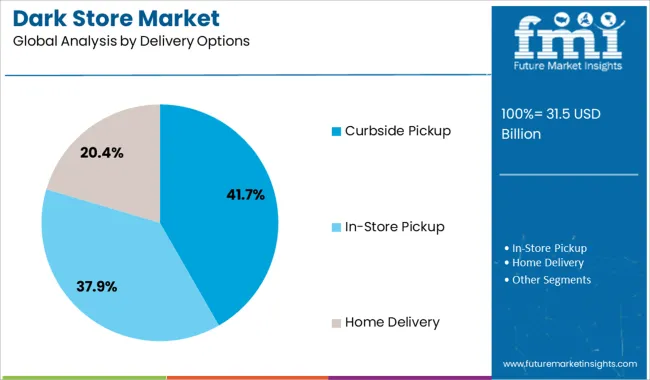
The delivery option category is led by the online delivery option due to ease and time-saving process. Curbside pickup is also considered to be an easy option though COVID-19 and longer lockdowns have made end users habitual to the easy online delivery options when it comes to getting something online.
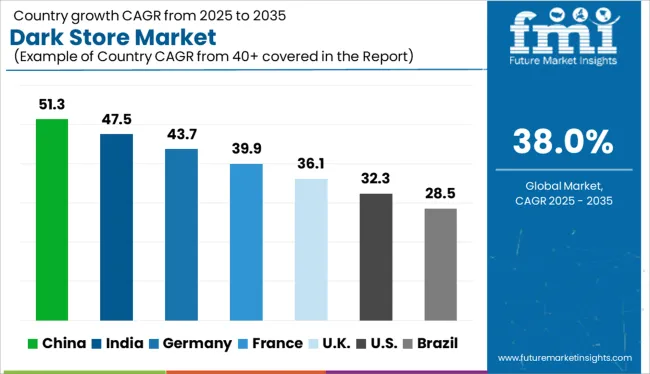
Country-wise Insights into the Dark Store Business Model

5G Networks and Higher Integrated Smartphone Technology fuels the Demand for Dark Store in the Region

North America, with a rising number of dark stores due to the higher per capita income and increased penetration of smartphones, leads the market. It holds a share of 35.8% in 2023, owing to the presence of major brands with multi-dimensional distribution channels along with the busy schedule of people residing in the region. FMI explains that the adult population living in the USA makes more than 30 online purchases every month.

Higher Brands Listings along with the Pandemic Skyrocketing the eCommerce Businesses Gains Traction for the European region

The rising number of brands that adopt the concept of the dark store is due to the easy availability of the product coupled with the cost-friendly setup. The dark store provides online delivery of the desired items. Thus, the pandemic has fuelled the usage of dark stores though dark stores have witnessed backlash among the cities across Europe as the locals complain of traffic and trash.

Emerging Economies such as China and India’s Adoption of Digital Contactless Payments and Higher Acceptance rate for Online Shopping is Fueling the Sales of Dark Stores in the Region

India and China are increasing the per capita income of their citizens. Thus, technological adoption is also higher than its counterparts. India’s digital economy has expanded its boundaries and has attracted concepts like dark stores. With thousands of startups working, dark store startups are also booming in the urban part of the country. While China, with a more enclosed economy, has launched its own platforms for the regulation of dark stores, easing the process of enlisting the products and delivering them.
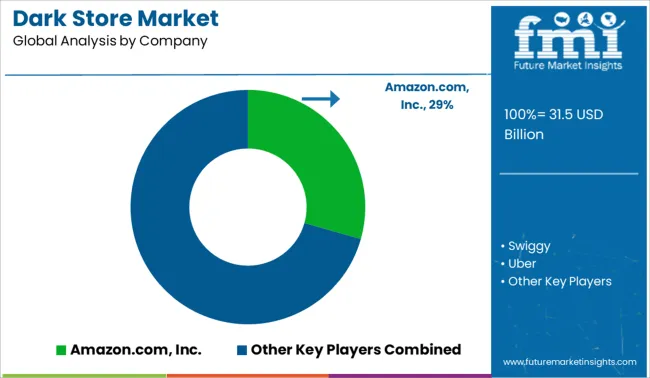
Competitive Landscape of the Dark Store Market

The competitors focus on making stores with better accessibility and availability. The brands providing n number of payment options and delivery options while also providing same-day delivery options fuels the market competition. Furthermore, the key players adopt the strategy of acquisition, merger, and other expansionist tricks to strengthen their supply chain.

Recent Market Developments

  • June 2022: Naturepro has introduced same-day delivery across India along with the opening of ZFW dark stores. Both brands have partnered to promote sustainable and affordable products.
  • September 2022: Intacart has acquired Rosie to implement and use its technology in locally operated grocery spaces, expanding the customer base and distribution channels.
  • Amazon India has signed MOUs with the Council of Handicraft Development Corporation (COHANDS) to promote the products under the Karigar program, which is an initiative that supports local craftsmen.

Key Players in the Dark Store Industry

  • Amazon.com, Inc.
  • Swiggy
  • Uber
  • Ola Foods
  • Supermarket Grocery Supplies Pvt Ltd.
  • Walmart, Inc.
  • Target Brands, Inc
  • Dunzo Daily
  • Instacart
  • Auchan
  • Wolt
  • Flipkart
  • Grab

Scope of the Dark Store Market Report

Attribute Details
Forecast Period 2023 to 2033
Historical Data Available for 2018 to 2022
Market Analysis USD Billion for Value and Units for Volume
Key Regions Covered North America; Latin America; Europe; Asia Pacific; Oceania; and Middle East and Africa(MEA)
Key Countries Covered USA, Canada, Mexico, Germany, United Kingdom, France, Italy, Spain, China, Japan, India, South Korea, Australia, Brazil, Argentina, South Africa, and United Arab Emirates(UAE)
Key Segments Covered Product, Grade, Source, Form, Applications, and Region
Key Companies Profiled Amazon.com, Inc.; Swiggy; Uber; Ola Foods; Supermarket Grocery Supplies Pvt Ltd.; Walmart, Inc.; Target Brands, Inc; Dunzo Daily; Instacart; Auchan; Wolt; Flipkart; Grab
Report Coverage Market Forecast, Company Share Analysis, Competition Intelligence, Drivers, Restraints, Opportunities and Threats Analysis, Market Dynamics and Challenges, and Strategic Growth Initiatives
Customization & Pricing Available upon Request

Top Investment Segments in the Dark Store Market by Category

By Age Group, Dark Store Market is Segmented as:

  • Children
  • Adults
  • Elderly

By Category, Dark Store Market is Segmented as:

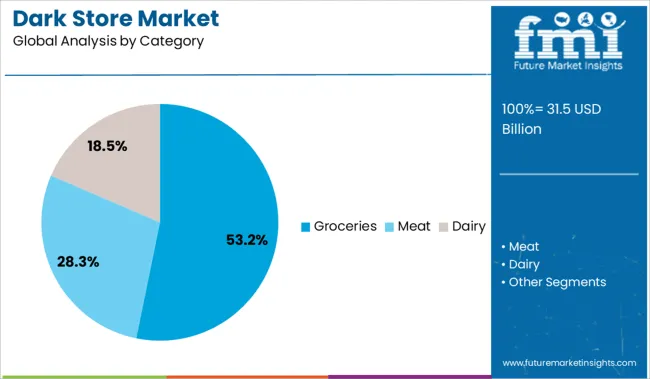
  • Groceries
  • Meat
  • Dairy

By Delivery Options, Dark Store Market is Segmented as:

  • Curbside Pickup
  • In-Store Pickup
  • Home Delivery

By Non-Food Products, Dark Store Market is Segmented as:

  • Cleaning
  • Essentials
  • Bath & Body

By Region, the Dark store Market is Segmented as:

  • North America
  • Europe
  • East Asia
  • South Asia & Pacific
  • Middle East and Africa(MEA)

Table of Content

  • 1. Executive Summary
  • 2. Market Overview
  • 3. Market Background
  • 4. Global Market Analysis 2018 to 2022 and Forecast 2023 to 2033
  • 5. Global Market Analysis 2018 to 2022 and Forecast 2023 to 2033, By Age Group
    • 5.1. Children
    • 5.2. Adults
    • 5.3. Elderly
  • 6. Global Market Analysis 2018 to 2022 and Forecast 2023 to 2033, By Category
    • 6.1. Groceries
    • 6.2. Meat
    • 6.3. Dairy
  • 7. Global Market Analysis 2018 to 2022 and Forecast 2023 to 2033, By Delivery Options
    • 7.1. Curbside Pickup
    • 7.2. In-Store Pickup
    • 7.3. Home Delivery
  • 8. Global Market Analysis 2018 to 2022 and Forecast 2023 to 2033, By Non-Food Products
    • 8.1. Cleaning
    • 8.2. Essentials
    • 8.3. Bath & Body
  • 9. Global Market Analysis 2018 to 2022 and Forecast 2023 to 2033, By Region
    • 9.1. North America
    • 9.2. Latin America
    • 9.3. Europe
    • 9.4. South Asia
    • 9.5. East Asia
    • 9.6. Oceania
    • 9.7. Middle East and Africa (MEA)
  • 10. North America Market Analysis 2018 to 2022 and Forecast 2023 to 2033, By Country
  • 11. Latin America Market Analysis 2018 to 2022 and Forecast 2023 to 2033, By Country
  • 12. Europe Market Analysis 2018 to 2022 and Forecast 2023 to 2033, By Country
  • 13. South Asia Market Analysis 2018 to 2022 and Forecast 2023 to 2033, By Country
  • 14. East Asia Market Analysis 2018 to 2022 and Forecast 2023 to 2033, By Country
  • 15. Oceania Market Analysis 2018 to 2022 and Forecast 2023 to 2033, By Country
  • 16. MEA Market Analysis 2018 to 2022 and Forecast 2023 to 2033, By Country
  • 17. Key Countries Market Analysis
  • 18. Market Structure Analysis
  • 19. Competition Analysis
    • 19.1. Amazon.com, Inc.
    • 19.2. Swiggy
    • 19.3. Uber
    • 19.4. Ola Foods
    • 19.5. Supermarket Grocery Supplies Pvt Ltd.
    • 19.6. Walmart, Inc.
    • 19.7. Target Brands, Inc.
    • 19.8. Dunzo Daily
    • 19.9. Instacart
    • 19.10. Auchan
    • 19.11. Wolt
    • 19.12. Flipkart
    • 19.13. Grab
  • 20. Assumptions & Acronyms Used
  • 21. Research Methodology

List of Tables

Table 1: Global Market Value (US$ Million) Forecast by Region, 2018 to 2033

Table 2: Global Market Value (US$ Million) Forecast by Age Group, 2018 to 2033

Table 3: Global Market Value (US$ Million) Forecast by Category, 2018 to 2033

Table 4: Global Market Value (US$ Million) Forecast by Delivery Options, 2018 to 2033

Table 5: Global Market Value (US$ Million) Forecast by Non-Food Products, 2018 to 2033

Table 6: North America Market Value (US$ Million) Forecast by Country, 2018 to 2033

Table 7: North America Market Value (US$ Million) Forecast by Age Group, 2018 to 2033

Table 8: North America Market Value (US$ Million) Forecast by Category, 2018 to 2033

Table 9: North America Market Value (US$ Million) Forecast by Delivery Options, 2018 to 2033

Table 10: North America Market Value (US$ Million) Forecast by Non-Food Products, 2018 to 2033

Table 11: Latin America Market Value (US$ Million) Forecast by Country, 2018 to 2033

Table 12: Latin America Market Value (US$ Million) Forecast by Age Group, 2018 to 2033

Table 13: Latin America Market Value (US$ Million) Forecast by Category, 2018 to 2033

Table 14: Latin America Market Value (US$ Million) Forecast by Delivery Options, 2018 to 2033

Table 15: Latin America Market Value (US$ Million) Forecast by Non-Food Products, 2018 to 2033

Table 16: Europe Market Value (US$ Million) Forecast by Country, 2018 to 2033

Table 17: Europe Market Value (US$ Million) Forecast by Age Group, 2018 to 2033

Table 18: Europe Market Value (US$ Million) Forecast by Category, 2018 to 2033

Table 19: Europe Market Value (US$ Million) Forecast by Delivery Options, 2018 to 2033

Table 20: Europe Market Value (US$ Million) Forecast by Non-Food Products, 2018 to 2033

Table 21: South Asia Market Value (US$ Million) Forecast by Country, 2018 to 2033

Table 22: South Asia Market Value (US$ Million) Forecast by Age Group, 2018 to 2033

Table 23: South Asia Market Value (US$ Million) Forecast by Category, 2018 to 2033

Table 24: South Asia Market Value (US$ Million) Forecast by Delivery Options, 2018 to 2033

Table 25: South Asia Market Value (US$ Million) Forecast by Non-Food Products, 2018 to 2033

Table 26: East Asia Market Value (US$ Million) Forecast by Country, 2018 to 2033

Table 27: East Asia Market Value (US$ Million) Forecast by Age Group, 2018 to 2033

Table 28: East Asia Market Value (US$ Million) Forecast by Category, 2018 to 2033

Table 29: East Asia Market Value (US$ Million) Forecast by Delivery Options, 2018 to 2033

Table 30: East Asia Market Value (US$ Million) Forecast by Non-Food Products, 2018 to 2033

Table 31: Oceania Market Value (US$ Million) Forecast by Country, 2018 to 2033

Table 32: Oceania Market Value (US$ Million) Forecast by Age Group, 2018 to 2033

Table 33: Oceania Market Value (US$ Million) Forecast by Category, 2018 to 2033

Table 34: Oceania Market Value (US$ Million) Forecast by Delivery Options, 2018 to 2033

Table 35: Oceania Market Value (US$ Million) Forecast by Non-Food Products, 2018 to 2033

Table 36: MEA Market Value (US$ Million) Forecast by Country, 2018 to 2033

Table 37: MEA Market Value (US$ Million) Forecast by Age Group, 2018 to 2033

Table 38: MEA Market Value (US$ Million) Forecast by Category, 2018 to 2033

Table 39: MEA Market Value (US$ Million) Forecast by Delivery Options, 2018 to 2033

Table 40: MEA Market Value (US$ Million) Forecast by Non-Food Products, 2018 to 2033

List of Figures

Figure 1: Global Market Value (US$ Million) by Age Group, 2023 to 2033

Figure 2: Global Market Value (US$ Million) by Category, 2023 to 2033

Figure 3: Global Market Value (US$ Million) by Delivery Options, 2023 to 2033

Figure 4: Global Market Value (US$ Million) by Non-Food Products, 2023 to 2033

Figure 5: Global Market Value (US$ Million) by Region, 2023 to 2033

Figure 6: Global Market Value (US$ Million) Analysis by Region, 2018 to 2033

Figure 7: Global Market Value Share (%) and BPS Analysis by Region, 2023 to 2033

Figure 8: Global Market Y-o-Y Growth (%) Projections by Region, 2023 to 2033

Figure 9: Global Market Value (US$ Million) Analysis by Age Group, 2018 to 2033

Figure 10: Global Market Value Share (%) and BPS Analysis by Age Group, 2023 to 2033

Figure 11: Global Market Y-o-Y Growth (%) Projections by Age Group, 2023 to 2033

Figure 12: Global Market Value (US$ Million) Analysis by Category, 2018 to 2033

Figure 13: Global Market Value Share (%) and BPS Analysis by Category, 2023 to 2033

Figure 14: Global Market Y-o-Y Growth (%) Projections by Category, 2023 to 2033

Figure 15: Global Market Value (US$ Million) Analysis by Delivery Options, 2018 to 2033

Figure 16: Global Market Value Share (%) and BPS Analysis by Delivery Options, 2023 to 2033

Figure 17: Global Market Y-o-Y Growth (%) Projections by Delivery Options, 2023 to 2033

Figure 18: Global Market Value (US$ Million) Analysis by Non-Food Products, 2018 to 2033

Figure 19: Global Market Value Share (%) and BPS Analysis by Non-Food Products, 2023 to 2033

Figure 20: Global Market Y-o-Y Growth (%) Projections by Non-Food Products, 2023 to 2033

Figure 21: Global Market Attractiveness by Age Group, 2023 to 2033

Figure 22: Global Market Attractiveness by Category, 2023 to 2033

Figure 23: Global Market Attractiveness by Delivery Options, 2023 to 2033

Figure 24: Global Market Attractiveness by Non-Food Products, 2023 to 2033

Figure 25: Global Market Attractiveness by Region, 2023 to 2033

Figure 26: North America Market Value (US$ Million) by Age Group, 2023 to 2033

Figure 27: North America Market Value (US$ Million) by Category, 2023 to 2033

Figure 28: North America Market Value (US$ Million) by Delivery Options, 2023 to 2033

Figure 29: North America Market Value (US$ Million) by Non-Food Products, 2023 to 2033

Figure 30: North America Market Value (US$ Million) by Country, 2023 to 2033

Figure 31: North America Market Value (US$ Million) Analysis by Country, 2018 to 2033

Figure 32: North America Market Value Share (%) and BPS Analysis by Country, 2023 to 2033

Figure 33: North America Market Y-o-Y Growth (%) Projections by Country, 2023 to 2033

Figure 34: North America Market Value (US$ Million) Analysis by Age Group, 2018 to 2033

Figure 35: North America Market Value Share (%) and BPS Analysis by Age Group, 2023 to 2033

Figure 36: North America Market Y-o-Y Growth (%) Projections by Age Group, 2023 to 2033

Figure 37: North America Market Value (US$ Million) Analysis by Category, 2018 to 2033

Figure 38: North America Market Value Share (%) and BPS Analysis by Category, 2023 to 2033

Figure 39: North America Market Y-o-Y Growth (%) Projections by Category, 2023 to 2033

Figure 40: North America Market Value (US$ Million) Analysis by Delivery Options, 2018 to 2033

Figure 41: North America Market Value Share (%) and BPS Analysis by Delivery Options, 2023 to 2033

Figure 42: North America Market Y-o-Y Growth (%) Projections by Delivery Options, 2023 to 2033

Figure 43: North America Market Value (US$ Million) Analysis by Non-Food Products, 2018 to 2033

Figure 44: North America Market Value Share (%) and BPS Analysis by Non-Food Products, 2023 to 2033

Figure 45: North America Market Y-o-Y Growth (%) Projections by Non-Food Products, 2023 to 2033

Figure 46: North America Market Attractiveness by Age Group, 2023 to 2033

Figure 47: North America Market Attractiveness by Category, 2023 to 2033

Figure 48: North America Market Attractiveness by Delivery Options, 2023 to 2033

Figure 49: North America Market Attractiveness by Non-Food Products, 2023 to 2033

Figure 50: North America Market Attractiveness by Country, 2023 to 2033

Figure 51: Latin America Market Value (US$ Million) by Age Group, 2023 to 2033

Figure 52: Latin America Market Value (US$ Million) by Category, 2023 to 2033

Figure 53: Latin America Market Value (US$ Million) by Delivery Options, 2023 to 2033

Figure 54: Latin America Market Value (US$ Million) by Non-Food Products, 2023 to 2033

Figure 55: Latin America Market Value (US$ Million) by Country, 2023 to 2033

Figure 56: Latin America Market Value (US$ Million) Analysis by Country, 2018 to 2033

Figure 57: Latin America Market Value Share (%) and BPS Analysis by Country, 2023 to 2033

Figure 58: Latin America Market Y-o-Y Growth (%) Projections by Country, 2023 to 2033

Figure 59: Latin America Market Value (US$ Million) Analysis by Age Group, 2018 to 2033

Figure 60: Latin America Market Value Share (%) and BPS Analysis by Age Group, 2023 to 2033

Figure 61: Latin America Market Y-o-Y Growth (%) Projections by Age Group, 2023 to 2033

Figure 62: Latin America Market Value (US$ Million) Analysis by Category, 2018 to 2033

Figure 63: Latin America Market Value Share (%) and BPS Analysis by Category, 2023 to 2033

Figure 64: Latin America Market Y-o-Y Growth (%) Projections by Category, 2023 to 2033

Figure 65: Latin America Market Value (US$ Million) Analysis by Delivery Options, 2018 to 2033

Figure 66: Latin America Market Value Share (%) and BPS Analysis by Delivery Options, 2023 to 2033

Figure 67: Latin America Market Y-o-Y Growth (%) Projections by Delivery Options, 2023 to 2033

Figure 68: Latin America Market Value (US$ Million) Analysis by Non-Food Products, 2018 to 2033

Figure 69: Latin America Market Value Share (%) and BPS Analysis by Non-Food Products, 2023 to 2033

Figure 70: Latin America Market Y-o-Y Growth (%) Projections by Non-Food Products, 2023 to 2033

Figure 71: Latin America Market Attractiveness by Age Group, 2023 to 2033

Figure 72: Latin America Market Attractiveness by Category, 2023 to 2033

Figure 73: Latin America Market Attractiveness by Delivery Options, 2023 to 2033

Figure 74: Latin America Market Attractiveness by Non-Food Products, 2023 to 2033

Figure 75: Latin America Market Attractiveness by Country, 2023 to 2033

Figure 76: Europe Market Value (US$ Million) by Age Group, 2023 to 2033

Figure 77: Europe Market Value (US$ Million) by Category, 2023 to 2033

Figure 78: Europe Market Value (US$ Million) by Delivery Options, 2023 to 2033

Figure 79: Europe Market Value (US$ Million) by Non-Food Products, 2023 to 2033

Figure 80: Europe Market Value (US$ Million) by Country, 2023 to 2033

Figure 81: Europe Market Value (US$ Million) Analysis by Country, 2018 to 2033

Figure 82: Europe Market Value Share (%) and BPS Analysis by Country, 2023 to 2033

Figure 83: Europe Market Y-o-Y Growth (%) Projections by Country, 2023 to 2033

Figure 84: Europe Market Value (US$ Million) Analysis by Age Group, 2018 to 2033

Figure 85: Europe Market Value Share (%) and BPS Analysis by Age Group, 2023 to 2033

Figure 86: Europe Market Y-o-Y Growth (%) Projections by Age Group, 2023 to 2033

Figure 87: Europe Market Value (US$ Million) Analysis by Category, 2018 to 2033

Figure 88: Europe Market Value Share (%) and BPS Analysis by Category, 2023 to 2033

Figure 89: Europe Market Y-o-Y Growth (%) Projections by Category, 2023 to 2033

Figure 90: Europe Market Value (US$ Million) Analysis by Delivery Options, 2018 to 2033

Figure 91: Europe Market Value Share (%) and BPS Analysis by Delivery Options, 2023 to 2033

Figure 92: Europe Market Y-o-Y Growth (%) Projections by Delivery Options, 2023 to 2033

Figure 93: Europe Market Value (US$ Million) Analysis by Non-Food Products, 2018 to 2033

Figure 94: Europe Market Value Share (%) and BPS Analysis by Non-Food Products, 2023 to 2033

Figure 95: Europe Market Y-o-Y Growth (%) Projections by Non-Food Products, 2023 to 2033

Figure 96: Europe Market Attractiveness by Age Group, 2023 to 2033

Figure 97: Europe Market Attractiveness by Category, 2023 to 2033

Figure 98: Europe Market Attractiveness by Delivery Options, 2023 to 2033

Figure 99: Europe Market Attractiveness by Non-Food Products, 2023 to 2033

Figure 100: Europe Market Attractiveness by Country, 2023 to 2033

Figure 101: South Asia Market Value (US$ Million) by Age Group, 2023 to 2033

Figure 102: South Asia Market Value (US$ Million) by Category, 2023 to 2033

Figure 103: South Asia Market Value (US$ Million) by Delivery Options, 2023 to 2033

Figure 104: South Asia Market Value (US$ Million) by Non-Food Products, 2023 to 2033

Figure 105: South Asia Market Value (US$ Million) by Country, 2023 to 2033

Figure 106: South Asia Market Value (US$ Million) Analysis by Country, 2018 to 2033

Figure 107: South Asia Market Value Share (%) and BPS Analysis by Country, 2023 to 2033

Figure 108: South Asia Market Y-o-Y Growth (%) Projections by Country, 2023 to 2033

Figure 109: South Asia Market Value (US$ Million) Analysis by Age Group, 2018 to 2033

Figure 110: South Asia Market Value Share (%) and BPS Analysis by Age Group, 2023 to 2033

Figure 111: South Asia Market Y-o-Y Growth (%) Projections by Age Group, 2023 to 2033

Figure 112: South Asia Market Value (US$ Million) Analysis by Category, 2018 to 2033

Figure 113: South Asia Market Value Share (%) and BPS Analysis by Category, 2023 to 2033

Figure 114: South Asia Market Y-o-Y Growth (%) Projections by Category, 2023 to 2033

Figure 115: South Asia Market Value (US$ Million) Analysis by Delivery Options, 2018 to 2033

Figure 116: South Asia Market Value Share (%) and BPS Analysis by Delivery Options, 2023 to 2033

Figure 117: South Asia Market Y-o-Y Growth (%) Projections by Delivery Options, 2023 to 2033

Figure 118: South Asia Market Value (US$ Million) Analysis by Non-Food Products, 2018 to 2033

Figure 119: South Asia Market Value Share (%) and BPS Analysis by Non-Food Products, 2023 to 2033

Figure 120: South Asia Market Y-o-Y Growth (%) Projections by Non-Food Products, 2023 to 2033

Figure 121: South Asia Market Attractiveness by Age Group, 2023 to 2033

Figure 122: South Asia Market Attractiveness by Category, 2023 to 2033

Figure 123: South Asia Market Attractiveness by Delivery Options, 2023 to 2033

Figure 124: South Asia Market Attractiveness by Non-Food Products, 2023 to 2033

Figure 125: South Asia Market Attractiveness by Country, 2023 to 2033

Figure 126: East Asia Market Value (US$ Million) by Age Group, 2023 to 2033

Figure 127: East Asia Market Value (US$ Million) by Category, 2023 to 2033

Figure 128: East Asia Market Value (US$ Million) by Delivery Options, 2023 to 2033

Figure 129: East Asia Market Value (US$ Million) by Non-Food Products, 2023 to 2033

Figure 130: East Asia Market Value (US$ Million) by Country, 2023 to 2033

Figure 131: East Asia Market Value (US$ Million) Analysis by Country, 2018 to 2033

Figure 132: East Asia Market Value Share (%) and BPS Analysis by Country, 2023 to 2033

Figure 133: East Asia Market Y-o-Y Growth (%) Projections by Country, 2023 to 2033

Figure 134: East Asia Market Value (US$ Million) Analysis by Age Group, 2018 to 2033

Figure 135: East Asia Market Value Share (%) and BPS Analysis by Age Group, 2023 to 2033

Figure 136: East Asia Market Y-o-Y Growth (%) Projections by Age Group, 2023 to 2033

Figure 137: East Asia Market Value (US$ Million) Analysis by Category, 2018 to 2033

Figure 138: East Asia Market Value Share (%) and BPS Analysis by Category, 2023 to 2033

Figure 139: East Asia Market Y-o-Y Growth (%) Projections by Category, 2023 to 2033

Figure 140: East Asia Market Value (US$ Million) Analysis by Delivery Options, 2018 to 2033

Figure 141: East Asia Market Value Share (%) and BPS Analysis by Delivery Options, 2023 to 2033

Figure 142: East Asia Market Y-o-Y Growth (%) Projections by Delivery Options, 2023 to 2033

Figure 143: East Asia Market Value (US$ Million) Analysis by Non-Food Products, 2018 to 2033

Figure 144: East Asia Market Value Share (%) and BPS Analysis by Non-Food Products, 2023 to 2033

Figure 145: East Asia Market Y-o-Y Growth (%) Projections by Non-Food Products, 2023 to 2033

Figure 146: East Asia Market Attractiveness by Age Group, 2023 to 2033

Figure 147: East Asia Market Attractiveness by Category, 2023 to 2033

Figure 148: East Asia Market Attractiveness by Delivery Options, 2023 to 2033

Figure 149: East Asia Market Attractiveness by Non-Food Products, 2023 to 2033

Figure 150: East Asia Market Attractiveness by Country, 2023 to 2033

Figure 151: Oceania Market Value (US$ Million) by Age Group, 2023 to 2033

Figure 152: Oceania Market Value (US$ Million) by Category, 2023 to 2033

Figure 153: Oceania Market Value (US$ Million) by Delivery Options, 2023 to 2033

Figure 154: Oceania Market Value (US$ Million) by Non-Food Products, 2023 to 2033

Figure 155: Oceania Market Value (US$ Million) by Country, 2023 to 2033

Figure 156: Oceania Market Value (US$ Million) Analysis by Country, 2018 to 2033

Figure 157: Oceania Market Value Share (%) and BPS Analysis by Country, 2023 to 2033

Figure 158: Oceania Market Y-o-Y Growth (%) Projections by Country, 2023 to 2033

Figure 159: Oceania Market Value (US$ Million) Analysis by Age Group, 2018 to 2033

Figure 160: Oceania Market Value Share (%) and BPS Analysis by Age Group, 2023 to 2033

Figure 161: Oceania Market Y-o-Y Growth (%) Projections by Age Group, 2023 to 2033

Figure 162: Oceania Market Value (US$ Million) Analysis by Category, 2018 to 2033

Figure 163: Oceania Market Value Share (%) and BPS Analysis by Category, 2023 to 2033

Figure 164: Oceania Market Y-o-Y Growth (%) Projections by Category, 2023 to 2033

Figure 165: Oceania Market Value (US$ Million) Analysis by Delivery Options, 2018 to 2033

Figure 166: Oceania Market Value Share (%) and BPS Analysis by Delivery Options, 2023 to 2033

Figure 167: Oceania Market Y-o-Y Growth (%) Projections by Delivery Options, 2023 to 2033

Figure 168: Oceania Market Value (US$ Million) Analysis by Non-Food Products, 2018 to 2033

Figure 169: Oceania Market Value Share (%) and BPS Analysis by Non-Food Products, 2023 to 2033

Figure 170: Oceania Market Y-o-Y Growth (%) Projections by Non-Food Products, 2023 to 2033

Figure 171: Oceania Market Attractiveness by Age Group, 2023 to 2033

Figure 172: Oceania Market Attractiveness by Category, 2023 to 2033

Figure 173: Oceania Market Attractiveness by Delivery Options, 2023 to 2033

Figure 174: Oceania Market Attractiveness by Non-Food Products, 2023 to 2033

Figure 175: Oceania Market Attractiveness by Country, 2023 to 2033

Figure 176: MEA Market Value (US$ Million) by Age Group, 2023 to 2033

Figure 177: MEA Market Value (US$ Million) by Category, 2023 to 2033

Figure 178: MEA Market Value (US$ Million) by Delivery Options, 2023 to 2033

Figure 179: MEA Market Value (US$ Million) by Non-Food Products, 2023 to 2033

Figure 180: MEA Market Value (US$ Million) by Country, 2023 to 2033

Figure 181: MEA Market Value (US$ Million) Analysis by Country, 2018 to 2033

Figure 182: MEA Market Value Share (%) and BPS Analysis by Country, 2023 to 2033

Figure 183: MEA Market Y-o-Y Growth (%) Projections by Country, 2023 to 2033

Figure 184: MEA Market Value (US$ Million) Analysis by Age Group, 2018 to 2033

Figure 185: MEA Market Value Share (%) and BPS Analysis by Age Group, 2023 to 2033

Figure 186: MEA Market Y-o-Y Growth (%) Projections by Age Group, 2023 to 2033

Figure 187: MEA Market Value (US$ Million) Analysis by Category, 2018 to 2033

Figure 188: MEA Market Value Share (%) and BPS Analysis by Category, 2023 to 2033

Figure 189: MEA Market Y-o-Y Growth (%) Projections by Category, 2023 to 2033

Figure 190: MEA Market Value (US$ Million) Analysis by Delivery Options, 2018 to 2033

Figure 191: MEA Market Value Share (%) and BPS Analysis by Delivery Options, 2023 to 2033

Figure 192: MEA Market Y-o-Y Growth (%) Projections by Delivery Options, 2023 to 2033

Figure 193: MEA Market Value (US$ Million) Analysis by Non-Food Products, 2018 to 2033

Figure 194: MEA Market Value Share (%) and BPS Analysis by Non-Food Products, 2023 to 2033

Figure 195: MEA Market Y-o-Y Growth (%) Projections by Non-Food Products, 2023 to 2033

Figure 196: MEA Market Attractiveness by Age Group, 2023 to 2033

Figure 197: MEA Market Attractiveness by Category, 2023 to 2033

Figure 198: MEA Market Attractiveness by Delivery Options, 2023 to 2033

Figure 199: MEA Market Attractiveness by Non-Food Products, 2023 to 2033

Figure 200: MEA Market Attractiveness by Country, 2023 to 2033

Frequently Asked Questions

How big is the Dark Store Market?

The dark store market is anticipated to have a market value of USD 16.54 billion in 2023.

Which is the biggest market region for Dark Store Market?

The North American region holds the biggest share of 35.8% in the Dark store market

At What Rate Will Dark Store Demand Grow across the World?

The demand for dark stores around the globe is expected to grow at a CAGR of 38% between 2023 and 2033.

How was the performance in the last five years?

The dark store market grew at a CAGR of around 24.5% from 2018 to 2022.

Explore Consumer Services Insights

Future Market Insights

Dark Store Market