

- Market Size (2026)
- USD 26.6 Bn
- Forecast (2036)
- USD 51.9 Bn
- CAGR (2026 to 2036)
- 6.9%
Dairy Alternatives Market Size, Market Forecast and Outlook By FMI
The dairy alternatives market was valued at USD 24.9 billion in 2025 and is projected to reach USD 26.6 billion in 2026. It is forecast to reach USD 51.9 billion by 2036 at 6.9% CAGR. Soy-based products are projected to lead the source segment with 52.0% share. Supermarkets and hypermarkets are expected to hold 35.0% share of distribution channel demand in 2026.
Consistent demand for dairy alternatives is moving the category away from trial-led shelf expansion toward taste and nutrition proof. Good Food Institute retail tracking placed United States plant-based milk at USD 2.7 billion in 2025. Plant-based milk accounted for 13.0% of total milk dollar sales and 12.0% of unit sales. Within the plant-based milk segment, almond held a 49.0% share of unit sales, followed by oat at 21.0% and soy at 8.0%. The unit-sales split show why base selection matters for shelf velocity and formulation strategy.
Europe shows a different pattern as private label and barista formats shape repeat purchasing. Good Food Institute Europe reported that Germany reached EUR 1.68 billion across six plant-based categories in 2024. The same data placed France at EUR 537 million across five categories and the United Kingdom at GBP 904 million across six categories. This makes Europe important for dairy terminology rules and private-label expansion.
Summary of the Dairy Alternatives Market
- Demand and Growth Drivers
- Retail demand is rising due to high consumption of plant-based milk in coffee/cereal and home cooking.
- Regulatory clarity in the United States and India is expected to raise label discipline for plant-based foods.
- Foodservice use is moving toward oat and barista blends since these formats handle foam and heat better.
- Private label is lowering entry prices in Europe, which improves trial among value-seeking households.
- Product and Segment View
- Soy-based products are projected to account for 52.0% share in 2026 due to protein density and long consumer familiarity.
- Non-dairy milk is expected to hold 71.0% share in 2026 as beverage use remains the daily replacement occasion.
- Supermarkets and hypermarkets are projected to hold 35.0% share in 2026 as chilled visibility supports repeat buying.
- Growth is expected in non-dairy yogurt and non-dairy ice cream as shoppers seek fuller dairy replacement baskets.
- Geography and Competitive Outlook
- Germany is expected to record 9.0% CAGR through 2036 due to private-label depth and dairy terminology discipline.
- India is forecast at 7.0% CAGR through 2036 as vegan logo endorsement improves trust for labeled products.
- Danone, Oatly, Blue Diamond Growers and Califia Farms influence branded shelf space in mature retail markets.
- SunOpta and other private-label manufacturers are important as retailers seek lower-price aseptic beverage options.
- Analyst Opinion
- Nandini Roy, Principal Consultant at FMI says, "The opportunity in dairy alternatives is no longer only about removing milk. I see the market moving toward everyday formats that match dairy on taste, nutrition and price. Suppliers that can prove repeat purchase in milk, yogurt and cheese formats will shape the next ten years of category value."
- Dairy Alternatives Market Value Analysis
- Rising household penetration and high repeat purchase rates are shifting the category from trial to sustained consumption, strengthening long-term revenue expansion.
- Increasing demand for taste, nutrition, and clean-label products is pushing brands to improve formulations, driving higher adoption and repeat buying.
- Expansion of foodservice channels such as cafés using oat and barista blends is accelerating product visibility and consumer adoption.
- Supermarket and hypermarket dominance with strong shelf visibility is supporting repeat purchases and strengthening market penetration.
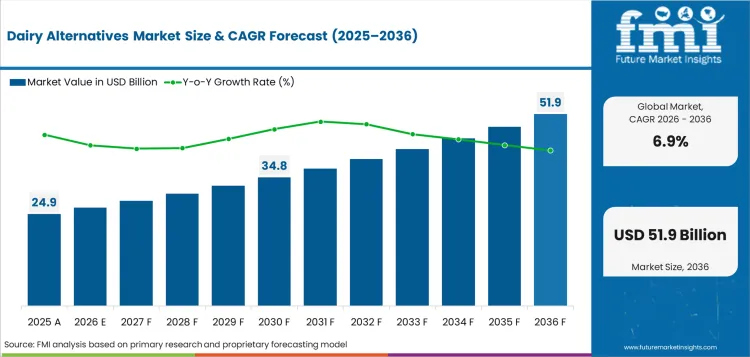
Key Takeaways, Market Size, and Forecast
| Metric | Value |
|---|---|
| Market Size (2025) | USD 24.9 Billion |
| Market Size (2036) | USD 51.9 Billion |
| CAGR (2026–2036) | 6.9% |
| Incremental Opportunity (2026–2036) | USD 25.3 Billion |
| Leading Source (2026) | Soy-Based Products |
| Soy-Based Products Share (2026) | 52.0% |
| Leading Channel (2026) | Supermarkets And Hypermarkets |
| Supermarkets And Hypermarkets Share (2026) | 35.0% |
| Fastest-Growing Country | Germany |
| Germany CAGR | 9.0% |
| 2nd Fastest-Growing Country | India |
| India CAGR | 7.0% |
Dairy Alternatives Market Definition
The dairy alternatives market covers plant-derived products sold as substitutes for dairy milk, yogurt, cheese, butter, creamers and frozen desserts. The scope includes products made from soy, almond, oat, coconut, rice, pea and blended plant bases. Revenue covers finished retail products and foodservice formats sold through grocery stores, online channels, cafes and institutional food buyers. The scope excludes lactose-free dairy products made from animal milk.
Dairy Alternatives Market Inclusions
Market scope covers milk-style beverages, spoonable and drinkable cultured products, cheese-style products, ice cream-style products and butter-style spreads made without animal-derived dairy. The study includes shelf-stable and refrigerated products where plant ingredients define the product identity. Ingredient systems such as soy protein ingredients and oat protein are included only when they are directly tied to dairy alternative formulation.
Dairy Alternatives Market Exclusions
The scope excludes conventional dairy milk, lactose-free cow milk, dairy yogurt, dairy cheese and infant formula unless the product is sold as a plant-based dairy substitute. It excludes raw nuts, whole grains and protein powders sold outside dairy alternative positioning. It excludes restaurant menu items unless the dairy alternative ingredient is separately supplied as a commercial product.
Dairy Alternatives Market Research Methodology
- Primary Research: FMI analysts reviewed retailer category decisions, foodservice use cases, plant-based product portfolios and supplier manufacturing capabilities across major dairy alternative countries.
- Desk Research: The study used public data from official food regulators, industry bodies, company newsrooms and public retail category trackers published after January 2024.
- Market sizing and forecasting: Market size was estimated through a top-down check from FMI anchor values and cross-checked against retail category data. Segment shares were aligned with public FMI source and category evidence.
- Data validation: Forecast checks compared plant-based milk sales, retail household penetration, country regulations, company product launches and capacity signals from official company sources.
Why is the Dairy Alternatives Market Growing?
- Plant-based milk has become the repeat-use anchor since it works across coffee, cereal and direct drinking occasions.
- Clean-label and nutrition claims are forcing brands to improve protein, sugar and fortification standards.
- Retailers are using private label to keep plant-based alternatives within reach for price-sensitive households.
The plant-based milk category remains the primary growth base since it is used more often than cheese-style or frozen formats. Good Food Institute reported USD 2.7 billion in United States plant-based milk sales in 2025. The figure came with 38.0% household penetration and a 75.0% repeat rate. Those values place the category within mainstream grocery routines. Suppliers are working on taste and nutrition gaps instead of only building awareness.
One of the growth barriers is whether shoppers keep buying after trial when price or nutrition falls short of dairy. United States plant-based cheese dollar sales declined 10.0% in 2025 and unit sales declined 8.0%. The gap shows that harder-to-formulate products need stronger mouthfeel and melt performance. The opportunity is present in products that solve a daily use case and carry a clean ingredient list.
Market Segmentation Analysis
- Soy-based products are projected to reach 52.0% share in 2026 as protein and cost remain core buying factors.
- Non-dairy milk is expected to represent 71.0% share of product type in 2026 as beverage use drives repeat purchase.
- Supermarkets and hypermarkets are projected to capture 35.0% share in 2026 due to visibility and chilled assortment control.
- Online retail is expected to gain share in premium products since subscription and specialty brands can explain ingredients better.
- Blended bases are expected to rise as brands combine soy and almond to improve texture and nutrition.
The market is divided into three primary segment groups in the report scope. Source covers soy, almond, rice, coconut, oats and other plant bases. Product type covers non-dairy milk, butter, cheeses, yogurts, ice cream and other formats. Distribution channel covers supermarkets and hypermarkets, convenience stores, online retail and other routes. The segmentation shows that the core value remains in everyday beverage replacement and adjacent categories are working on texture and protein gaps.
Insights into the Soy Source Segment
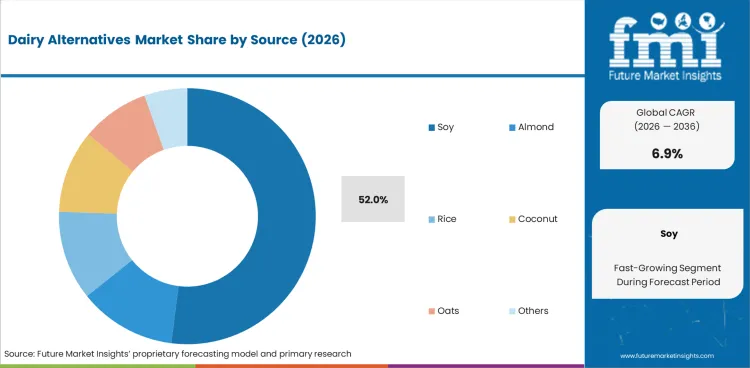
- Soy-based products are projected to account for 52.0% share of source demand in 2026 as soy combines protein density and long use in Asian beverage habits.
- Japan Soymilk Association reported 444,552 kiloliters of soy milk production in 2025, which supports soy as a tested base in beverage replacement.
Insights into the Almond Source Segment
- Almond-based products are expected to hold a stable role in 2026 as almond milk remains familiar in United States grocery aisles and coffee use.
- Blue Diamond Growers launched four Blue Diamond Almondmilk varieties in February 2026 and signals renewed brand effort around fewer ingredients and protein variants.
Insights into the Oat Source Segment
- Oat-based products are projected to expand faster than the market average through 2036 as barista use keeps oat visible in cafes and foodservice counters.
- Oatly announced a Landskrona investment in March 2026 that raises annual capacity from 150 million liters to 200 million liters.
Insights into the Non-Dairy Milk Product Type Segment
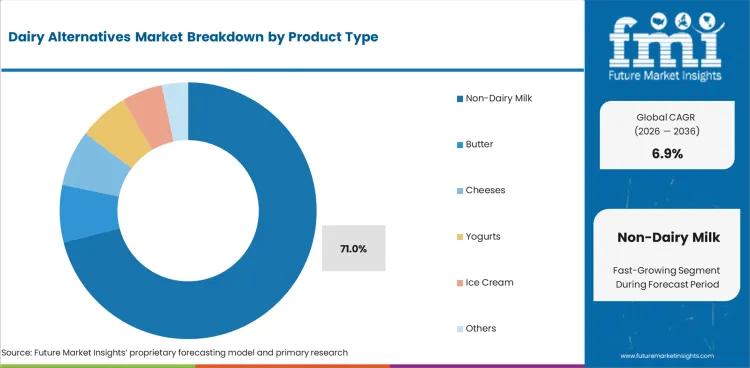
- Non-dairy milk is expected to account for 71.0% share of product type demand in 2026 as home and cafe beverage use remains highly frequent.
- Califia Farms launched its first soymilk in January 2026 with 8 grams of protein per serving to address the nutrition gap in plant-based milk.
Insights into the Non-Dairy Yogurt Product Type Segment
- Non-dairy yogurt is projected to gain selective share through 2036 as cultured products improve protein and probiotic positioning.
- Forager Project Greek-style dairy-free yogurt lists 10 grams of plant-based protein per serving and shows how brands are narrowing older nutrition gaps.
Insights into the Supermarkets and Hypermarkets Channel Segment
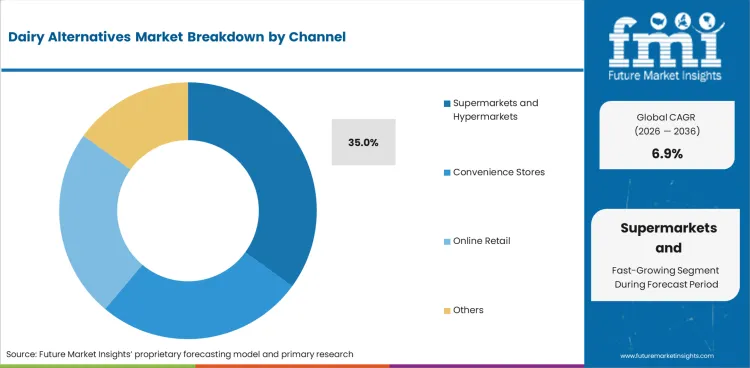
- Supermarkets and hypermarkets are expected to account for 35.0% share of channel demand in 2026 as shelf placement drives repeat purchase.
- Germany had EUR 1.68 billion in six plant-based retail categories in 2024, which shows why grocery pricing matters in mature markets.
Dairy Alternatives Market Drivers, Restraints, and Opportunities
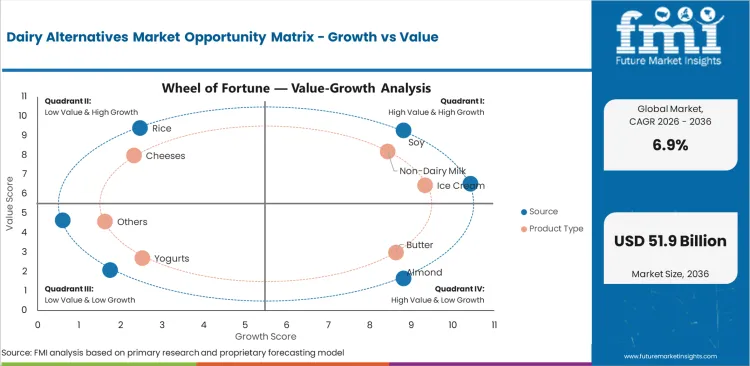
- Plant-based milk repeat use is driving the forecast as households adopt beverages for coffee and breakfast routines.
- Price and nutrition gaps restrain cheese-style and frozen formats when consumers compare them with dairy products.
- Blended bases create an opportunity as brands combine protein, mouthfeel and cleaner ingredient statements.
Dairy alternatives industry is expanding as the product mix moves from lifestyle claims toward everyday utility. The United States Food and Drug Administration issued draft guidance in January 2025 for naming and labeling plant-based alternatives to animal-derived foods. Clearer naming can reduce shopper confusion and raise the standard for product identity. Manufacturers that build labels around source and use occasion will have a better chance to hold shelf space.
Price and Nutrition Gaps Are Slowing Repeat Use
The main restraint is the gap between early trial and repeat buying in difficult formats. Good Food Institute data showed that United States plant-based yogurt dollar sales rose 7.0% in 2025 and plant-based cheese sales fell 10.0%. The split shows that product quality differs sharply by format. Suppliers with better fermentation and texture control can gain value as shoppers move beyond milk-style drinks.
Everyday Kitchen Use Is Creating Product Opportunity
A lucrative opportunity for manufacturers is in products that feel normal in the kitchen. Oat protein and soy protein concentrates can support more complete nutrition claims in beverages and cultured cups. Better ingredient systems help brands reduce watery texture and lower protein gaps. Improved formulation creates room for private-label launches and branded premium products to grow together when the product works in everyday meals.
Analysis of Dairy Alternatives Market by Key Countries
.webp "Top Country Growth Comparison Dairy Alternatives Market Cagr (2026 2036)")
| Country | CAGR |
|---|---|
| United States | 4.5% |
| China | 3.7% |
| India | 7.0% |
| Germany | 9.0% |
| United Kingdom | 5.1% |
| Japan | 6.2% |
| Brazil | 6.4% |
Source: Future Market Insights analysis, 2026.
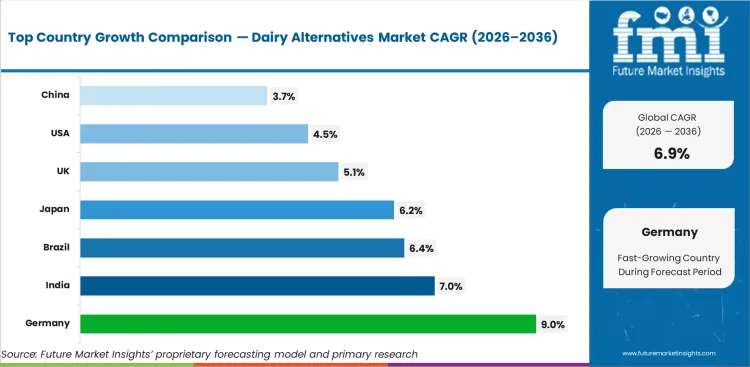
Dairy Alternatives Market CAGR Analysis by Country
- Germany is expected to record 9.0% CAGR through 2036 as private label and plant-based category breadth improve value access.
- India is forecast at 7.0% CAGR through 2036 as vegan logo rules and urban retail expansion improve buyer confidence.
- Brazil is estimated at 6.4% CAGR through 2036 as dairy price pressure and large grocery channels create room for alternatives.
- Japan is estimated at 6.2% CAGR through 2036 as soy beverage habits and convenience retail support repeat plant-based use.
- The United States and United Kingdom remain large mature markets. Value growth depends on repeat buying and price discipline.
Demand for dairy alternatives is forecast to rise at 6.9% CAGR from 2026 to 2036. Country-level analysis covers markets where retail access, food labeling rules, plant-based habits and supplier presence make the category commercially meaningful.
Demand Outlook for Dairy Alternatives Market in the United States
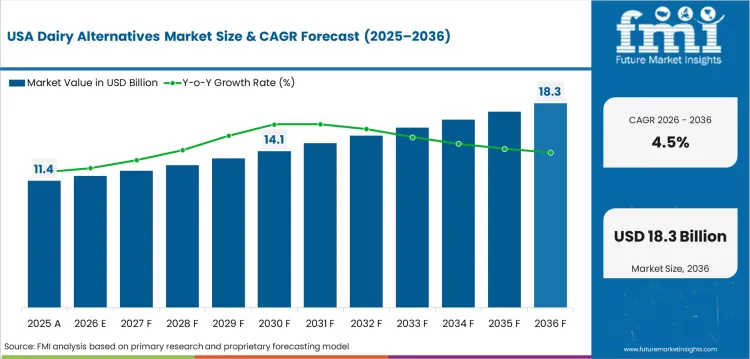
Good Food Institute reported that United States plant-based retail was worth USD 7.9 billion in 2025. Plant-based milk alone reached USD 2.7 billion and held 13.0% of total milk dollar sales. The United States is projected to record 4.5% CAGR through 2036 as mature retail penetration limits speed and protects value.
- California grocery chains keep almond and oat assortments visible in refrigerated and shelf-stable sets.
- New York cafes influence oat and barista blend use since coffee service often drives consumer trial.
- Texas retail growth gives private-label aseptic beverages a lower-cost route into larger households.
Sales Analysis of Dairy Alternatives Market in China
China is expected to expand at 3.7% CAGR through 2036 as soy milk familiarity balances slower adoption of newer dairy alternatives. Urban consumers in Shanghai and Shenzhen can support oat and almond formats where cafes and modern retail explain product use. The category remains selective because soy beverage habits are well established and premium imported products face price tests. Suppliers need local taste fit and smaller pack sizes to improve repeat buying.
- Shanghai premium grocery chains help test oat and almond dairy alternatives with imported and local brands.
- Beijing cafe chains can move oat-based beverages into daily beverage routines for younger consumers.
- Shenzhen e-commerce platforms give imported products a route before full supermarket rollout.
Demand Outlook for Dairy Alternatives Market in India
India is forecast to grow at 7.0% CAGR through 2036 as vegan identification becomes clearer for packaged foods. The Food Safety and Standards Authority of India keeps a vegan logo endorsement process for approved vegan products. Vegan logo approval gives manufacturers a clearer way to separate plant-based products from vegetarian dairy foods.
- Mumbai modern retail stores can build chilled dairy alternative sets near premium health foods.
- Bengaluru cafes support oat milk and almond milk trials among younger urban consumers.
- Delhi NCR online grocery platforms can explain vegan logo endorsement and clean ingredient claims.
Opportunity Analysis of Dairy Alternatives Market in Germany
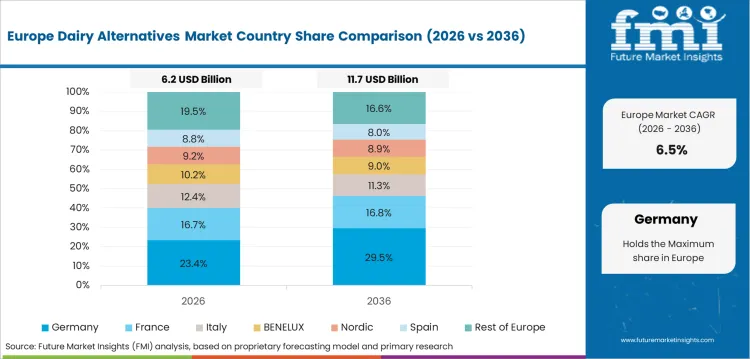
Germany is expected to record 9.0% CAGR through 2036 as retail pricing and private-label scale improve access. Good Food Institute Europe reported EUR 1.68 billion in German retail sales across six plant-based categories in 2024. Volume rose 7.1% from 2023 to 2024 in those categories. Berlin and Munich remain important for plant-based grocery assortment and foodservice testing.
- Berlin grocery chains give private-label plant-based milk and cream stronger shelf exposure.
- Hamburg cafes provide a practical route for oat and barista formats in beverage service.
- Munich organic retailers can support premium soy and almond products with clean-label claims.
Future Outlook for Dairy Alternatives Market in the United Kingdom
The United Kingdom is projected at 5.1% CAGR through 2036 as plant-based milk has broad household reach and faces labeling pressure. Good Food Institute Europe reported GBP 904 million in six United Kingdom plant-based retail categories in 2024. The United Kingdom Supreme Court ruled in February 2026 against Oatly in the Post Milk Generation trademark case. The ruling makes dairy terminology strategy more important for brands selling oat-based foods and drinks.
- London specialty coffee chains keep oat milk visible through barista and ready-to-drink formats.
- Manchester supermarkets can widen private-label dairy alternatives for price-sensitive households.
- Bristol health-led retail stores support plant-based yogurt and cheese tests with stronger product education.
Sales Analysis of Dairy Alternatives Market in Japan
Japan is estimated at 6.2% CAGR through 2036 as soy beverage habits give the market a familiar base. Japan Soymilk Association reported 444,552 kiloliters of soy milk production in 2025. The same release placed prepared soy milk at 204,319 kiloliters. Tokyo and Nagoya are estimated to support premium oat and blended products demand beside established soy drinks.
- Tokyo convenience stores help plant-based beverages reach office workers through smaller packs.
- Osaka supermarkets can place soy and oat beverages beside breakfast and health products.
- Nagoya food manufacturers may use soy and oat bases in dessert-style dairy replacements.
Future Outlook for Dairy Alternatives Market in Brazil
Brazil is estimated at 6.4% CAGR through 2036 as a large dairy base creates room for selective replacement. Brazilian Institute of Geography and Statistics reported 27.51 billion liters of raw milk acquired in 2025. Record dairy output keeps conventional milk highly available. It also gives retailers a large comparison shelf. Sao Paulo and Rio de Janeiro are the main demand nodes for premium plant-based products.
- Sao Paulo premium supermarkets can test almond and oat beverages against established dairy brands.
- Curitiba retailers can position soy beverages for value-focused households and vegan shoppers.
- Rio de Janeiro foodservice outlets can trial plant-based creamers in coffee and dessert menus.
Competitive Landscape and Strategic Positioning
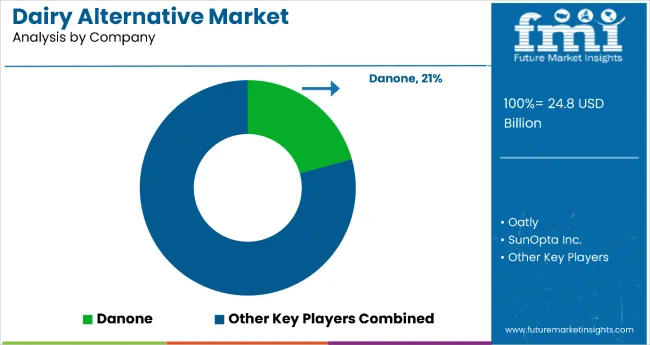
- Brands are focusing on aspects such as sugar level and distribution depth across retail and foodservice.
- Private-label suppliers compete through formulation support and price control.
- Cheese and yogurt specialists compete by improving texture and cultured product body.
- Regulatory pressure creates advantage for companies with clear labels and source-specific product names.
Competition outlook in the sectorhas moved beyond dairy-free positioning. Danone and Oatly shape category direction through broad plant-based portfolios and foodservice visibility. Blue Diamond Growers and Califia Farms compete in almond and plant-based beverage formats. Daiya Foods works in cheese-style products where taste and melt remain harder to solve. Retailers will favor companies that prove repeat buying across more than one format.
Private-label and contract manufacturing carry more weight as retailers push price points lower. SunOpta operates in aseptic plant-based beverage manufacturing and private-label programs. Its new aseptic line in Midlothian, Texas shows capacity moving toward beverage programs that need larger runs. Ingredient suppliers are expected to maintain the edge if they can support protein and clean-label needs while keeping the final price controlled.
Key Companies in the Dairy Alternatives Market
Competition is best read by role because brand ownership, manufacturing scale and formulation depth differ sharply.
- Global Brand Owners: Danone, Oatly Group AB, Blue Diamond Growers and Califia Farms hold market positions through broad retail visibility and category-specific brand recognition.
- Format Specialists: Daiya Foods, Ripple Foods and Forager Project compete through cheese-style, protein-led and cultured formats where product performance decides repeat buying.
- Manufacturing and Ingredient Enablers: SunOpta, Vitasoy and CP Kelco support the market through aseptic beverages, soy product depth and texture systems for dairy alternative formats.
Competitive Benchmarking: Dairy Alternatives Market
| Company | Beverage Base Depth | Texture and Nutrition Fit | Channel Execution | Geographic Footprint |
|---|---|---|---|---|
| Danone | High | Strong | Strong | Global with Alpro depth in Europe and wider plant-based portfolio reach |
| Oatly Group AB | High | Strong | Medium | Global oat-led brand with foodservice and barista positioning |
| Blue Diamond Growers | High | Medium | Strong | North America centered almond supply depth and Almond Breeze brand equity |
| Califia Farms | Medium | Strong | Medium | United States premium plant-based beverages and coffee channel visibility |
| Daiya Foods | Medium | Medium | Strong | North America dairy-free cheese and cream cheese specialization |
| SunOpta | High | Medium | Strong | North America aseptic private-label and beverage manufacturing footprint |
| Vitasoy | Medium | Strong | Medium | Asia Pacific soy beverage depth and plant milk nutrition standards |
| Ripple Foods | Medium | Strong | Medium | United States pea protein milk and nutrition positioning |
| Forager Project | Low | Medium | Strong | United States organic yogurt and cultured dairy-free products |
Source: Future Market Insights competitive analysis, 2026. Ratings reflect relative positioning based on product base depth, texture and nutrition fit, channel execution and geographic footprint.
Key Developments in Dairy Alternatives Market
- In January 2026, Califia Farms launched Simple & Organic Soymilk with 8 grams of protein per serving alongside new creamer flavors.
- In February 2026, Blue Diamond Growers introduced Blue Diamond Almondmilk in four 48-ounce varieties including Chocolate Protein with 8 grams of plant protein.
- In March 2026, Oatly announced a USD 16 million Landskrona investment to raise annual production capacity from 150 million liters to 200 million liters.
Key Players in the Dairy Alternatives Market
Major Global Players:
- Danone
- Oatly Group AB
- Blue Diamond Growers
- Califia Farms
- Daiya Foods
Specialist and Regional Players:
- SunOpta
- Vitasoy International Holdings Limited
- Ripple Foods
- Forager Project
- CP Kelco
Report Scope and Coverage
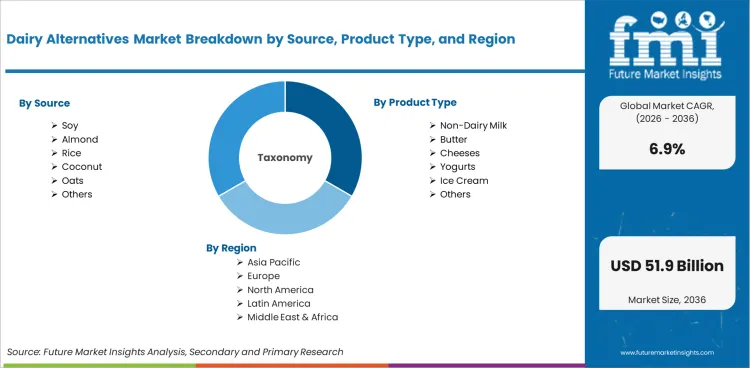
| Parameter | Details |
|---|---|
| Quantitative Units | USD 26.6 billion to USD 51.9 billion, at 6.9% CAGR |
| Market Definition | Plant-derived products sold as substitutes for dairy milk, yogurt, cheese, butter and frozen desserts |
| Source Segmentation | Soy, Almond, Rice, Coconut, Oats, Others |
| Product Type Segmentation | Non-Dairy Milk, Butter, Cheeses, Yogurts, Ice Cream, Others |
| Distribution Channel Segmentation | Supermarkets and Hypermarkets, Convenience Stores, Online Retail, Others |
| Regions Covered | North America, Latin America, Western Europe, Eastern Europe, East Asia, South Asia and Pacific, Middle East and Africa |
| Countries Covered | United States, China, India, Germany, United Kingdom, Japan, Brazil and 40 plus countries |
| Key Companies Profiled | Danone, Oatly, Blue Diamond Growers, Califia Farms, Daiya Foods, SunOpta, Vitasoy, Ripple Foods, Forager Project, CP Kelco |
| Forecast Period | 2026 to 2036 |
| Approach | Hybrid top-down and bottom-up market modeling validated through public category data and company developments |
Source: Future Market Insights, 2026.
Dairy Alternatives Market Breakdown by Source, Product Type, Distribution Channel, and Region
Dairy Alternatives Market Segmented by Source:
- Soy
- Almond
- Rice
- Coconut
- Oats
- Others
Dairy Alternatives Market Segmented by Product Type:
- Non-Dairy Milk
- Butter
- Cheeses
- Yogurts
- Ice Cream
- Others
Dairy Alternatives Market Segmented by Distribution Channel:
- Supermarkets and Hypermarkets
- Convenience Stores
- Online Retail
- Others
Dairy Alternatives Market by Region:
- North America
- United States
- Canada
- Europe
- Germany
- United Kingdom
- France
- Italy
- Spain
- Asia Pacific
- China
- Japan
- South Korea
- Taiwan
- Singapore
- Latin America
- Brazil
- Mexico
- Argentina
- Middle East & Africa
- GCC Countries
- South Africa
- Israel
Research Sources and Bibliography
- Good Food Institute. (2026). Retail sales data: Plant-based retail market overview.
- Good Food Institute Europe. (2025, May). Europe plant-based food retail sales data.
- United States Food and Drug Administration. (2025, January 6). Plant-based alternatives to animal-derived foods.
- United Kingdom Supreme Court. (2026, February 11). Oatly AB v Dairy UK Ltd.
- Japan Soymilk Association. (2026, May). Soymilk production results 2025.
- Food Safety and Standards Authority of India. (2026). Vegan food.
- Brazilian Institute of Geography and Statistics. (2026, March 18). In 2025, Brazil registers the highest production of milk, leather and eggs in history.
- Oatly Group AB. (2026, March 5). Oatly invests USD 16 million in Landskrona facility.
- Oatly Group AB. (2026, May 6). Oatly reports first quarter 2026 financial results.
- Califia Farms. (2026, January 22). Califia Farms expands Simple and Organic portfolio with its first-ever soymilk launch.
- Blue Diamond Growers. (2026, February 13). Blue Diamond Growers introduces new line: Blue Diamond Almondmilk.
- Daiya Foods. (2025, June 23). Daiya expands dairy-free portfolio with Chipotle Cheddar Shreds and Pepper Jack Slices.
- SunOpta Inc. (2025, November). SunOpta announces third quarter fiscal 2025 financial results.
- SunOpta Inc. (2026, February 6). Refresco to acquire SunOpta for USD 6.50 per share in cash.
- Vitasoy International Holdings Limited. (2025, August). Sustainability report 2024/2025.
The bibliography is provided for reader reference and uses Future Market Insights pages, official institutions, industry bodies and company sources relevant to dairy alternatives.
This Report Answers
- What is the current and future size of the dairy alternatives market?
- How fast is the dairy alternatives market expected to expand between 2026 and 2036?
- Which source segment is projected to lead dairy alternatives demand by 2026?
- Which product type is expected to account for the leading share in 2026?
- Why do plant-based milk formats matter more than other dairy alternatives today?
- How do price, taste and nutrition affect repeat buying in dairy alternatives?
- Which countries are projected to record stronger expansion during the forecast period?
- Who are the main companies active in dairy alternatives and adjacent plant-based formats?
- How does FMI define the dairy alternatives market scope?
- How does FMI estimate and validate the dairy alternatives forecast?
Frequently Asked Questions
What is the global market demand for Dairy Alternatives in 2026?
In 2026, the global dairy alternatives market is expected to be worth USD 26.6 billion as milk-style beverages remain the core repeat-use format.
How big will the Dairy Alternatives Market be in 2036?
By 2036, the dairy alternatives market is expected to reach USD 51.9 billion as beverages, cultured products and cheese-style formats expand.
How much is demand for Dairy Alternatives expected to expand between 2026 and 2036?
Demand for dairy alternatives is projected to expand at 6.9% CAGR from 2026 to 2036 based on the stated 2026 and 2036 values.
Which source leads the Dairy Alternatives Market in 2026?
Soy-based products are projected to account for 52.0% share in 2026 since soy offers protein, cost and long consumer familiarity.
Which channel leads the Dairy Alternatives Market in 2026?
Supermarkets and hypermarkets are expected to hold 35.0% share in 2026 as shelf placement and chilled visibility support repeat buying.
Why is plant-based milk central to the Dairy Alternatives Market?
Plant-based milk is central because shoppers use it frequently in coffee, cereal and cooking. That repeat use protects category value.
What slows wider Dairy Alternatives adoption?
Price gaps and weak protein content slow repeat buying when shoppers compare plant-based products with dairy alternatives.
How do suppliers win in the Dairy Alternatives Market?
Suppliers win by proving taste and nutrition fit across daily-use formats. Strong channel access then turns trial into repeat purchase.
Are dairy alternatives the same as lactose-free dairy products?
Dairy alternatives are plant-derived products without animal milk. Lactose-free dairy products are still made from animal milk with lactose removed.
How long can shelf-stable dairy alternatives last?
Shelf-stable dairy alternatives can last several months before opening when aseptic packaging is used. Final shelf life depends on formulation and pack design.
Which dairy alternative is most suitable for coffee?
Oat milk is often preferred for coffee because barista blends foam well and offer a neutral taste. Soy and almond remain common options.
Do dairy alternatives cost more than dairy products?
Many dairy alternatives still cost more than dairy products. Private label and larger aseptic production can reduce the gap over time.
Preview the report firsthand - request a free sample
Get SampleGet the brochure for pricing and purchase details.
Get PDFTable of Content
- Executive Summary
- Global Market Outlook
- Demand-side Trends
- Supply-side Trends
- Technology Roadmap Analysis
- Analysis and Recommendations
- Market Overview
- Market Coverage / Taxonomy
- Market Definition / Scope / Limitations
- Research Methodology
- Chapter Orientation
- Analytical Lens and Working Hypotheses
- Market Structure, Signals, and Trend Drivers
- Benchmarking and Cross-market Comparability
- Market Sizing, Forecasting, and Opportunity Mapping
- Research Design and Evidence Framework
- Desk Research Programme (Secondary Evidence)
- Company Annual and Sustainability Reports
- Peer-reviewed Journals and Academic Literature
- Corporate Websites, Product Literature, and Technical Notes
- Earnings Decks and Investor Briefings
- Statutory Filings and Regulatory Disclosures
- Technical White Papers and Standards Notes
- Trade Journals, Industry Magazines, and Analyst Briefs
- Conference Proceedings, Webinars, and Seminar Materials
- Government Statistics Portals and Public Data Releases
- Press Releases and Reputable Media Coverage
- Specialist Newsletters and Curated Briefings
- Sector Databases and Reference Repositories
- FMI Internal Proprietary Databases and Historical Market Datasets
- Subscription Datasets and Paid Sources
- Social Channels, Communities, and Digital Listening Inputs
- Additional Desk Sources
- Expert Input and Fieldwork (Primary Evidence)
- Primary Modes
- Qualitative Interviews and Expert Elicitation
- Quantitative Surveys and Structured Data Capture
- Blended Approach
- Why Primary Evidence is Used
- Field Techniques
- Interviews
- Surveys
- Focus Groups
- Observational and In-context Research
- Social and Community Interactions
- Stakeholder Universe Engaged
- C-suite Leaders
- Board Members
- Presidents and Vice Presidents
- R&D and Innovation Heads
- Technical Specialists
- Domain Subject-matter Experts
- Scientists
- Physicians and Other Healthcare Professionals
- Governance, Ethics, and Data Stewardship
- Research Ethics
- Data Integrity and Handling
- Primary Modes
- Tooling, Models, and Reference Databases
- Desk Research Programme (Secondary Evidence)
- Data Engineering and Model Build
- Data Acquisition and Ingestion
- Cleaning, Normalisation, and Verification
- Synthesis, Triangulation, and Analysis
- Quality Assurance and Audit Trail
- Market Background
- Market Dynamics
- Drivers
- Restraints
- Opportunity
- Trends
- Scenario Forecast
- Demand in Optimistic Scenario
- Demand in Likely Scenario
- Demand in Conservative Scenario
- Opportunity Map Analysis
- Product Life Cycle Analysis
- Supply Chain Analysis
- Investment Feasibility Matrix
- Value Chain Analysis
- PESTLE and Porter’s Analysis
- Regulatory Landscape
- Regional Parent Market Outlook
- Production and Consumption Statistics
- Import and Export Statistics
- Market Dynamics
- Global Market Analysis 2021 to 2025 and Forecast, 2026 to 2036
- Historical Market Size Value (USD Million) Analysis, 2021 to 2025
- Current and Future Market Size Value (USD Million) Projections, 2026 to 2036
- Y-o-Y Growth Trend Analysis
- Absolute $ Opportunity Analysis
- Global Market Pricing Analysis 2021 to 2025 and Forecast 2026 to 2036
- Global Market Analysis 2021 to 2025 and Forecast 2026 to 2036, By Product Type
- Introduction / Key Findings
- Historical Market Size Value (USD Million) Analysis By Product Type , 2021 to 2025
- Current and Future Market Size Value (USD Million) Analysis and Forecast By Product Type , 2026 to 2036
- Upgrade bearing kits
- Electrical pitting bearings
- Coupling service kits
- Seal and mount kits
- Upgrade bearing kits
- Y-o-Y Growth Trend Analysis By Product Type , 2021 to 2025
- Absolute $ Opportunity Analysis By Product Type , 2026 to 2036
- Global Market Analysis 2021 to 2025 and Forecast 2026 to 2036, By Upgrade Area
- Introduction / Key Findings
- Historical Market Size Value (USD Million) Analysis By Upgrade Area, 2021 to 2025
- Current and Future Market Size Value (USD Million) Analysis and Forecast By Upgrade Area, 2026 to 2036
- E-axle motor modules
- Reduction gearsets
- AWD couplings
- Hybrid driveline modules
- E-axle motor modules
- Y-o-Y Growth Trend Analysis By Upgrade Area, 2021 to 2025
- Absolute $ Opportunity Analysis By Upgrade Area, 2026 to 2036
- Global Market Analysis 2021 to 2025 and Forecast 2026 to 2036, By Vehicle Type
- Introduction / Key Findings
- Historical Market Size Value (USD Million) Analysis By Vehicle Type, 2021 to 2025
- Current and Future Market Size Value (USD Million) Analysis and Forecast By Vehicle Type, 2026 to 2036
- Passenger EVs
- Plug-in hybrids
- Electric SUVs
- Electric vans
- Passenger EVs
- Y-o-Y Growth Trend Analysis By Vehicle Type, 2021 to 2025
- Absolute $ Opportunity Analysis By Vehicle Type, 2026 to 2036
- Global Market Analysis 2021 to 2025 and Forecast 2026 to 2036, By Sales Channel
- Introduction / Key Findings
- Historical Market Size Value (USD Million) Analysis By Sales Channel, 2021 to 2025
- Current and Future Market Size Value (USD Million) Analysis and Forecast By Sales Channel, 2026 to 2036
- OEM-authorized service kits
- Independent workshops
- Parts distributors
- Fleet service programs
- OEM-authorized service kits
- Y-o-Y Growth Trend Analysis By Sales Channel, 2021 to 2025
- Absolute $ Opportunity Analysis By Sales Channel, 2026 to 2036
- Global Market Analysis 2021 to 2025 and Forecast 2026 to 2036, By Repair Type
- Introduction / Key Findings
- Historical Market Size Value (USD Million) Analysis By Repair Type, 2021 to 2025
- Current and Future Market Size Value (USD Million) Analysis and Forecast By Repair Type, 2026 to 2036
- Fault-specific upgrades
- Preventive replacement
- Performance upgrades
- Warranty repairs
- Fault-specific upgrades
- Y-o-Y Growth Trend Analysis By Repair Type, 2021 to 2025
- Absolute $ Opportunity Analysis By Repair Type, 2026 to 2036
- Global Market Analysis 2021 to 2025 and Forecast 2026 to 2036, By Region
- Introduction
- Historical Market Size Value (USD Million) Analysis By Region, 2021 to 2025
- Current Market Size Value (USD Million) Analysis and Forecast By Region, 2026 to 2036
- North America
- Latin America
- Western Europe
- Eastern Europe
- East Asia
- South Asia and Pacific
- Middle East & Africa
- Market Attractiveness Analysis By Region
- North America Market Analysis 2021 to 2025 and Forecast 2026 to 2036, By Country
- Historical Market Size Value (USD Million) Trend Analysis By Market Taxonomy, 2021 to 2025
- Market Size Value (USD Million) Forecast By Market Taxonomy, 2026 to 2036
- By Country
- USA
- Canada
- Mexico
- By Product Type
- By Upgrade Area
- By Vehicle Type
- By Sales Channel
- By Repair Type
- By Country
- Market Attractiveness Analysis
- By Country
- By Product Type
- By Upgrade Area
- By Vehicle Type
- By Sales Channel
- By Repair Type
- Key Takeaways
- Latin America Market Analysis 2021 to 2025 and Forecast 2026 to 2036, By Country
- Historical Market Size Value (USD Million) Trend Analysis By Market Taxonomy, 2021 to 2025
- Market Size Value (USD Million) Forecast By Market Taxonomy, 2026 to 2036
- By Country
- Brazil
- Chile
- Rest of Latin America
- By Product Type
- By Upgrade Area
- By Vehicle Type
- By Sales Channel
- By Repair Type
- By Country
- Market Attractiveness Analysis
- By Country
- By Product Type
- By Upgrade Area
- By Vehicle Type
- By Sales Channel
- By Repair Type
- Key Takeaways
- Western Europe Market Analysis 2021 to 2025 and Forecast 2026 to 2036, By Country
- Historical Market Size Value (USD Million) Trend Analysis By Market Taxonomy, 2021 to 2025
- Market Size Value (USD Million) Forecast By Market Taxonomy, 2026 to 2036
- By Country
- Germany
- UK
- Italy
- Spain
- France
- Nordic
- BENELUX
- Rest of Western Europe
- By Product Type
- By Upgrade Area
- By Vehicle Type
- By Sales Channel
- By Repair Type
- By Country
- Market Attractiveness Analysis
- By Country
- By Product Type
- By Upgrade Area
- By Vehicle Type
- By Sales Channel
- By Repair Type
- Key Takeaways
- Eastern Europe Market Analysis 2021 to 2025 and Forecast 2026 to 2036, By Country
- Historical Market Size Value (USD Million) Trend Analysis By Market Taxonomy, 2021 to 2025
- Market Size Value (USD Million) Forecast By Market Taxonomy, 2026 to 2036
- By Country
- Russia
- Poland
- Hungary
- Balkan & Baltic
- Rest of Eastern Europe
- By Product Type
- By Upgrade Area
- By Vehicle Type
- By Sales Channel
- By Repair Type
- By Country
- Market Attractiveness Analysis
- By Country
- By Product Type
- By Upgrade Area
- By Vehicle Type
- By Sales Channel
- By Repair Type
- Key Takeaways
- East Asia Market Analysis 2021 to 2025 and Forecast 2026 to 2036, By Country
- Historical Market Size Value (USD Million) Trend Analysis By Market Taxonomy, 2021 to 2025
- Market Size Value (USD Million) Forecast By Market Taxonomy, 2026 to 2036
- By Country
- China
- Japan
- South Korea
- By Product Type
- By Upgrade Area
- By Vehicle Type
- By Sales Channel
- By Repair Type
- By Country
- Market Attractiveness Analysis
- By Country
- By Product Type
- By Upgrade Area
- By Vehicle Type
- By Sales Channel
- By Repair Type
- Key Takeaways
- South Asia and Pacific Market Analysis 2021 to 2025 and Forecast 2026 to 2036, By Country
- Historical Market Size Value (USD Million) Trend Analysis By Market Taxonomy, 2021 to 2025
- Market Size Value (USD Million) Forecast By Market Taxonomy, 2026 to 2036
- By Country
- India
- ASEAN
- Australia & New Zealand
- Rest of South Asia and Pacific
- By Product Type
- By Upgrade Area
- By Vehicle Type
- By Sales Channel
- By Repair Type
- By Country
- Market Attractiveness Analysis
- By Country
- By Product Type
- By Upgrade Area
- By Vehicle Type
- By Sales Channel
- By Repair Type
- Key Takeaways
- Middle East & Africa Market Analysis 2021 to 2025 and Forecast 2026 to 2036, By Country
- Historical Market Size Value (USD Million) Trend Analysis By Market Taxonomy, 2021 to 2025
- Market Size Value (USD Million) Forecast By Market Taxonomy, 2026 to 2036
- By Country
- Kingdom of Saudi Arabia
- Other GCC Countries
- Turkiye
- South Africa
- Other African Union
- Rest of Middle East & Africa
- By Product Type
- By Upgrade Area
- By Vehicle Type
- By Sales Channel
- By Repair Type
- By Country
- Market Attractiveness Analysis
- By Country
- By Product Type
- By Upgrade Area
- By Vehicle Type
- By Sales Channel
- By Repair Type
- Key Takeaways
- Key Countries Market Analysis
- USA
- Pricing Analysis
- Market Share Analysis, 2025
- By Product Type
- By Upgrade Area
- By Vehicle Type
- By Sales Channel
- By Repair Type
- Canada
- Pricing Analysis
- Market Share Analysis, 2025
- By Product Type
- By Upgrade Area
- By Vehicle Type
- By Sales Channel
- By Repair Type
- Mexico
- Pricing Analysis
- Market Share Analysis, 2025
- By Product Type
- By Upgrade Area
- By Vehicle Type
- By Sales Channel
- By Repair Type
- Brazil
- Pricing Analysis
- Market Share Analysis, 2025
- By Product Type
- By Upgrade Area
- By Vehicle Type
- By Sales Channel
- By Repair Type
- Chile
- Pricing Analysis
- Market Share Analysis, 2025
- By Product Type
- By Upgrade Area
- By Vehicle Type
- By Sales Channel
- By Repair Type
- Germany
- Pricing Analysis
- Market Share Analysis, 2025
- By Product Type
- By Upgrade Area
- By Vehicle Type
- By Sales Channel
- By Repair Type
- UK
- Pricing Analysis
- Market Share Analysis, 2025
- By Product Type
- By Upgrade Area
- By Vehicle Type
- By Sales Channel
- By Repair Type
- Italy
- Pricing Analysis
- Market Share Analysis, 2025
- By Product Type
- By Upgrade Area
- By Vehicle Type
- By Sales Channel
- By Repair Type
- Spain
- Pricing Analysis
- Market Share Analysis, 2025
- By Product Type
- By Upgrade Area
- By Vehicle Type
- By Sales Channel
- By Repair Type
- France
- Pricing Analysis
- Market Share Analysis, 2025
- By Product Type
- By Upgrade Area
- By Vehicle Type
- By Sales Channel
- By Repair Type
- India
- Pricing Analysis
- Market Share Analysis, 2025
- By Product Type
- By Upgrade Area
- By Vehicle Type
- By Sales Channel
- By Repair Type
- ASEAN
- Pricing Analysis
- Market Share Analysis, 2025
- By Product Type
- By Upgrade Area
- By Vehicle Type
- By Sales Channel
- By Repair Type
- Australia & New Zealand
- Pricing Analysis
- Market Share Analysis, 2025
- By Product Type
- By Upgrade Area
- By Vehicle Type
- By Sales Channel
- By Repair Type
- China
- Pricing Analysis
- Market Share Analysis, 2025
- By Product Type
- By Upgrade Area
- By Vehicle Type
- By Sales Channel
- By Repair Type
- Japan
- Pricing Analysis
- Market Share Analysis, 2025
- By Product Type
- By Upgrade Area
- By Vehicle Type
- By Sales Channel
- By Repair Type
- South Korea
- Pricing Analysis
- Market Share Analysis, 2025
- By Product Type
- By Upgrade Area
- By Vehicle Type
- By Sales Channel
- By Repair Type
- Russia
- Pricing Analysis
- Market Share Analysis, 2025
- By Product Type
- By Upgrade Area
- By Vehicle Type
- By Sales Channel
- By Repair Type
- Poland
- Pricing Analysis
- Market Share Analysis, 2025
- By Product Type
- By Upgrade Area
- By Vehicle Type
- By Sales Channel
- By Repair Type
- Hungary
- Pricing Analysis
- Market Share Analysis, 2025
- By Product Type
- By Upgrade Area
- By Vehicle Type
- By Sales Channel
- By Repair Type
- Kingdom of Saudi Arabia
- Pricing Analysis
- Market Share Analysis, 2025
- By Product Type
- By Upgrade Area
- By Vehicle Type
- By Sales Channel
- By Repair Type
- Turkiye
- Pricing Analysis
- Market Share Analysis, 2025
- By Product Type
- By Upgrade Area
- By Vehicle Type
- By Sales Channel
- By Repair Type
- South Africa
- Pricing Analysis
- Market Share Analysis, 2025
- By Product Type
- By Upgrade Area
- By Vehicle Type
- By Sales Channel
- By Repair Type
- USA
- Market Structure Analysis
- Competition Dashboard
- Competition Benchmarking
- Market Share Analysis of Top Players
- By Regional
- By Product Type
- By Upgrade Area
- By Vehicle Type
- By Sales Channel
- By Repair Type
- Competition Analysis
- Competition Deep Dive
- Schaeffler AG
- Overview
- Product Portfolio
- Profitability by Market Segments (Product/Age /Sales Channel/Region)
- Sales Footprint
- Strategy Overview
- Marketing Strategy
- Product Strategy
- Channel Strategy
- NTN Corporation
- NSK Ltd.
- SKF Group
- JTEKT Corporation
- BorgWarner Inc.
- ZF Friedrichshafen AG
- Schaeffler AG
- Competition Deep Dive
- Assumptions & Acronyms Used


