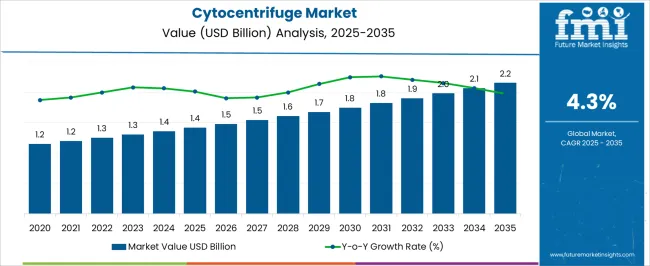
The Cytocentrifuge Market is estimated to be valued at USD 1.4 billion in 2025 and is projected to reach USD 2.2 billion by 2035, registering a compound annual growth rate (CAGR) of 4.3% over the forecast period.
| Metric | Value |
|---|---|
| Cytocentrifuge Market Estimated Value in (2025 E) | USD 1.4 billion |
| Cytocentrifuge Market Forecast Value in (2035 F) | USD 2.2 billion |
| Forecast CAGR (2025 to 2035) | 4.3% |
The Cytocentrifuge market is witnessing steady growth, driven by the increasing demand for efficient sample preparation technologies in clinical and research laboratories. Rising prevalence of diseases requiring cytological analysis, coupled with growing investments in healthcare infrastructure, is supporting the adoption of cytocentrifuges. Technological advancements in high-speed centrifugation, improved rotor designs, and automated sample handling are enhancing accuracy and throughput while minimizing sample loss.
The growing focus on precision diagnostics, rapid testing, and laboratory workflow optimization is further propelling market growth. Integration of cytocentrifuges with laboratory information management systems enables streamlined data capture and improved operational efficiency. Additionally, regulatory emphasis on standardized laboratory procedures and quality control is reinforcing the need for reliable cytocentrifuge systems.
As diagnostic laboratories and research institutions prioritize rapid, high-quality sample preparation for cytology and other cellular analysis applications, the market is expected to experience sustained growth Continuous innovations in centrifugation speed, capacity, and user-friendly interfaces are anticipated to drive adoption and expand application potential across various laboratory settings.
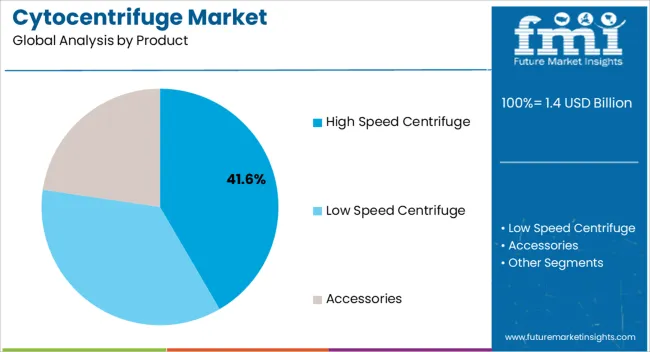
The high-speed centrifuge segment is projected to hold 41.6% of the market revenue in 2025, establishing it as the leading product type. Growth in this segment is being driven by the need for rapid, high-precision sample separation in clinical, research, and diagnostic laboratories. High-speed centrifuges enable efficient concentration of cellular components, ensuring accurate cytological analysis while reducing processing time and labor.
Advanced rotor designs, variable speed control, and automated features enhance usability and reproducibility, which strengthens their preference among laboratory professionals. The ability to process multiple samples simultaneously without compromising quality provides significant operational efficiency. Continuous innovations in vibration reduction, noise control, and safety mechanisms are further enhancing adoption.
As laboratories increasingly focus on optimizing workflow efficiency, minimizing sample loss, and improving diagnostic accuracy, high-speed centrifuges are expected to maintain their leadership in the market Their combination of performance, reliability, and scalability ensures strong market positioning and continued preference among end users.
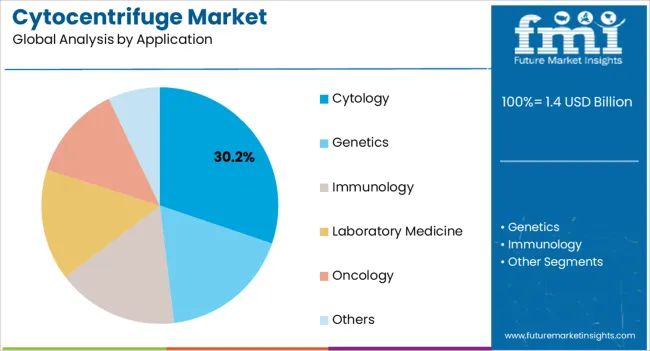
The cytology application segment is anticipated to account for 30.2% of the market revenue in 2025, making it the leading application area. Growth is being driven by the increasing demand for cellular analysis in cancer detection, infectious disease monitoring, and routine diagnostic testing. Cytocentrifuges enable precise concentration and preservation of cells from body fluids, which enhances diagnostic accuracy and supports early disease detection.
The ability to integrate cytology sample preparation with automated staining and imaging workflows improves laboratory efficiency and reduces turnaround time. Rising awareness of preventive healthcare, growing demand for non-invasive diagnostic techniques, and the emphasis on quality control are further supporting adoption.
Regulatory guidelines for cytology testing and the requirement for standardized sample preparation procedures reinforce the importance of cytocentrifuge utilization As diagnostic laboratories and research facilities expand their cytological testing capabilities, the cytology segment is expected to remain a primary driver of market growth, underpinned by technological advancements and increasing clinical demand.
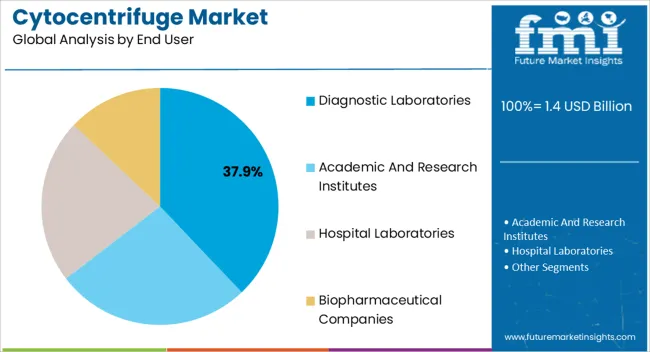
The diagnostic laboratories segment is expected to hold 37.9% of the market revenue in 2025, positioning it as the leading end-user category. Growth is being driven by the increasing need for reliable, high-throughput sample processing solutions to support accurate and timely disease diagnosis. Cytocentrifuges are extensively adopted in diagnostic laboratories for sample preparation in cytology, hematology, and other cellular analyses.
The ability to handle diverse sample types, reduce processing errors, and improve reproducibility has strengthened their preference among laboratory professionals. Rising investments in laboratory infrastructure, automation, and workflow optimization are further accelerating adoption. Regulatory requirements for standardized procedures, quality control, and compliance with healthcare standards also drive reliance on cytocentrifuges in diagnostic laboratories.
As demand for rapid, precise, and scalable diagnostic solutions grows, the diagnostic laboratories segment is expected to remain the primary end user, contributing significantly to market revenue The combination of efficiency, reliability, and accuracy ensures sustained market dominance for cytocentrifuge systems in this segment.
From 2012 to 2025, the global cytocentrifuge market experienced a CAGR of 3.4%, reaching a market size of USD 1.4 billion in 2025.
From 2012 to 2025, the global cytocentrifuge market industry witnessed steady growth due to utilization in diagnostic laboratories for various applications, such as the examination of body fluids, including cerebrospinal fluid, urine, pleural fluid, and synovial fluid.
They enable the concentration of cells onto microscope slides, facilitating cytological analysis and aiding in the diagnosis of diseases such as cancer, infections, and autoimmune disorders. The increasing prevalence of these conditions has contributed to the growth of the cytocentrifuge market.
Future Forecast for Cytocentrifuge Market Industry:
Looking ahead, the global cytocentrifuge market industry is expected to rise at a CAGR of 4.5% from 2025 to 2035. During the forecast period, the market size is expected to reach USD 2.2 billion by 2035.
The cytocentrifuge market industry is expected to continue its growth trajectory from 2025 to 2035, driven by increasing technological advancements and integration of AI. Partnerships and collaborations can accelerate the development and commercialization of advanced cytocentrifuge devices and expand market opportunities.
The market is likely to see the development of specialized cytocentrifuge systems tailored to specific applications. These may include systems designed for specific cell types, such as circulating tumor cells or stem cells, or for niche research areas such as regenerative medicine.
Specialized cytocentrifuges can provide optimized protocols and capabilities to meet the unique requirements of these applications.
| Country | The United States |
|---|---|
| Market Size (USD million) by End of Forecast Period (2035) | USD 2.2 million |
| CAGR % 2025 to End of Forecast (2035) | 3.7% |
The cytocentrifuge industry in the United States is expected to reach a market size of USD 2.2 million by 2035, expanding at a CAGR of 3.7%. The United States has seen a significant rise in the adoption of molecular diagnostics, including the use of cytocentrifuges in sample preparation for molecular testing. Cytocentrifuges play a crucial role in isolating and concentrating cells for DNA, RNA, and protein analysis. As molecular diagnostics continue to expand in areas such as oncology, infectious diseases, and genetic testing, the demand for cytocentrifuges is expected to grow.
| Country | The United Kingdom |
|---|---|
| Market Size (USD million) by End of Forecast Period (2035) | USD 54.5 million |
| CAGR % 2025 to End of Forecast (2035) | 3.8% |
The cytocentrifuge industry in the United Kingdom is expected to reach a market share of USD 54.5 million, expanding at a CAGR of 3.8% during the forecast period. The United Kingdom has a strong research & development ecosystem in the life sciences sector. Academic institutions, research organizations, and biotech companies actively engage in cutting-edge research.
This emphasis on research & development drives innovation in cytocentrifugation techniques, sample preparation methods, and integration with other technologies. Collaborations between industry and academia contribute to the development of advanced cytocentrifuge solutions.
| Country | China |
|---|---|
| Market Size (USD million) by End of Forecast Period (2035) | USD 197.2 million |
| CAGR % 2025 to End of Forecast (2035) | 6.4% |
The cytocentrifuge industry in China is anticipated to reach a market size of USD 197.2 million, moving at a CAGR of 6.4% during the forecast period. China has been experiencing significant growth in the biotechnology and life sciences sectors.
The government has been actively promoting investments in research and development, resulting in a thriving biotech industry. This growth creates opportunities for cytocentrifuge manufacturers to cater to the increasing demand for advanced cell analysis and sample preparation technologies.
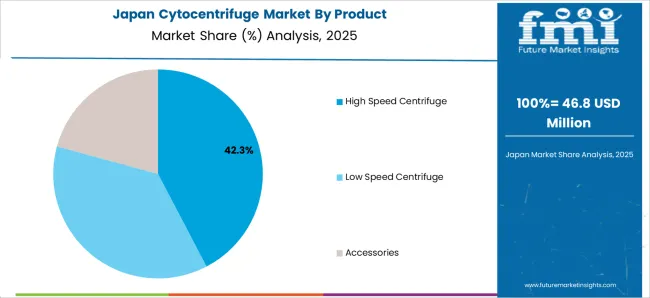
| Country | Japan |
|---|---|
| Market Size (USD million) by End of Forecast Period (2035) | USD 146.4 million |
| CAGR % 2025 to End of Forecast (2035) | 6.2% |
The cytocentrifuge industry in Japan is estimated to reach a market size of USD 146.4 million by 2035, thriving at a CAGR of 6.2%. Japan has a well-developed healthcare infrastructure with a focus on advanced technologies and high-quality healthcare delivery. This emphasis on advanced healthcare creates opportunities for cytocentrifuge manufacturers to provide innovative and technologically advanced systems that can contribute to accurate cell analysis and diagnostics.
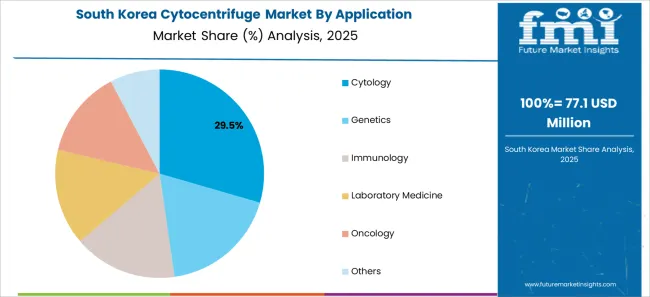
| Country | South Korea |
|---|---|
| Market Size (USD million) by End of Forecast Period (2035) | USD 110.2 million |
| CAGR % 2025 to End of Forecast (2035) | 6.0% |
The cytocentrifuge industry in South Korea is expected to reach a market size of USD 110.2 million, expanding at a CAGR of 6.0% during the forecast period. South Korea has witnessed significant growth in the biopharmaceutical industry, with a focus on the development of biologics and biosimilar.
Cytocentrifuges are essential for cell-based research, bioprocessing, and quality control in the biopharmaceutical sector. The trend towards biopharmaceuticals presents opportunities for cytocentrifuge manufacturers to cater to the unique needs of this growing industry.
Accessories will dominate the cytocentrifuge industry with a CAGR of 4.8% from 2025 to 2035. This segment captures a significant market share in 2025 as it plays a crucial role in the cytocentrifuge market as they enhance the functionality, efficiency, and performance of the cytocentrifuge systems.
Properly designed accessories help to maintain the accuracy and reproducibility of cytocentrifuge results. Rotor adapters and sample chambers/slides ensure consistent positioning of samples in the centrifuge rotor, which is critical for obtaining reliable and reproducible cytological preparations. By providing a stable and secure environment for the samples, accessories help to minimize variability and ensure consistent performance.
Cytology will dominate the cytocentrifuge industry with a CAGR of 4.6% from 2025 to 2035. This segment captures a significant market share in 2025 as it helps in management of sample preparation, cell preservation, diagnostic accuracy & generates rapid results.
Cytocentrifugation offers a relatively quick sample preparation method compared to other techniques used in cytology. The centrifugation process is generally faster, allowing cytologists to obtain results more quickly. This is especially important for urgent or time-sensitive cases, enabling prompt diagnosis and treatment decisions.
Academic & research institutes will dominate the cytocentrifuge industry with a CAGR of 4.9% from 2025 to 2035. Academic and research institutes are at the forefront of scientific research and development. They actively contribute to the advancement of cytocentrifuge technology, methodologies, and applications. These institutions conduct studies to improve cytocentrifuge performance, optimize sample preparation techniques, and explore new applications in various fields such as pathology, cytology, molecular biology, and cell biology.
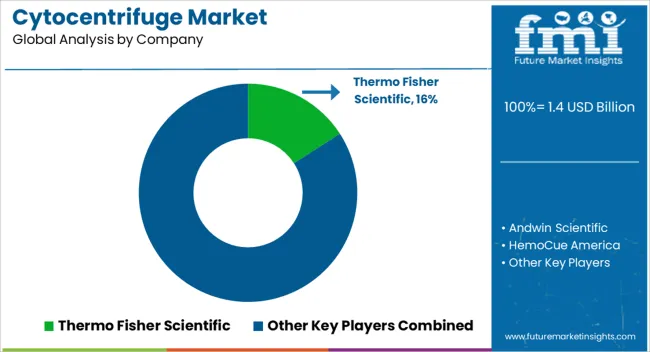
The cytocentrifuge market is fiercely competitive, with many companies fighting for market dominance. To stay ahead of the competition in such a circumstance, essential players must develop effective conjugates.
Key Strategies Used by the Participants
Product Development
Companies invest heavily in research & development to deliver product that improve efficiency, dependability, and cost-effectiveness. Product innovation allows businesses to differentiate themselves from their competition while also catering to the changing demands of their clients.
Strategic Alliances & Collaborations
Key industry leaders frequently develop strategic partnerships and collaborations with other companies in order to harness their strengths and increase their market reach. Companies might also gain access to new technology and markets through such agreements.
Expansion into Emerging Markets
The cytocentrifuge market is expanding rapidly in emerging regions such as China and India. Key firms are enhancing their distribution networks and developing local manufacturing facilities to increase their presence in these areas.
Acquisitions and mergers
Mergers and acquisitions are frequently used by key players in the cytocentrifuge industry to consolidate their market position, extend their product range, and gain access to new markets.
Key Developments in the Cytocentrifuge Market:
The global cytocentrifuge market is estimated to be valued at USD 1.4 billion in 2025.
The market size for the cytocentrifuge market is projected to reach USD 2.2 billion by 2035.
The cytocentrifuge market is expected to grow at a 4.3% CAGR between 2025 and 2035.
The key product types in cytocentrifuge market are high speed centrifuge, low speed centrifuge and accessories.
In terms of application, cytology segment to command 30.2% share in the cytocentrifuge market in 2025.


Full Research Suite comprises of:
Market outlook & trends analysis
Interviews & case studies
Strategic recommendations
Vendor profiles & capabilities analysis
5-year forecasts
8 regions and 60+ country-level data splits
Market segment data splits
12 months of continuous data updates
DELIVERED AS:
PDF EXCEL ONLINE

Thank you!
You will receive an email from our Business Development Manager. Please be sure to check your SPAM/JUNK folder too.
Chat With
MaRIA