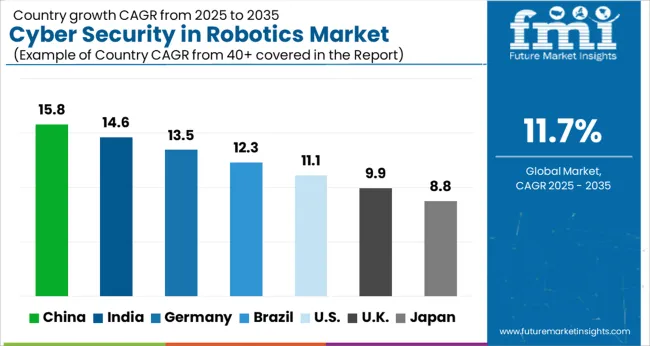
The Cyber Security in Robotics Market is estimated to be valued at USD 4.7 billion in 2025 and is projected to reach USD 14.3 billion by 2035, registering a compound annual growth rate (CAGR) of 11.7% over the forecast period.
| Metric | Value |
|---|---|
| Cyber Security in Robotics Market Estimated Value in (2025 E) | USD 4.7 billion |
| Cyber Security in Robotics Market Forecast Value in (2035 F) | USD 14.3 billion |
| Forecast CAGR (2025 to 2035) | 11.7% |
The cyber security in robotics market is expanding steadily as industrial automation and robotics adoption accelerate across manufacturing, healthcare, defense, and logistics. Rising concerns over cyber threats targeting connected robotic systems have driven demand for advanced security frameworks that safeguard operational continuity and data integrity.
Increasing deployment of cloud connected robots and AI enabled robotics platforms has elevated exposure to vulnerabilities, making robust security solutions a strategic priority. Regulatory compliance standards and industry wide emphasis on securing critical infrastructure are further shaping investment in cyber security frameworks.
The outlook remains positive with continued focus on developing specialized tools and services that address evolving risks in both industrial and collaborative robotic environments, ensuring reliability, resilience, and trust in robotic ecosystems.
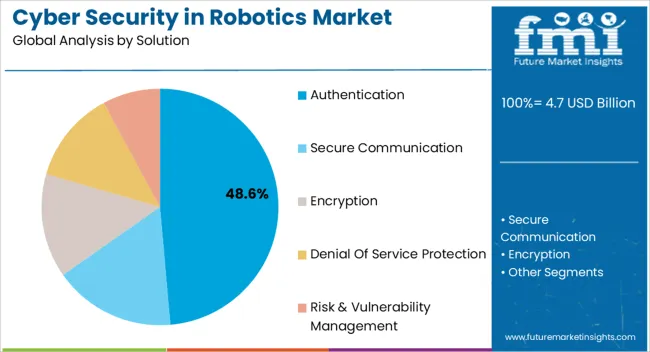
The authentication solution segment is projected to hold 48.60% of the market by 2025, establishing it as the leading solution type. Growth is attributed to the critical need for identity verification and access control within robotic systems to prevent unauthorized usage and tampering.
Authentication mechanisms such as biometric verification, multi factor systems, and digital certificates enhance overall system integrity while reducing susceptibility to cyber attacks. With rising integration of robots into cloud networks and enterprise workflows, strong authentication practices have become foundational in ensuring data security and safeguarding operations.
As robotics expand into safety critical industries, the demand for robust authentication solutions continues to rise, driving its dominance within the solution category.
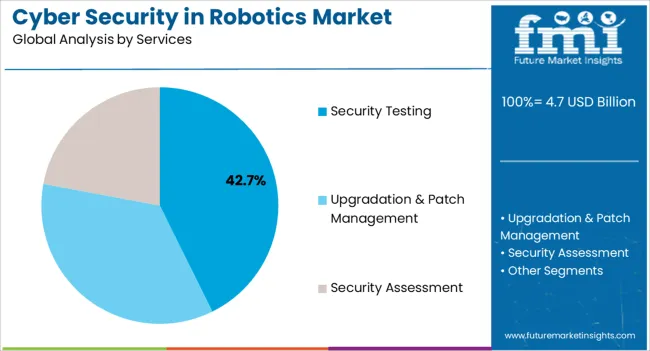
The security testing type segment accounts for 42.70% of the market, making it the most prominent within its category. This dominance is supported by the increasing recognition of preemptive threat identification and vulnerability assessment in robotic ecosystems.
Security testing enables organizations to identify weaknesses in robotic software, hardware, and communication channels before exploitation occurs. Its adoption is reinforced by compliance requirements and industry standards that mandate regular penetration testing and risk assessments.
As cyber threats evolve in sophistication, the ability to validate resilience through ongoing testing has become indispensable. This has positioned security testing as a critical investment area, sustaining its leadership within the type category.
According to FMI analysis, the market recorded a valuation of USD 4.7 billion in 2025 from USD 2.7 billion in 2020. The market is likely to be worth USD 14.3 billion by 2035.
Short-term Growth (2025 to 2029): These attacks often result in the loss of human safety, data, and revenue. To counter this, the demand for innovative cybersecurity management services is anticipated to surge at a fast pace.
With these wide ranges of applications, the market is expected to hold USD 4.7 billion in 2025 while it is likely to reach USD 7.40 billion by 2029.
Mid-term Growth (2029 to 2035): The demand is rising for automation and robotics in healthcare, food and beverages, mining, and other space exploration programs. Furthermore, the systems saving confidential data are pushing companies to adopt cyber security solutions for robotics.
The market will reach USD 14.3 billion in 2035 from USD 7.40 billion, which was the valuation of the market in 2029.
Long-term Growth (2035 to 2035): Lastly, many defense systems are applying robots and autonomous systems for engineering and safety. These robotic systems can be misused if their control gets into the wrong hands.
Thus, the government and military entities are also deploying cyber security solutions in the systems. The market is anticipated to thrive at a slightly lower CAGR of 14.3% between 2025 and 2035.
Rise of the automation in the industrial sector is growing the cybersecurity in robotics market. On the other hand, the increased use of AI, ML and big data is also supporting the market growth.
Meanwhile, industries including security, space exploration, entertainment and healthcare are also fueling the market demand. Furthermore, industrial applications like manufacturing, food preparation, military, and customer services.
The higher financial and data theft threats through cyber-attacks are pushing the verticals including cyber security solutions for robotics and autonomous systems.
These solutions enable quick detection and response to threats, protecting the company from irreversible damage. Artificial intelligence integrating with robotic technology identifies threats beforehand, eliminating virus deployment.
Eldercare robots are usually used to notify emergency personnel when assistance is required. Furthermore, it is also used to distribute scheduled medication and communicate the patient’s health status with healthcare professionals.
These healthcare robots are prone to cyber-attacks which can lead to the loss of sensitive data and harm the user. Thus, the company introducing their robots is preinstalling the cyber security solutions.
A few of the restraints for the market are lower awareness among end users and the high cost associated with these cyber securities. Furthermore, free cyber security modules are also limiting the demand for cyber security systems in robotics. Moreover, challenging installation and complex functions are restricting the market growth.

| Regions/Countries | Revenue Share % (2025) |
|---|---|
| United States | 38.6% |
| Germany | 7.1% |
| Japan | 4.7% |
| Australia | 2.1% |
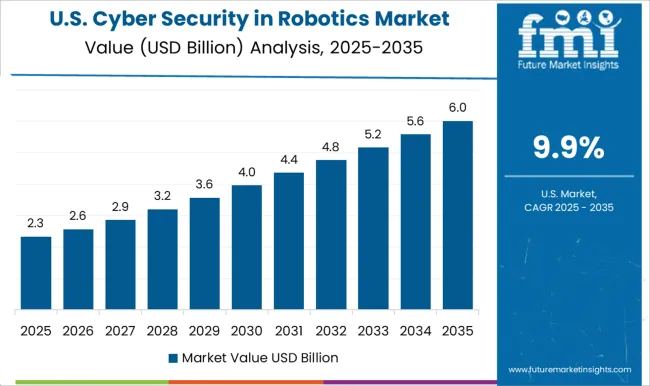
The Focus on Data Security Brands, AI Deployment on Business Expansion to Drive the Market
The United States market leads in terms of market share in the North American region. North America holds the dominating market share of 42.4% in 2025 while USA leading the region.
The higher frequencies of cyber threats and security issues are attributed to the increased application of robots in different verticals in the United States. Alongside this, many data security companies are therefore trying to broaden their businesses in the United States.
The proliferating demand for IoT deployment in the region is pushing organizations to unveil next-generation security platforms and systems. Furthermore, they anticipated helping them in assuring the safe adoption of cloud services and securing their networks against cyber-attacks.
Japan being the Technological and Robotic Hub is Installing Advanced Novel Solutions
The market in Japan held a market share of 4.7% in 2025. The growth is rising due to increasing demand for elder care and vehicle manufacturing robots. The market in Japan is growing, owing to the rising aged population in country.
Accroding to the data published by World Bank, the population under the age group of 65 and above was 28.3% in the country. This leads to higher sales of elder care robots. Thus, accelerating the demand for cybersecurity systems in robotics.
Engaging Partnerships to Deploy New Solutions, United Kingdom Strengthens its Robotic Security Layer
The United Kingdom market thrives at a CAGR of 11.6% during the forecast period. The growth is attributed to the rising requirement for robotics solutions in a wide range of industries in the United Kingdom. Therefore, Europe held a market share of 31.8% in 2025.
Many United Kingdom-based cyber security vendors are putting their focus on the partnership strategy. Along with players from other countries to co-develop novel solutions for deployment in industries.
| Category | By Type |
|---|---|
| Leading Segment | Industrial Robot |
| Market Share (2025) | 26.7% |
| Category | By Service |
|---|---|
| Leading Segment | Security Assessment |
| Market Share (2025) | 34.3% |
Based on type, the industrial robot segment leads as it held a market share of 26.7% in 2025. The growth is attributed to product manufacturers automating repetitive processes. Furthermore, the advent of advanced novel technologies and AI-based functionalities are also making these robots more open to security threats.
Based on service type, the security assessment segment leads as it held a market share of 34.3% in 2025. The growth of this segment is attributed to the high-risk identification, early detection, and potential threat confirmation properties of cyber security in robotics systems.
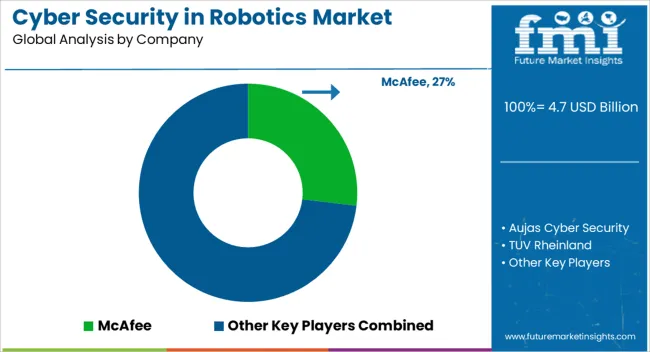
The global cyber security in the robotics market is highly fragmented and thus has a dynamic competitive nature. The focus is on spreading awareness around cybersecurity in robotics and how it affects the growing audience.
Furthermore, the key players are aiming to improve their capabilities and expertise by conducting certification and awareness programs associated with various solutions.
How can Cyber Security in Robotics Manufacturers Providers Scale their Businesses in the Market?
Market players in the market are working on the following strategies.
Market Developments
The global cyber security in robotics market is estimated to be valued at USD 4.7 billion in 2025.
The market size for the cyber security in robotics market is projected to reach USD 14.3 billion by 2035.
The cyber security in robotics market is expected to grow at a 11.7% CAGR between 2025 and 2035.
The key product types in cyber security in robotics market are authentication, secure communication, encryption, denial of service protection and risk & vulnerability management.
In terms of services, security testing segment to command 42.7% share in the cyber security in robotics market in 2025.


Our Research Products

The "Full Research Suite" delivers actionable market intel, deep dives on markets or technologies, so clients act faster, cut risk, and unlock growth.

The Leaderboard benchmarks and ranks top vendors, classifying them as Established Leaders, Leading Challengers, or Disruptors & Challengers.

Locates where complements amplify value and substitutes erode it, forecasting net impact by horizon

We deliver granular, decision-grade intel: market sizing, 5-year forecasts, pricing, adoption, usage, revenue, and operational KPIs—plus competitor tracking, regulation, and value chains—across 60 countries broadly.

Spot the shifts before they hit your P&L. We track inflection points, adoption curves, pricing moves, and ecosystem plays to show where demand is heading, why it is changing, and what to do next across high-growth markets and disruptive tech

Real-time reads of user behavior. We track shifting priorities, perceptions of today’s and next-gen services, and provider experience, then pace how fast tech moves from trial to adoption, blending buyer, consumer, and channel inputs with social signals (#WhySwitch, #UX).

Partner with our analyst team to build a custom report designed around your business priorities. From analysing market trends to assessing competitors or crafting bespoke datasets, we tailor insights to your needs.
Supplier Intelligence
Discovery & Profiling
Capacity & Footprint
Performance & Risk
Compliance & Governance
Commercial Readiness
Who Supplies Whom
Scorecards & Shortlists
Playbooks & Docs
Category Intelligence
Definition & Scope
Demand & Use Cases
Cost Drivers
Market Structure
Supply Chain Map
Trade & Policy
Operating Norms
Deliverables
Buyer Intelligence
Account Basics
Spend & Scope
Procurement Model
Vendor Requirements
Terms & Policies
Entry Strategy
Pain Points & Triggers
Outputs
Pricing Analysis
Benchmarks
Trends
Should-Cost
Indexation
Landed Cost
Commercial Terms
Deliverables
Brand Analysis
Positioning & Value Prop
Share & Presence
Customer Evidence
Go-to-Market
Digital & Reputation
Compliance & Trust
KPIs & Gaps
Outputs
Full Research Suite comprises of:
Market outlook & trends analysis
Interviews & case studies
Strategic recommendations
Vendor profiles & capabilities analysis
5-year forecasts
8 regions and 60+ country-level data splits
Market segment data splits
12 months of continuous data updates
DELIVERED AS:
PDF EXCEL ONLINE
Cyber-Physical System Market Size and Share Forecast Outlook 2025 to 2035
Cyber Crisis Management Market by Type, Application, Vertical, and Region-Forecast through 2035
Cybersecurity Insurance Market Size and Share Forecast Outlook 2025 to 2035
Drone Cybersecurity Market Size and Share Forecast Outlook 2025 to 2035
Airline Cyber Security Market Size and Share Forecast Outlook 2025 to 2035
Maritime Cybersecurity Market Size and Share Forecast Outlook 2025 to 2035
Military Cyber Security Market Size and Share Forecast Outlook 2025 to 2035
Automotive Cybersecurity Market Size and Share Forecast Outlook 2025 to 2035
Industrial Cybersecurity Market Size and Share Forecast Outlook 2025 to 2035
Automotive Cyber Security Market Size and Share Forecast Outlook 2025 to 2035
Aerospace and Defense Cyber Security Market Size and Share Forecast Outlook 2025 to 2035
Artificial Intelligence In Cybersecurity Market Size and Share Forecast Outlook 2025 to 2035
Vehicle-to-Everything (V2X) Cybersecurity Market Size and Share Forecast Outlook 2025 to 2035
Security Tape Market Size and Share Forecast Outlook 2025 to 2035
Security Alarm Communicator Market Size and Share Forecast Outlook 2025 to 2035
Security and Vulnerability Management Market Forecast and Outlook 2025 to 2035
Security Holograms Market Size and Share Forecast Outlook 2025 to 2035
Security Paper Market Size and Share Forecast Outlook 2025 to 2035
Security System Tester Market Size and Share Forecast Outlook 2025 to 2035
Security Advisory Services Market Size and Share Forecast Outlook 2025 to 2035

Thank you!
You will receive an email from our Business Development Manager. Please be sure to check your SPAM/JUNK folder too.
Chat With
MaRIA