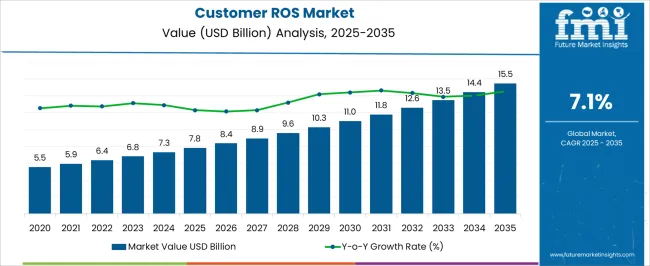
The Customer Revenue Optimization (CRO) Software Market is estimated to be valued at USD 7.8 billion in 2025 and is projected to reach USD 15.5 billion by 2035, registering a compound annual growth rate (CAGR) of 7.1% over the forecast period.
| Metric | Value |
|---|---|
| Customer Revenue Optimization (CRO) Software Market Estimated Value in (2025 E) | USD 7.8 billion |
| Customer Revenue Optimization (CRO) Software Market Forecast Value in (2035 F) | USD 15.5 billion |
| Forecast CAGR (2025 to 2035) | 7.1% |
The customer revenue optimization software market is expanding rapidly as enterprises seek to streamline revenue management processes, improve sales efficiency, and enhance decision making with data driven insights. Cloud based solutions are being widely embraced due to their scalability, cost effectiveness, and flexibility, particularly in dynamic business environments.
Enterprises are increasingly prioritizing tools that unify customer data, automate workflows, and provide predictive intelligence to strengthen sales strategies. Large organizations are leveraging CRO platforms to manage complex sales cycles, improve collaboration across departments, and align revenue operations with corporate growth goals.
Advancements in artificial intelligence and machine learning are driving improvements in forecasting accuracy, personalization, and customer engagement. The market outlook remains favorable as companies across industries accelerate their digital transformation journeys to optimize revenue streams and improve return on investment.
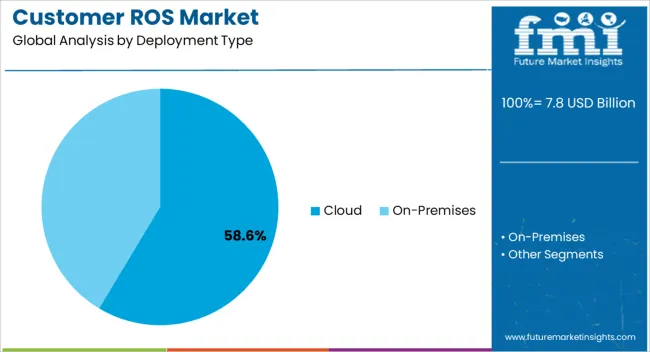
The cloud deployment type segment is projected to account for 58.60% of market revenue by 2025, establishing it as the dominant model. This growth is being supported by the increasing adoption of subscription based solutions that minimize upfront infrastructure costs while offering high scalability.
Enterprises are benefitting from easier integration with existing systems and rapid implementation timelines, which are essential in competitive markets. The flexibility of cloud based CRO platforms allows organizations to adapt quickly to evolving customer demands and regulatory requirements.
Enhanced security features, real time data accessibility, and lower maintenance costs are further reinforcing cloud deployment as the preferred choice in this market.
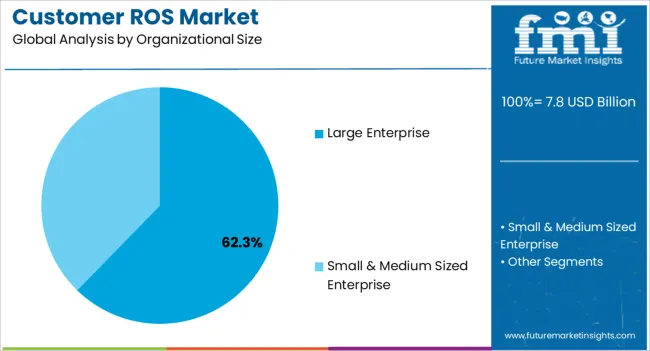
The large enterprise segment is anticipated to hold 62.30% of total revenue by 2025, positioning it as the leading organizational size. This dominance is being driven by the ability of large enterprises to invest significantly in advanced CRO tools that manage multi channel customer interactions and complex sales ecosystems.
These organizations are integrating CRO software into their broader digital transformation strategies to achieve stronger revenue forecasting, improved pipeline visibility, and enhanced cross functional collaboration.
With the rising importance of customer experience and revenue optimization in competitive markets, large enterprises are prioritizing platforms that provide scalability, advanced analytics, and global deployment capabilities.
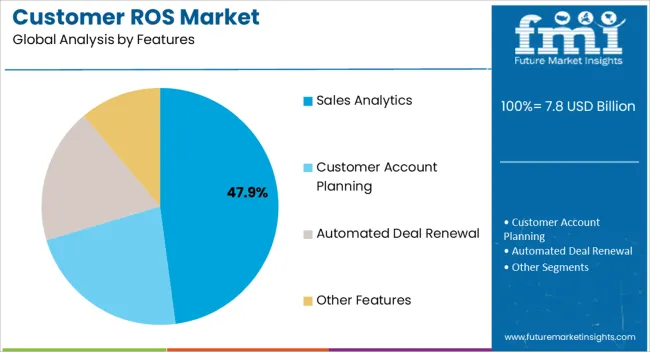
The sales analytics features segment is expected to capture 47.90% of market revenue by 2025, making it the most prominent functionality. This growth is attributed to the increasing reliance on data driven decision making to optimize sales performance and identify growth opportunities.
Sales analytics tools provide real time insights into customer behavior, deal progress, and pipeline health, allowing enterprises to refine strategies and improve conversion rates. Predictive analytics capabilities are enhancing forecast accuracy and helping organizations proactively address revenue risks.
As enterprises shift toward data centric approaches in sales management, sales analytics has emerged as a cornerstone feature, reinforcing its leadership within the CRO software market.
The net valuation of the global CRO software market was nearly USD 5.5 million back in the year 2020. In the following years from 2020 to 2025, the market registered a CAGR of 5.3% and concluded at USD 9,230.4 million.
Due to the social distancing norms, significant growth in online platforms was observed. Resulting in improved sales and profit margins for online outlets, enhancing the demand for customer revenue optimization software.
Moving away from CRO tools and involving the entire customer success team as a company-wide approach help sales departments of different countries deliver continuous revenue growth in 2024. Lockdowns wreaked havoc on the tourist, logistics, transportation, manufacturing, and retail industries, all of which relied heavily on customer revenue optimization software.
With its unique approach to online transactions, cryptocurrency is a game changer. The industry and customers alike were skeptical of its inventiveness. Data breaches have grown commonplace, affecting a wide range of organizations and consumers.
This, combined with the ability to access limitless amounts of information via the internet. This has resulted in a high level of distrust among customer revenue optimization market vendors.
One of the primary causes of the huge expansion of the customer revenue optimization software market has been rising technical advancements.
With the rapid digital transformation and increasing demand for advanced technologies such as artificial intelligence, cloud, and many others, numerous organizations have begun to use sophisticated pricing technologies to help them increase their markets.
Artificial intelligence for revenue optimization provides accuracy. While unlocking untapped data and delivering real-time pricing plans and buying models, assisting firms in growing their businesses.
The adoption of customer revenue optimization (CRO) software is growing, as it assists sales companies in increasing income from leading clients. Through collaborating with other customer-facing departments, such as marketing and customer support, to form an extended revenue team.
As customer revenue optimization (CRO) software understands consumer demands and provides solutions that meet them at any point of contact, it leads to greater demand in the market. By keeping an active engagement with the customer throughout the customer life cycle, the vendor's revenue per customer is maximized.
During the forecast period, cloud-based software is predicted to rise at a substantial CAGR of 7.1% in the customer revenue optimization software market. The use of cloud-based revenue optimization software is growing in a variety of industries due to its potential to provide much more efficient and faster data access, hence increasing workflow productivity.
Due to a reduction in the amount of access to harmful websites, cloud-deployed versions of such software help in giving substantially higher security standards than web-based ones, driving market demand.
Cloud-based revenue optimization software has been giving improved pricing models with monthly or annual subscriptions, which has shown to be a cost-effective solution.
Automating revenue optimization procedures becomes more flexible and efficient as a result of these capabilities of cloud software, resulting in strong market demand. Such factors have had a beneficial impact on the cloud software industry's growth, with a high acceptance rate among small and medium-sized organizations.
| Category | By Features |
|---|---|
| Top Segment | Sales Analytics |
| Market Share in Percentage | 32.5% |
| Category | By Deployment Type |
|---|---|
| Top Segment | On-premise |
| Market Share in Percentage | 55.4% |
Sales analytics have huge potential in the customer revenue optimization software market, with an expected CAGR of 7% during the forecast period.
Customer revenue optimization software is becoming increasingly popular among businesses. Because it provides real-time business insights much faster than traditional methods, increasing team efficiency and raising performance expectations.
| Regions | CAGR (2025 to 2035) |
|---|---|
| United States | 6.9% |
| United Kingdom | 8.1% |
| China | 7.1% |
| Japan | 5.6% |
| South Korea | 5.0% |
| India | 9.2% |
North America is expected to capture a CAGR of 6.9% during the forecast period. Significant investments in research & development activities have aided in the region's high growth in the customer revenue software industry.
Large organizations across the area are increasingly adopting revenue management systems, which has fueled the expansion of customer revenue software. Furthermore, increased digitization as well as the expansion of industrial sectors aimed at raising corporate productivity standards are having a significant impact on the growth of the customer revenue optimization software market in this area.
| Regional Market Comparison | Global Market Share in Percentage |
|---|---|
| United States | 18.1% |
| Germany | 8.2% |
| Japan | 3.4% |
| Australia | 2.1% |
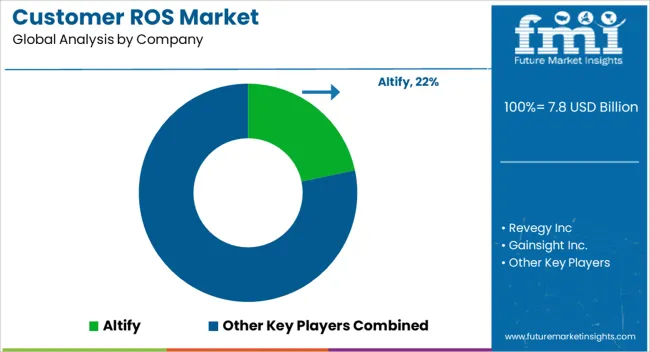
Overall, the study proves to be a useful tool for firms looking to acquire a competitive advantage over their rivals and achieve long-term success in the global customer revenue optimization software market. Research shows how the competitors are taking advantage of the opportunities present in the customer revenue optimization software market.
The strategic framework of leading service providers is focused on generating higher revenues to increase profitability. The following are some recent advances in the customer revenue optimization software market.
The global customer revenue optimization (CRO) software market is estimated to be valued at USD 7.8 billion in 2025.
The market size for the customer revenue optimization (CRO) software market is projected to reach USD 15.5 billion by 2035.
The customer revenue optimization (CRO) software market is expected to grow at a 7.1% CAGR between 2025 and 2035.
The key product types in customer revenue optimization (CRO) software market are cloud and on-premises.
In terms of organizational size, large enterprise segment to command 62.3% share in the customer revenue optimization (CRO) software market in 2025.


Full Research Suite comprises of:
Market outlook & trends analysis
Interviews & case studies
Strategic recommendations
Vendor profiles & capabilities analysis
5-year forecasts
8 regions and 60+ country-level data splits
Market segment data splits
12 months of continuous data updates
DELIVERED AS:
PDF EXCEL ONLINE
Customer Communications Management Market Size and Share Forecast Outlook 2025 to 2035
Customer Experience Management (CEM) In Telecommunication Market Size and Share Forecast Outlook 2025 to 2035
Customer Engagement Hub (CEH) Market Size and Share Forecast Outlook 2025 to 2035
Customer-Facing Technology Market Size and Share Forecast Outlook 2025 to 2035
Customer Experience Platforms Market by Interaction Points, Deployment, Enterprise Size, Region-Forecast through 2035
Customer Analytics in E-commerce Market by Component by Application & Region Forecast till 2035
Customer Engagement Solutions Market Analysis - Demand & Growth through 2034
Customer Service Software Market Size and Share Forecast Outlook 2025 to 2035
Customer Advocacy Software Market - Enhancing Brand Loyalty
Customer Journey Mapping Software Market Size and Share Forecast Outlook 2025 to 2035
Customer Journey Analytics Software Market Size and Share Forecast Outlook 2025 to 2035
Customer-To-Customer (C2C) Community Marketing Software Market Size and Share Forecast Outlook 2025 to 2035
Virtual Customer Premises Equipment Market Size and Share Forecast Outlook 2025 to 2035
Collaborative Customer Interfaces Market Analysis and Forecast 2025 to 2035, By Deployment Type, Type of User, End Use, and Region
Spending In Digital Customer Experience and Engagement Solutions Market Size and Share Forecast Outlook 2025 to 2035
Life Sciences Next-generation Customer Engagement Platforms Market Size and Share Forecast Outlook 2025 to 2035
Revenue Assurance Market Size and Share Forecast Outlook 2025 to 2035
Revenue Management Solutions Market Size and Share Forecast Outlook 2025 to 2035
Revenue Management Software Market Size and Share Forecast Outlook 2025 to 2035
Healthcare Revenue Cycle Management Software Market – Forecast 2017-2022

Thank you!
You will receive an email from our Business Development Manager. Please be sure to check your SPAM/JUNK folder too.
Chat With
MaRIA