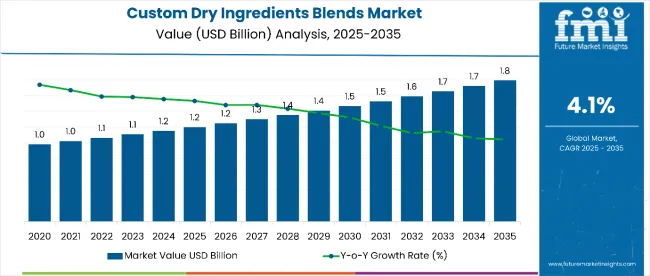
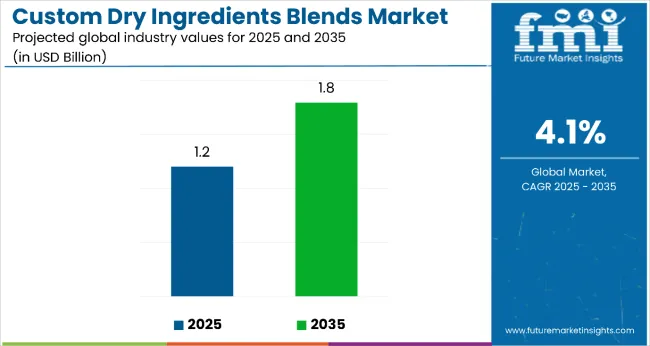
The custom dry ingredients blends market is estimated to be valued at USD 1.2 billion in 2025 and is projected to reach USD 1.8 billion by 2035, registering a CAGR of 4.1% over the forecast period. The market is projected to add an absolute dollar opportunity of USD 0.60 billion between 2025 and 2035. This reflects a 1.50 times growth, driven by expanding demand for clean-label, ready-to-use ingredient solutions in food manufacturing and food service applications.
| Metric | Value |
|---|---|
| Custom Dry Ingredients Blends Market Estimated Value in (2025E) | USD 1.2 billion |
| Custom Dry Ingredients Blends Market Forecast Value in (2035F) | USD 1.8 billion |
| Forecast CAGR (2025 to 2035) | 4.1% |
By 2030, the market is expected to reach approximately USD 1.55 billion, contributing USD 0.35 billion in incremental value over the first half of the decade. The remaining USD 0.25 billion is expected in the second half, indicating a moderately back-loaded growth pattern. Product adoption is accelerating due to the ability of custom blends to reduce production complexity, offer consistent quality, and support health-focused product development.
Companies such as JES Foods, Pharmacare, and Jarrow Formulas are advancing their competitive positions through investment in blending innovation, automation technologies, and value-added custom formulations. Consumer preferences for natural, allergen-free, and functional ingredients are supporting market expansion across categories such as bakery, seasoning blends, meat coatings, and nutritional beverage mixes. Market performance will remain anchored in organic certification, clean-label trends, and supply chain efficiency in food production.
The market holds approximately 36% of the dry ingredient solutions market, driven by its ability to offer consistent flavor, texture, and functional benefits across a wide range of food applications. It accounts for around 41% of the convenience-oriented food formulation market, supported by increasing adoption in sectors such as bakery, sauces, soups, and meat products. The market contributes nearly 33% to the foodservice ingredient customization sector, especially for ready-to-use, pre-measured formulations that improve operational efficiency in commercial kitchens. It holds close to 27% of the clean-label food ingredient market, where demand is rising for natural, allergen-free, and additive-free custom blends. The market commands around 30% of the dry food premix manufacturing segment, reflecting its growing preference among food producers seeking tailored and scalable formulation solutions.
The market is undergoing a structural shift fueled by rising demand for customized, time-saving, and nutritionally balanced dry ingredient formulations. Innovations in automated blending technology, ingredient encapsulation, and extended shelf-life solutions have significantly enhanced product stability, efficiency, and ease of use. Manufacturers are increasingly offering functional, organic, and dietary-specific formulations, tailored for high-growth areas such as plant-based foods, gluten-free bakery mixes, and fortified drink blends.
The market is expanding due to increasing demand for tailored, ready-to-use formulations that enhance operational efficiency and ensure product consistency across food and beverage applications. These blends allow manufacturers to simplify procurement, reduce formulation errors, and maintain batch-to-batch uniformity, which is especially critical in large-scale production and foodservice operations.
Growing preference for convenience and clean-label ingredients is further accelerating adoption, particularly in sectors such as bakery, sauces, soups, meat processing, and functional beverages. As consumers increasingly seek additive-free, allergen-conscious, and nutritionally balanced food products, brands are turning to customized dry blends to meet these expectations while streamlining production processes.
The rise of plant-based, gluten-free, and fortified food trends has prompted manufacturers to offer custom blends that address specific dietary needs and functional goals. Additionally, advances in dry blending technology, encapsulation, and shelf-life extension are making it easier to create innovative, high-performing ingredient systems. This makes custom dry blends a strategic solution for manufacturers aiming to respond quickly to shifting consumer preferences and regulatory requirements.
The market is segmented by end use application, nature, form, and region. By end use application, the market is divided into sauce mixes, seasoning blends/mix, soups & bouillons mixes, salad dressing spice mixes, bakery mixes (bread/batter mixes, cake mixes, pancakes (hotcakes) mixes, pastry mixes and others such as muffin mixes, biscuit mixes, and doughnut mixes), cereal mixes, drink mixes, meat and meat products mixes, dehydrated fruit/vegetable mixes, blended flours, and the food service industry. Based on nature, the market is bifurcated into organic and conventional. In terms of form, the market is classified into flake, flour, bran, and whole form. Regionally, the market is characterized into North America, Latin America, Western Europe, Eastern Europe, South Asia and Pacific, East Asia, and the Middle East and Africa.
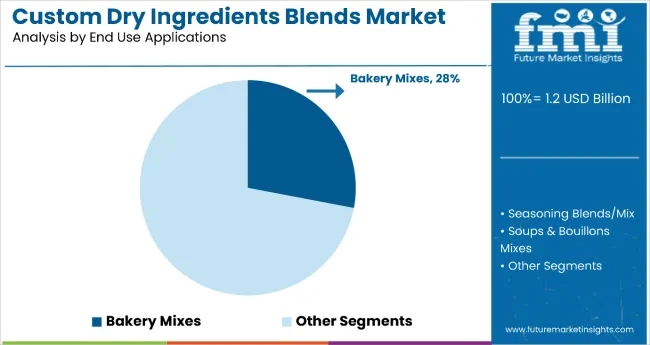
The bakery mixes segment leads the custom dry ingredients blends market with a 28% market share in 2025, driven by strong demand from commercial bakeries, quick-service restaurants, and home bakers seeking convenient, time-saving, and consistently formulated solutions. This segment includes bread and batter mixes, cake mixes, pancake mixes, pastry mixes, and more, offering versatility across multiple product categories. The rise of artisanal bakery items and the growing preference for gluten-free, high-fiber, and clean-label baked goods further strengthen demand.
Manufacturers are increasingly developing customized blends using plant-based proteins, dietary fibers, and natural leavening agents to align with evolving consumer preferences. Advances in shelf-stable, pre-measured blends help reduce waste and improve operational efficiency for commercial bakers. Additionally, expanding bakery markets in emerging economies such as India and China are contributing to sustained growth. With ongoing innovation and diverse end-use applications, bakery mixes are set to maintain their leadership through 2035.
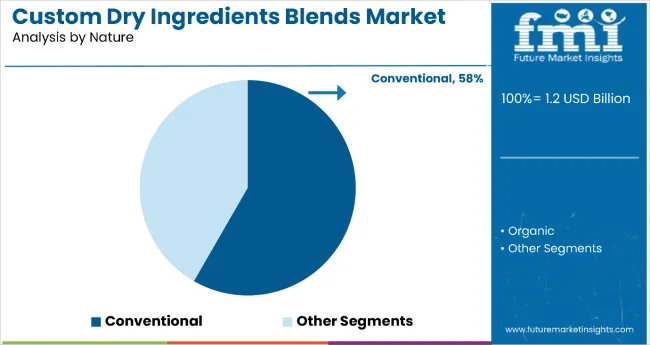
The conventional segment dominates the custom dry ingredients blends market with a 58.3% share in 2025, supported by its cost-effectiveness, broad availability, and compatibility with large-scale food production systems. These blends offer flexibility in ingredient sourcing, formulation, and shelf life, making them the preferred choice for mass-market food and beverage manufacturers. As global demand for convenient, pre-mixed solutions grows across categories such as bakery, soups, sauces, and meat products, conventional blends meet industrial-scale needs without the supply chain complexities and premium pricing of organic alternatives.
Established supplier networks, mature processing technologies, and regulatory familiarity further enhance their appeal, enabling faster innovation and competitive pricing in cost-sensitive regions like Asia, Latin America, and Eastern Europe. While organic adoption is gradually rising, the scalability, affordability, and proven reliability of conventional blends ensure they remain the dominant choice, especially in high-volume applications like bakery mixes, seasoning blends, and soups through 2035.
From 2025 to 2035, rising demand for convenience, consistency, and customization in food production has driven the adoption of custom dry ingredients blends across bakery, seasoning, meat processing, and beverage applications. This shift has positioned manufacturers offering tailored, high-performance blends as key players benefiting from trends in clean-label, time-efficient, and scalable food solutions.
Growing Demand for Functional and Tailored Blends Drives Market Expansion
The increasing focus on production efficiency and consistent quality in the food processing industry has emerged as a primary growth driver for the custom dry ingredients blends market. By 2025, food manufacturers began prioritizing ready-to-use dry blends to streamline operations, reduce formulation complexity, and ensure flavor and texture uniformity across batches. This demand accelerated as brands expanded product lines while seeking formulation speed and flexibility. These developments suggest that performance-driven customization, rather than commodity blending, is the central catalyst for market growth.
Clean-Label and Organic Trends Unlock New Opportunities
In 2024, increasing consumer preference for clean-label, natural, and organic ingredients prompted food manufacturers to reformulate products with transparent labeling and minimal processing. By 2025, this created new opportunities for dry blend providers to develop organic-certified, allergen-free, and additive-free formulations, particularly in the bakery, seasoning, and drink mix categories. These shifts indicate that innovation in clean-label formulation and sourcing transparency can expand end-use applications and customer segments.
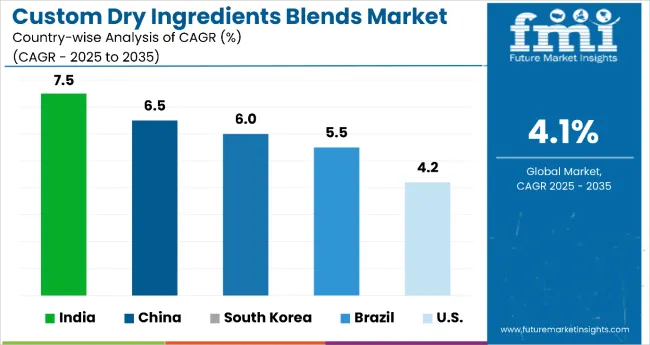
| Country | CAGR |
|---|---|
| India | 7.5% |
| China | 6.5% |
| South Korea | 6.0% |
| Brazil | 5.5% |
| USA | 4.2% |
From 2025 to 2035, India is expected to lead the market with the highest CAGR of 7.5%, driven by a surge in processed food consumption, growing middle-class demand for fortified foods, and expanding nutraceutical investments. China follows with a CAGR of 6.5%, supported by large-scale food manufacturing and increasing integration of blends in instant foods. South Korea is forecast to grow at a 6.0% CAGR, fueled by demand for premium, health-focused, clean-label blends. Brazil's market is set to expand at a 5.5% CAGR, with strong uptake in meat processing and sodium-reduced blends. The USA shows a comparatively slower CAGR of 4.2%, though it remains innovation-driven, focusing on advanced formulation and specialized diets like keto and plant-based.
The report covers an in-depth analysis of 40+ countries; five top-performing OECD countries are highlighted below.
India custom dry ingredients blends market is projected to grow at a CAGR of 7.5% from 2025 to 2035, driven by the surge in processed food consumption and the rapid expansion of the nutraceuticals sector. Rising middle-class demand for fortified and ready-to-mix foods is encouraging manufacturers to invest in custom blending capabilities, including micronutrients, spices, proteins, and functional ingredients. Indian food processors are increasingly adopting automated blending equipment to meet clean-label and FSSAI-compliant standards. Additionally, demand from institutional food services, meal kit providers, and snack producers is increasing. Regional contract blenders are also supporting the market by offering flexible, scalable blending solutions tailored to niche health requirements.
Sales of custom dry ingredients blends in China are expected to expand at a CAGR of 6.5% between 2025 and 2035, supported by strong demand from the large-scale food manufacturing and instant food sectors. The integration of dry blends in convenience foods, soups, noodles, and beverages has led to the rise of contract blending partnerships and centralized R&D labs. Major cities like Shanghai and Guangzhou are emerging as hubs for custom formulation targeting specific flavor profiles and dietary needs. Increased demand for clean-label, low-sodium, and plant-based formulations is also transforming blending operations across China's massive food production network.
Revenue from custom dry ingredients blends in South Korea is forecast to grow at a CAGR of 6.0% through 2035, driven by innovation in health-centric, functional, and convenience-based food categories. Korean consumers’ preference for quality, clean-label, and health-promoting ingredients has prompted food companies to adopt custom blends enriched with collagen, ginseng, probiotics, and green tea extracts. Premium instant meals, wellness beverages, and bakery items are increasingly formulated using tailor-made ingredient systems. The country’s sophisticated logistics and tech-driven food processing enable efficient supply of custom blends to urban markets.
Sales of custom dry ingredients blends in Brazil are projected to grow at a CAGR of 5.5% from 2025 to 2035, supported by increasing domestic consumption of processed meats, snacks, and instant dishes. Custom seasoning blends, protein concentrates, and binder systems are widely adopted in the meat and frozen food industries. The Brazilian market is also seeing an uptick in demand for sodium-reduced, preservative-free, and clean-label blends tailored to evolving regulatory standards and health-conscious consumers. International players are partnering with local co-packers and food processors to expand their custom blend portfolios.
The USA custom dry ingredients blend revenue is anticipated to expand at a CAGR of 4.2% from 2025 to 2035, anchored by high demand from the functional food, meal replacement, and sports nutrition sectors. USA manufacturers are leveraging advanced formulation technologies to create blends with enhanced solubility, bioavailability, and sensory profiles. There's also increased interest in allergen-free, keto, paleo, and plant-based blend systems. Strategic collaborations between food brands and custom blenders are fueling the development of differentiated formulations across snacks, beverages, and bakery segments. The USA remains a global leader in regulatory-compliant, traceable, and high-quality dry blending.
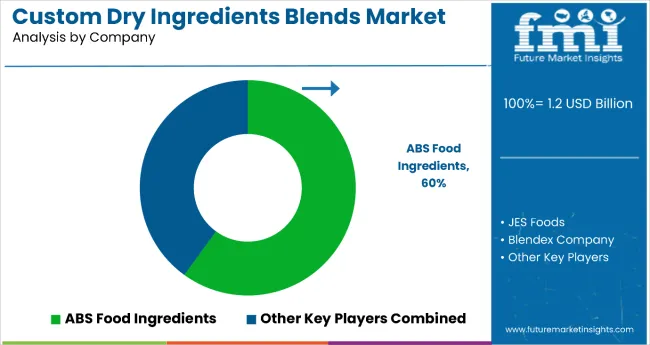
The market is moderately fragmented, with Ingredion Incorporated leading at a 9.3% market share. The company’s dominance is attributed to its extensive custom formulation capabilities, strong global sourcing networks, and established partnerships with food and beverage manufacturers across key markets.
Leading player status is held by Ingredion Incorporated. Other key participants include Cargill Inc., Kerry Group, Archer Daniels Midland (ADM), Sensient Technologies, Newly Weds Foods, EHL Ingredients, Van Drunen Farms, All Seasonings Ingredients, Hela Spice Canada Inc., and Food Ingredients Group. These companies offer customized dry ingredient solutions across bakery, sauces, soups, and meat applications, supported by R&D expertise and clean-label formulation technologies.
Emerging players are entering through niche offerings in organic blends, allergen-free solutions, and localized flavor systems. At the same time, incumbents retain an edge with scalable production, quality consistency, and long-standing client relationships. Demand growth is fueled by rising clean-label preferences, convenience food expansion, and the growing demand for application-specific seasoning and functional blends.
Key Developments in Custom Dry Ingredients Blends Market
In September 2024, Danone announced the Partner for Growth (P4G) initiative signed 19 new strategic partnerships and eight joint business development plans (JBDPs) across ingredient innovation, manufacturing, and sustainability.
| Item | Value |
|---|---|
| Quantitative Units | USD 1.2 billion |
| End Use Application | Sauce Mixes, Seasoning Blends/Mix, Soups & Bouillons Mixes, Salad Dressing Spice Mixes, Bakery Mixes (Bread/Batter Mixes, Cake Mixes, Pancakes (Hotcakes) Mixes, Pastry Mixes, and Others [Muffin Mixes, Biscuit Mixes, Doughnut Mixes]), Cereal Mixes, Drink Mixes, Meat and Meat Products Mixes, Dehydrated Fruit/Vegetable Mixes, Blended Flours, Food Service Industry |
| Nature | Organic and Conventional |
| Form | Flake, Flour, Bran, Whole Form |
| Regions Covered | North America, Latin America, Europe, East Asia, South Asia & Pacific, Middle East & Africa |
| Countries Covered | United States, Canada, United Kingdom, Germany, France, China, Japan, South Korea, Brazil, Australia and 40+ countries |
| Key Companies Profiled | Danone S.A., Total Nutrition, Natural Factors, Jarrow Formulas, NOVA Probiotics, PharmaCare Laboratories, JES Foods, Lifeway Foods, Nestle SA, The Clorox Company, Church and Dwight Co. Inc., Dr. WILLMAR SCHWABE Group |
| Additional Attributes | Segment-wise dollar sales; rapid expansion in foodservice and RTE segments; clean-label and allergen-free innovation; demand for customizable and application-specific blends; growth driven by convenience trends and rising demand in bakery and seasoning mixes |
The global custom dry ingredients blends market is estimated to be valued at USD 1.2 billion in 2025.
The market size for the custom dry ingredients blends market is projected to reach USD 1.8 billion by 2035.
The custom dry ingredients blends market is expected to grow at a 4.1% CAGR between 2025 and 2035.
The conventional segment is projected to lead the custom dry ingredients blends market with a 58.3% market share in 2025.
In terms of end-use application, the bakery mixes segment is expected to command a 28% share in the custom dry ingredients blends market in 2025.


Our Research Products

The "Full Research Suite" delivers actionable market intel, deep dives on markets or technologies, so clients act faster, cut risk, and unlock growth.

The Leaderboard benchmarks and ranks top vendors, classifying them as Established Leaders, Leading Challengers, or Disruptors & Challengers.

Locates where complements amplify value and substitutes erode it, forecasting net impact by horizon

We deliver granular, decision-grade intel: market sizing, 5-year forecasts, pricing, adoption, usage, revenue, and operational KPIs—plus competitor tracking, regulation, and value chains—across 60 countries broadly.

Spot the shifts before they hit your P&L. We track inflection points, adoption curves, pricing moves, and ecosystem plays to show where demand is heading, why it is changing, and what to do next across high-growth markets and disruptive tech

Real-time reads of user behavior. We track shifting priorities, perceptions of today’s and next-gen services, and provider experience, then pace how fast tech moves from trial to adoption, blending buyer, consumer, and channel inputs with social signals (#WhySwitch, #UX).

Partner with our analyst team to build a custom report designed around your business priorities. From analysing market trends to assessing competitors or crafting bespoke datasets, we tailor insights to your needs.
Supplier Intelligence
Discovery & Profiling
Capacity & Footprint
Performance & Risk
Compliance & Governance
Commercial Readiness
Who Supplies Whom
Scorecards & Shortlists
Playbooks & Docs
Category Intelligence
Definition & Scope
Demand & Use Cases
Cost Drivers
Market Structure
Supply Chain Map
Trade & Policy
Operating Norms
Deliverables
Buyer Intelligence
Account Basics
Spend & Scope
Procurement Model
Vendor Requirements
Terms & Policies
Entry Strategy
Pain Points & Triggers
Outputs
Pricing Analysis
Benchmarks
Trends
Should-Cost
Indexation
Landed Cost
Commercial Terms
Deliverables
Brand Analysis
Positioning & Value Prop
Share & Presence
Customer Evidence
Go-to-Market
Digital & Reputation
Compliance & Trust
KPIs & Gaps
Outputs
Full Research Suite comprises of:
Market outlook & trends analysis
Interviews & case studies
Strategic recommendations
Vendor profiles & capabilities analysis
5-year forecasts
8 regions and 60+ country-level data splits
Market segment data splits
12 months of continuous data updates
DELIVERED AS:
PDF EXCEL ONLINE
Custom Packaging Box Market Size and Share Forecast Outlook 2025 to 2035
Custom Face Care Market Forecast Outlook 2025 to 2035
Customized Skincare Market Size and Share Forecast Outlook 2025 to 2035
Custom Peptide Synthesis Services Market Size and Share Forecast Outlook 2025 to 2035
Customer Service Software Market Size and Share Forecast Outlook 2025 to 2035
Custom Vacation Planning Market Size and Share Forecast Outlook 2025 to 2035
Customer Revenue Optimization (CRO) Software Market Size and Share Forecast Outlook 2025 to 2035
Customer Communications Management Market Size and Share Forecast Outlook 2025 to 2035
Customer Experience Management (CEM) In Telecommunication Market Size and Share Forecast Outlook 2025 to 2035
Customer Engagement Hub (CEH) Market Size and Share Forecast Outlook 2025 to 2035
Custom Probiotics Market Size and Share Forecast Outlook 2025 to 2035
Customer Journey Analytics Software Market Size and Share Forecast Outlook 2025 to 2035
Customer-To-Customer (C2C) Community Marketing Software Market Size and Share Forecast Outlook 2025 to 2035
Customer Journey Mapping Software Market Size and Share Forecast Outlook 2025 to 2035
Customized Premix Market Analysis - Size, Share, & Forecast Outlook 2025 to 2035
Custom Binders Market Growth & Industry Forecast 2025 to 2035
Custom Printed Tape Market Size and Share Forecast Outlook 2025 to 2035
Customisation and Personalisation in Travel Market Size and Share Forecast Outlook 2025 to 2035
Customer-Facing Technology Market Size and Share Forecast Outlook 2025 to 2035
Custom Display Packaging Market Analysis - Size, Share, and Forecast Outlook 2025 to 2035

Thank you!
You will receive an email from our Business Development Manager. Please be sure to check your SPAM/JUNK folder too.
Chat With
MaRIA