Cryogenic Vial Market Outlook from 2025 to 2035

The Cryogenic Vial market is witnessing significant growth driven by the rising demand for advanced sample storage solutions in research, clinical, and pharmaceutical settings. The future outlook for this market is shaped by the increasing adoption of biobanking, cell and gene therapy research, and stringent regulatory requirements for biological sample preservation. Growing investments in biotechnology and life sciences research, coupled with advancements in cryopreservation technologies, are fueling the demand for high-quality cryogenic vials.

The market is also supported by the need for reliable, contamination-free storage solutions that maintain sample integrity over extended periods. In addition, the rising focus on personalized medicine and increasing global healthcare expenditure contribute to the market’s expansion.

Technological developments enabling automation and high-throughput sample processing are further enhancing operational efficiency in laboratories As the life sciences and pharmaceutical sectors continue to grow, cryogenic vials are expected to remain essential for sample management, storage, and transport, presenting sustained growth opportunities across global markets.
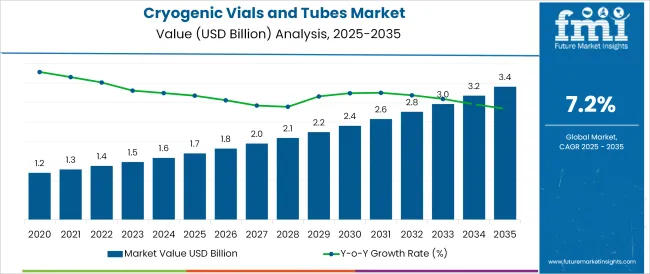
Quick Stats for Cryogenic Vial Market

  • Cryogenic Vial Market Industry Value (2025): USD 172.4 million
  • Cryogenic Vial Market Forecast Value (2035): USD 262.7 million
  • Cryogenic Vial Market Forecast CAGR: 4.3%
  • Leading Segment in Cryogenic Vial Market in 2025: Plastic (65.0%)
  • Key Growth Region in Cryogenic Vial Market: North America, Asia-Pacific, Europe
  • Top Key Players in Cryogenic Vial Market: Thermo Fisher Scientific Inc., Corning Incorporated, DWK Life Sciences GmbH, Sigma-Aldrich Corporation, VWR International LLC, Argos Technologies Inc., Azer Scientific Inc., E&K Scientific Products Inc., CELLTREAT Scientific Products, BIOLOGIX GROUP LTD., Abdos Labtech Private Limited

Cryogenic Vials And Tubes Market Market Value Analysis

Metric Value
Cryogenic Vial Market Estimated Value in (2025 E) USD 172.4 million
Cryogenic Vial Market Forecast Value in (2035 F) USD 262.7 million
Forecast CAGR (2025 to 2035) 4.3%

Segmental Analysis

The market is segmented by Material, Product, Capacity, and End Use and region. By Material, the market is divided into Plastic and Glass. In terms of Product, the market is classified into Self-Standing Bottom and Round Bottom. Based on Capacity, the market is segmented into Up To 1 Ml, 1.1 To 2 Ml, 2 To 4 Ml, and Above 4 Ml.

By End Use, the market is divided into Research Organizations, Drug Manufacturers, and Healthcare Institutions. Regionally, the market is classified into North America, Latin America, Western Europe, Eastern Europe, Balkan & Baltic Countries, Russia & Belarus, Central Asia, East Asia, South Asia & Pacific, and the Middle East & Africa.
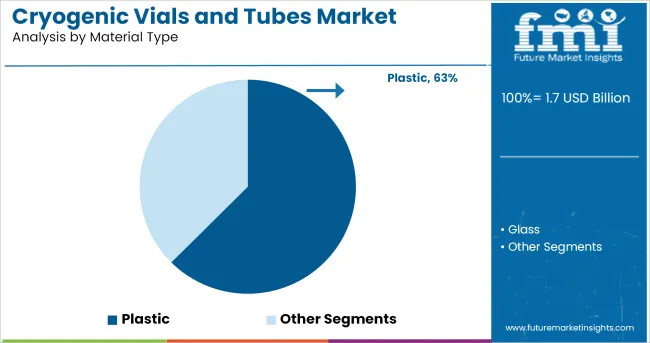
Insights into the Plastic Material Segment

Cryogenic Vials And Tubes Market Analysis By Material Type

The plastic material segment is projected to hold 65.00% of the Cryogenic Vial market revenue share in 2025, making it the leading material type. This dominance is driven by the superior chemical resistance, durability, and cost-effectiveness offered by plastic vials compared to alternative materials. Plastic vials provide enhanced resistance to extreme temperatures, ensuring the stability and integrity of biological samples during storage and transportation.

Their lightweight design and compatibility with automated laboratory systems have further reinforced adoption in research and clinical applications. The segment’s growth is also supported by increasing demand for scalable and reliable storage solutions in biobanking and pharmaceutical workflows.

Moreover, plastic vials are easier to manufacture in various sizes and configurations, enabling customization to meet diverse laboratory requirements The widespread availability and consistent performance of plastic cryogenic vials make them a preferred choice among laboratories and healthcare facilities globally.
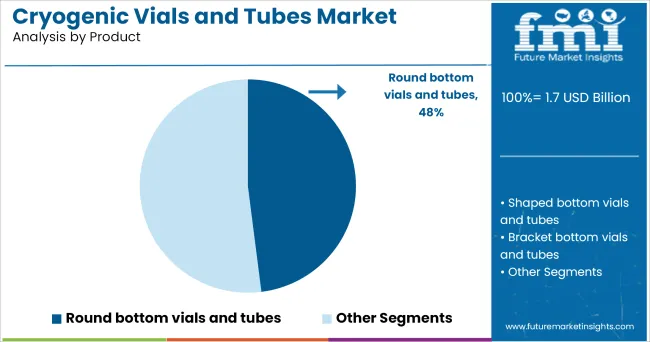
Insights into the Self-Standing Bottom Product Segment

Cryogenic Vials And Tubes Market Analysis By Product

The self-standing bottom product segment is expected to capture 67.40% of the Cryogenic Vial market revenue share in 2025, establishing it as the leading product type. This growth is driven by the ease of handling and storage provided by self-standing designs, which allow vials to remain upright without additional support, reducing the risk of spillage and contamination.

The compatibility of self-standing vials with automated sample handling systems further enhances operational efficiency in laboratories. Additionally, the design facilitates organized storage in racks and cryogenic freezers, optimizing space utilization.

The adoption of self-standing vials is further supported by their ability to withstand extreme cryogenic temperatures while maintaining sample integrity The combination of reliability, ease of use, and scalability continues to drive the preference for self-standing bottom vials across research, clinical, and biopharmaceutical applications.
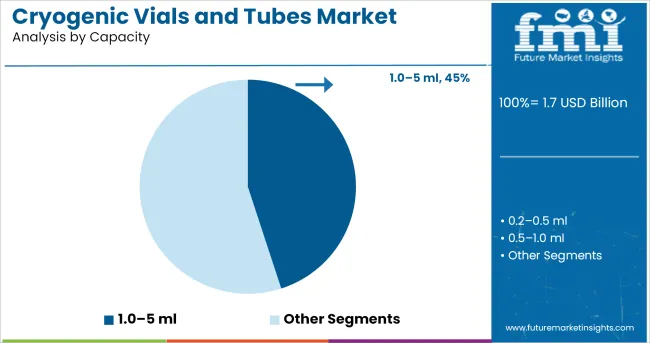
Insights into the Up to 1 Ml Capacity Segment

Cryogenic Vials And Tubes Market Analysis By Capacity

The up to 1 ml capacity segment is projected to account for 40.00% of the Cryogenic Vial market revenue share in 2025, making it the leading capacity type. This growth is driven by the increasing need for small-volume sample storage in clinical diagnostics, molecular biology, and cell-based research.

Smaller vials provide precise aliquoting of samples, reducing waste and enabling efficient sample management. The compact size also allows for high-density storage in cryogenic freezers, improving laboratory workflow and space utilization.

Additionally, the adoption of up to 1 ml vials is supported by their compatibility with automated handling systems and high-throughput screening applications Their reliability in maintaining sample integrity at extremely low temperatures, combined with operational convenience, continues to make up to 1 ml vials a preferred choice in research and healthcare laboratories globally.

Semi Annual Market Update

The subsequent table projects the global market to report CAGRs based on various semi-annual periods from 2025 to 2035. The industry is projected to report a CAGR of 4.6% in the first half (H1) of the decade from 2025 to 2035 and 4.2% in the second half (H2) of the same decade, indicating the downfall in the requirement with 0.4%.

Particular Value CAGR
H1 4.6% (2025 to 2035)
H2 4.2% (2025 to 2035)
H1 4.1% (2025 to 2035)
H2 4.4% (2025 to 2035)

The vial market’s growth trajectory is estimated to shift somewhat during the succeeding decade. Predictions indicate that the CAGR will drop slightly from 4.2% to 4.1% in the first half (H1) of the period. Nevertheless, the second half (H2) is predicted to have a hike in demand at a CAGR of 4.4%. Such an industry trajectory indicates a decline of 40 BPS in H1, following an upsurge of 30 BPS in CAGR in H2.

Industry analysts credit several variables for the change, including the necessity of vials for medical checkups in H1, which might have affected demand. On the other hand, improvements in the research and development techniques in the H2 industry may spike up the growth trajectory.

Key Industry Highlights

Novel Research in Neurology and Cardiology Boost the Demand for Cryopreservation

Research in neurology and cardiology frequently uses hepatocytes, cardiomyocytes, and neural cells, which raises the need for cryopreservation. Because these topics allow for the recovery of biological components and maintain optimal storage conditions, cryogenic vials are crucial to cryopreservation techniques.

The process of cryopreservation is used to preserve biological material at very low temperatures in a variety of areas, including surgery, food sciences, molecular biology, biochemistry, and medicine. Researchers, medical professionals, and laboratory physicians may all benefit from this strategy since it lowers the costs involved in routinely replenishing inventory while maintaining consistency and reproducibility.

The need for cryogenic vials is rising in tandem with the growth of cryopreservation techniques, which is expected to propel the industry to substantial growth during the forecast period.

Adoption of Digital Storage Solution for Cryogenic Tubes

The increasing use of automation and LIMS systems is increasing the need for supplies that are simple to manage and record with little human intervention. International vendors anticipated to respond to this by upgrading their products with cutting-edge tracking technology, such as cryogenic vials with 1D and 2D barcoding.

Biobanks and cell banks are using such vials for cryopreservation of various biomaterials. The vials with printed barcodes are more durable and easier to identify and track biomaterials and samples. Automated data storage ensures a reliable chain of custody, lowering human error, maintaining reproducibility, and promoting collaboration among sample batches.

Data may be easily shared across end users thanks to barcode scanning and digital information storage. The growth and rising use of such items are anticipated to propel global expansion.

Limitation in Expenditure Create Hurdles in the Industry Growth

The cryogenic vials market is estimated to face constraints due to high costs, despite increasing demand in the healthcare, pharmaceuticals, and biotechnology industries. The elevated expenditures may deter potential customers and limit widespread adoption, particularly in smaller research facilities and institutions with limited budgets, which could hinder the market's expansion.

The cost of cryogenic vials is high due to the need for specialized storage equipment and handling procedures, making it less accessible for some organizations. Therefore, developing cost-effective solutions, efficient production processes, and innovative materials is vital for unlocking its full potential.

While the demand for cryogenic vessels remains strong, addressing the cost concerns is essential for sustained market growth and accessibility.

2020 to 2024 Global Cryogenic Vial Sales Outlook Compared to Demand Forecast from 2025 to 2035

Cryogenic vial market size was estimated at USD 139.7 million in 2020 and is poised to register a CAGR of 2.9% from 2020 to 2025. Researchers are anticipated to utilize these vials, which are leak-proof, and ideal for long-term storage of specimens and biological materials at extremely low temperatures. Their rapid thread design facilitates removal, tightening and is typically packaged in tamper-proof, unique safety-lock bags.

Manufacturers are envisioned to boost the research and development on the features of cryo-tubes throughout the forecast timeframe. End users are spending an increasing amount of funds on specialized and sterile vials. By 2025, the market had grown to USD 157.9 million.

The evolving industry trends are guiding long-term strategies for businesses, both established and emerging. The global pandemic has significantly impacted the operations of these businesses, and its long-term effects are envisioned to impact industry growth. The demand of vials for research is continuously improving to address fundamental COVID-19 concerns and potential solutions.

With a projected CAGR of 4.3%, the industry is predicted to prosper in comparison to the previous market trajectory. Manufacturers are creating innovative designs based on practitioners’ demands. Among the few improvements that are anticipated to increase the global market are the installation of extra safety layers and advances in material science.

Market Concentration

Firms with diverse product portfolios such as Thermo Fisher Scientific Inc, Corning Incorporated, Sigma-Aldrich Corporation, DWK Life Sciences GmbH, VWR International LLC, and others are renowned for their diverse product offerings and significant influence in their specialized markets. Tier 1 firms set the standard for unique solutions by offering a wide range of options across various industries.

Argos Technologies Inc., Azer Scientific Inc., E&K Scientific Products Inc., CELLTREAT Scientific Products, BIOLOGIX GROUP LTD., and Abdos Labtech Private Limited are companies in the Tier 2 category with a significant revenue share and strong regional presence. Despite not being as globally strong as companies in the Tier 1 category are, they remain competitive in the industry due to their specialized product offerings and regional influence.

Due to their niche product lines and little market presence, emerging players as well as companies with limited resources are categorized as firms in the Tier 3 category. Smaller or more specialized businesses with a narrower market focus or niche presence, sometimes catering to certain geographical markets or sectors, make up the Tier 3 companies.

Country-wise Insights

The section below discusses the country-level forecast for the cryogenic vial industry. The analysis of the regional industries is estimated to project the demand across the regions such as North America, Europe as well as Asia-Pacific.

In the North America, the demand is anticipated to surge from the United States exhibiting a CAGR of 2.7% by 2035.

On the contrary, the demand from emerging regions of Asia-Pacific such as India and China is projected to thrive in the forthcoming decade, highlighting the CAGR of 6.7% and 5.9%, respectively.

Countries Value CAGR (2025 to 2035)
United States 2.7%
Canada 2.3%
United Kingdom 2.6%
Spain 3.4%
China 5.9%
India 6.7%

Improvements in Medical Science Boost the Need for Vials

The industry in the United States is predicted to report a CAGR of 2.7% during the forecast period 2025 to 2035.

In the United States, improvements in medical science are envisioned to propel the need for customized vials tailored for cryogenic experiments. As research and development in the medical field continue to progress, there is a growing demand for specialized vials that can effectively preserve biological materials at ultra-low temperatures.

Bespoke vials play an essential role in ensuring the integrity and viability of various biological samples used in research, diagnostics, and medical treatments.

The demand for personalized treatment and gene therapies has LED to a growing demand for innovative vial designs that meet the unique requirements of medical research and applications, which is anticipated to significantly influence cryogenic vial production and supply in the United States.

Government Initiatives in India Caters the Development of Industry

The industry in India is anticipated to register a CAGR of 6.7% by 2035. Government initiatives such as SERB International Research Experience (SIRE) and Promotion of University Research and Scientific Excellence (PURSE) are estimated to enlarge the consumer base for experimental vials for research purposes.

Research institutes in India such as the Indian Institute of Science (IISc) and IITs are anticipated to develop novel cures and solutions for the treatment of several issues, for that the demand for vials with temperature-adjustment features is estimated to boost in the forthcoming decade.

In the forthcoming decade, manufacturers in the industry are anticipated to develop standard vials, catering to the budding demand from the region.

Development of Genetic Research in China Boost the Revenue

The increased demand for genetic experimentation by institutions in China is predicted to increase the requirement for medical vials. The need for superior medical vials to preserve and transfer biological samples used in genetic research and experimentation is increasing as these studies proceed.

To satisfy the demands of Chinese institutions and research centers, manufacturers may decide to raise output, which might have a substantial influence on the worldwide medical vial supply chain. With improvements in the industry, the demand is anticipated to report a CAGR of 5.9% through 2035.

Improvements in vial technology and storage techniques that ensure the integrity and security of DNA material may also result from the initiative. China's growing involvement in cutting-edge scientific research is reflected in the rise in demand for medical vials there, which emphasizes the necessity of innovation and growth in the medical vial sector to support these initiatives.

Category-wise Insights

The section contains information about the leading segments in the cryogenic vial industry. In terms of product, the self-standing bottom vail segment is estimated to account for a share of 67.4% in 2025. By end use, the research organization sector is projected to dominate by holding a share of 39.3% in 2025.

Majority of the Industry Is Kept In the Self-Standing Bottom Vails

Product Self-Standing Bottom
Value Share (2025) 67.4%

In 2025, the demand for vials with self-standing bottoms is anticipated to cater to a revenue share of 67.4%. Over the subsequent decade, the global industry is anticipated to see an increase in demand for self-standing bottom vials, indicating a shift in consumer preferences and industry requirements, due to advancements in cryogenic technology and increased use of cryogenic applications.

The rise in demand for vials due to their self-standing bottoms could improve stability and ease of use, highlighting the need for innovation and adaptability in the sector. Manufacturers and suppliers must respond with tailored products and technical solutions.

Activities in Research Organizations Boost the Utilization of Vials

End Use Research Organizations
Value Share (2025) 39.3%

The demand for cryogenic vials from research organizations is expected to experience substantial growth in 2025, attaining 39.3% of the industry share. Cryogenic containers are essential for maintaining low temperatures and controlling research environments in physics, chemistry, and materials science, with their need increasing with improvements.

Research organizations, including universities and laboratories, are increasingly recognizing the importance of cryogenic vials in their work, leading to a surge in demand for precise temperature control and material manipulation in extremely cold conditions. The demand is anticipated to increase orders and broaden the market reach for suppliers and manufacturers of vials.
Competitive Landscape

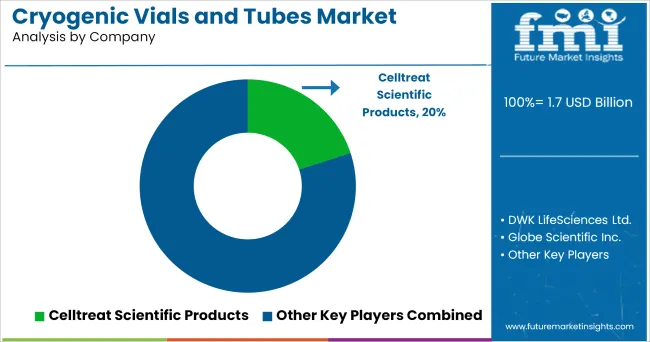
Cryogenic Vials And Tubes Market Analysis By Company

Market players in the cryogenic vial market are estimated to push the limit of production by developing innovative product portfolios that can cater to multiple requirements of the users. The research and development of the novel and unique features of the vials are anticipated to help in the growing practices of research and development in other sectors.

Major players in the industry are envisioned to increase their market share on a global level by employing various strategic approaches. These may include engaging in mergers and acquisitions to consolidate their position, forming partnerships with niche markets to access new customer segments, and augmenting their footprint in different geographic regions to capture novel prospects.

Recent Industry Developments in Cryogenic Vial Market

  • In May 2025, West Pharmaceutical Services launched Daikyo Crystal Zenith Nested Vials in Tub offering containment solutions for cell and gene therapies, radiopharmaceuticals, and sensitive molecules, meeting packaging demands from preclinical to commercial phases.
  • In April 2025, CSafe launched a new line of cryogenic multi-use dewars for the cell and gene therapy market, maintaining temperatures colder than -150°C. These reusable dewars and high-impact-resistant shipping cases are designed to securely transport critical cell and gene therapies, ensuring the integrity of their cargo.

Key Players of Cryogenic Vial Industry

  • Thermo Fisher Scientific Inc.
  • Corning Incorporated
  • DWK Life Sciences GmbH
  • Sigma-Aldrich Corporation
  • VWR International LLC
  • Argos Technologies Inc.
  • Azer Scientific Inc.
  • E&K Scientific Products Inc.
  • CELLTREAT Scientific Products
  • BIOLOGIX GROUP LTD.
  • Abdos Labtech Private Limited

Key Segments of Cryogenic Vial Industry

By Material:

In terms of material, the industry is bifurcated into plastic and glass.

By Product:

In terms of products, the industry is divided into self-standing bottom and round bottom.

By Capacity:

In terms of capacity, the industry is categorized as up to 1 ml, 1.1 to 2 ml, 2 to 4 ml, and above 4 ml.

By End use:

End use industries of the sector are research organizations, drug manufacturers, and healthcare institutions.

By Region:

Key countries of North America, Latin America, Europe, East Asia, South Asia & Pacific, Middle East and Africa (MEA), have been covered in the report.

Frequently Asked Questions

How big is the cryogenic vial market in 2025?

The global cryogenic vial market is estimated to be valued at USD 172.4 million in 2025.

What will be the size of cryogenic vial market in 2035?

The market size for the cryogenic vial market is projected to reach USD 262.7 million by 2035.

How much will be the cryogenic vial market growth between 2025 and 2035?

The cryogenic vial market is expected to grow at a 4.3% CAGR between 2025 and 2035.

What are the key product types in the cryogenic vial market?

The key product types in cryogenic vial market are plastic and glass.

Which product segment to contribute significant share in the cryogenic vial market in 2025?

In terms of product, self-standing bottom segment to command 67.4% share in the cryogenic vial market in 2025.

Table of Content

  1. Executive Summary
    • Global Market Outlook
    • Demand to side Trends
    • Supply to side Trends
    • Technology Roadmap Analysis
    • Analysis and Recommendations
  2. Market Overview
    • Market Coverage / Taxonomy
    • Market Definition / Scope / Limitations
  3. Market Background
    • Market Dynamics
      • Drivers
      • Restraints
      • Opportunity
      • Trends
    • Scenario Forecast
      • Demand in Optimistic Scenario
      • Demand in Likely Scenario
      • Demand in Conservative Scenario
    • Opportunity Map Analysis
    • Product Life Cycle Analysis
    • Supply Chain Analysis
    • Investment Feasibility Matrix
    • Value Chain Analysis
    • PESTLE and Porter’s Analysis
    • Regulatory Landscape
    • Regional Parent Market Outlook
    • Production and Consumption Statistics
    • Import and Export Statistics
  4. Global Market Analysis 2020 to 2025 and Forecast, 2025 to 2035
    • Historical Market Size Value (USD Million) Analysis, 2020 to 2025
    • Current and Future Market Size Value (USD Million) Projections, 2025 to 2035
      • Y to o to Y Growth Trend Analysis
      • Absolute $ Opportunity Analysis
  5. Global Market Pricing Analysis 2020 to 2025 and Forecast 2025 to 2035
  6. Global Market Analysis 2020 to 2025 and Forecast 2025 to 2035, By Material
    • Introduction / Key Findings
    • Historical Market Size Value (USD Million) Analysis By Material , 2020 to 2025
    • Current and Future Market Size Value (USD Million) Analysis and Forecast By Material , 2025 to 2035
      • Plastic
      • Glass
    • Y to o to Y Growth Trend Analysis By Material , 2020 to 2025
    • Absolute $ Opportunity Analysis By Material , 2025 to 2035
  7. Global Market Analysis 2020 to 2025 and Forecast 2025 to 2035, By Product
    • Introduction / Key Findings
    • Historical Market Size Value (USD Million) Analysis By Product, 2020 to 2025
    • Current and Future Market Size Value (USD Million) Analysis and Forecast By Product, 2025 to 2035
      • Self-Standing Bottom
      • Round Bottom
    • Y to o to Y Growth Trend Analysis By Product, 2020 to 2025
    • Absolute $ Opportunity Analysis By Product, 2025 to 2035
  8. Global Market Analysis 2020 to 2025 and Forecast 2025 to 2035, By Capacity
    • Introduction / Key Findings
    • Historical Market Size Value (USD Million) Analysis By Capacity, 2020 to 2025
    • Current and Future Market Size Value (USD Million) Analysis and Forecast By Capacity, 2025 to 2035
      • Up To 1 Ml
      • 1.1 To 2 Ml
      • 2 To 4 Ml
      • Above 4 Ml
    • Y to o to Y Growth Trend Analysis By Capacity, 2020 to 2025
    • Absolute $ Opportunity Analysis By Capacity, 2025 to 2035
  9. Global Market Analysis 2020 to 2025 and Forecast 2025 to 2035, By End Use
    • Introduction / Key Findings
    • Historical Market Size Value (USD Million) Analysis By End Use, 2020 to 2025
    • Current and Future Market Size Value (USD Million) Analysis and Forecast By End Use, 2025 to 2035
      • Research Organizations
      • Drug Manufacturers
      • Healthcare Institutions
    • Y to o to Y Growth Trend Analysis By End Use, 2020 to 2025
    • Absolute $ Opportunity Analysis By End Use, 2025 to 2035
  10. Global Market Analysis 2020 to 2025 and Forecast 2025 to 2035, By Region
    • Introduction
    • Historical Market Size Value (USD Million) Analysis By Region, 2020 to 2025
    • Current Market Size Value (USD Million) Analysis and Forecast By Region, 2025 to 2035
      • North America
      • Latin America
      • Western Europe
      • Eastern Europe
      • East Asia
      • South Asia and Pacific
      • Middle East & Africa
    • Market Attractiveness Analysis By Region
  11. North America Market Analysis 2020 to 2025 and Forecast 2025 to 2035, By Country
    • Historical Market Size Value (USD Million) Trend Analysis By Market Taxonomy, 2020 to 2025
    • Market Size Value (USD Million) Forecast By Market Taxonomy, 2025 to 2035
      • By Country
        • USA
        • Canada
        • Mexico
      • By Material
      • By Product
      • By Capacity
      • By End Use
    • Market Attractiveness Analysis
      • By Country
      • By Material
      • By Product
      • By Capacity
      • By End Use
    • Key Takeaways
  12. Latin America Market Analysis 2020 to 2025 and Forecast 2025 to 2035, By Country
    • Historical Market Size Value (USD Million) Trend Analysis By Market Taxonomy, 2020 to 2025
    • Market Size Value (USD Million) Forecast By Market Taxonomy, 2025 to 2035
      • By Country
        • Brazil
        • Chile
        • Rest of Latin America
      • By Material
      • By Product
      • By Capacity
      • By End Use
    • Market Attractiveness Analysis
      • By Country
      • By Material
      • By Product
      • By Capacity
      • By End Use
    • Key Takeaways
  13. Western Europe Market Analysis 2020 to 2025 and Forecast 2025 to 2035, By Country
    • Historical Market Size Value (USD Million) Trend Analysis By Market Taxonomy, 2020 to 2025
    • Market Size Value (USD Million) Forecast By Market Taxonomy, 2025 to 2035
      • By Country
        • Germany
        • UK
        • Italy
        • Spain
        • France
        • Nordic
        • BENELUX
        • Rest of Western Europe
      • By Material
      • By Product
      • By Capacity
      • By End Use
    • Market Attractiveness Analysis
      • By Country
      • By Material
      • By Product
      • By Capacity
      • By End Use
    • Key Takeaways
  14. Eastern Europe Market Analysis 2020 to 2025 and Forecast 2025 to 2035, By Country
    • Historical Market Size Value (USD Million) Trend Analysis By Market Taxonomy, 2020 to 2025
    • Market Size Value (USD Million) Forecast By Market Taxonomy, 2025 to 2035
      • By Country
        • Russia
        • Poland
        • Hungary
        • Balkan & Baltic
        • Rest of Eastern Europe
      • By Material
      • By Product
      • By Capacity
      • By End Use
    • Market Attractiveness Analysis
      • By Country
      • By Material
      • By Product
      • By Capacity
      • By End Use
    • Key Takeaways
  15. East Asia Market Analysis 2020 to 2025 and Forecast 2025 to 2035, By Country
    • Historical Market Size Value (USD Million) Trend Analysis By Market Taxonomy, 2020 to 2025
    • Market Size Value (USD Million) Forecast By Market Taxonomy, 2025 to 2035
      • By Country
        • China
        • Japan
        • South Korea
      • By Material
      • By Product
      • By Capacity
      • By End Use
    • Market Attractiveness Analysis
      • By Country
      • By Material
      • By Product
      • By Capacity
      • By End Use
    • Key Takeaways
  16. South Asia and Pacific Market Analysis 2020 to 2025 and Forecast 2025 to 2035, By Country
    • Historical Market Size Value (USD Million) Trend Analysis By Market Taxonomy, 2020 to 2025
    • Market Size Value (USD Million) Forecast By Market Taxonomy, 2025 to 2035
      • By Country
        • India
        • ASEAN
        • Australia & New Zealand
        • Rest of South Asia and Pacific
      • By Material
      • By Product
      • By Capacity
      • By End Use
    • Market Attractiveness Analysis
      • By Country
      • By Material
      • By Product
      • By Capacity
      • By End Use
    • Key Takeaways
  17. Middle East & Africa Market Analysis 2020 to 2025 and Forecast 2025 to 2035, By Country
    • Historical Market Size Value (USD Million) Trend Analysis By Market Taxonomy, 2020 to 2025
    • Market Size Value (USD Million) Forecast By Market Taxonomy, 2025 to 2035
      • By Country
        • Kingdom of Saudi Arabia
        • Other GCC Countries
        • Turkiye
        • South Africa
        • Other African Union
        • Rest of Middle East & Africa
      • By Material
      • By Product
      • By Capacity
      • By End Use
    • Market Attractiveness Analysis
      • By Country
      • By Material
      • By Product
      • By Capacity
      • By End Use
    • Key Takeaways
  18. Key Countries Market Analysis
    • USA
      • Pricing Analysis
      • Market Share Analysis, 2025
        • By Material
        • By Product
        • By Capacity
        • By End Use
    • Canada
      • Pricing Analysis
      • Market Share Analysis, 2025
        • By Material
        • By Product
        • By Capacity
        • By End Use
    • Mexico
      • Pricing Analysis
      • Market Share Analysis, 2025
        • By Material
        • By Product
        • By Capacity
        • By End Use
    • Brazil
      • Pricing Analysis
      • Market Share Analysis, 2025
        • By Material
        • By Product
        • By Capacity
        • By End Use
    • Chile
      • Pricing Analysis
      • Market Share Analysis, 2025
        • By Material
        • By Product
        • By Capacity
        • By End Use
    • Germany
      • Pricing Analysis
      • Market Share Analysis, 2025
        • By Material
        • By Product
        • By Capacity
        • By End Use
    • UK
      • Pricing Analysis
      • Market Share Analysis, 2025
        • By Material
        • By Product
        • By Capacity
        • By End Use
    • Italy
      • Pricing Analysis
      • Market Share Analysis, 2025
        • By Material
        • By Product
        • By Capacity
        • By End Use
    • Spain
      • Pricing Analysis
      • Market Share Analysis, 2025
        • By Material
        • By Product
        • By Capacity
        • By End Use
    • France
      • Pricing Analysis
      • Market Share Analysis, 2025
        • By Material
        • By Product
        • By Capacity
        • By End Use
    • India
      • Pricing Analysis
      • Market Share Analysis, 2025
        • By Material
        • By Product
        • By Capacity
        • By End Use
    • ASEAN
      • Pricing Analysis
      • Market Share Analysis, 2025
        • By Material
        • By Product
        • By Capacity
        • By End Use
    • Australia & New Zealand
      • Pricing Analysis
      • Market Share Analysis, 2025
        • By Material
        • By Product
        • By Capacity
        • By End Use
    • China
      • Pricing Analysis
      • Market Share Analysis, 2025
        • By Material
        • By Product
        • By Capacity
        • By End Use
    • Japan
      • Pricing Analysis
      • Market Share Analysis, 2025
        • By Material
        • By Product
        • By Capacity
        • By End Use
    • South Korea
      • Pricing Analysis
      • Market Share Analysis, 2025
        • By Material
        • By Product
        • By Capacity
        • By End Use
    • Russia
      • Pricing Analysis
      • Market Share Analysis, 2025
        • By Material
        • By Product
        • By Capacity
        • By End Use
    • Poland
      • Pricing Analysis
      • Market Share Analysis, 2025
        • By Material
        • By Product
        • By Capacity
        • By End Use
    • Hungary
      • Pricing Analysis
      • Market Share Analysis, 2025
        • By Material
        • By Product
        • By Capacity
        • By End Use
    • Kingdom of Saudi Arabia
      • Pricing Analysis
      • Market Share Analysis, 2025
        • By Material
        • By Product
        • By Capacity
        • By End Use
    • Turkiye
      • Pricing Analysis
      • Market Share Analysis, 2025
        • By Material
        • By Product
        • By Capacity
        • By End Use
    • South Africa
      • Pricing Analysis
      • Market Share Analysis, 2025
        • By Material
        • By Product
        • By Capacity
        • By End Use
  19. Market Structure Analysis
    • Competition Dashboard
    • Competition Benchmarking
    • Market Share Analysis of Top Players
      • By Regional
      • By Material
      • By Product
      • By Capacity
      • By End Use
  20. Competition Analysis
    • Competition Deep Dive
      • Thermo Fisher Scientific Inc.
        • Overview
        • Product Portfolio
        • Profitability by Market Segments (Product/Age /Sales Channel/Region)
        • Sales Footprint
        • Strategy Overview
          • Marketing Strategy
          • Product Strategy
          • Channel Strategy
      • Corning Incorporated
      • DWK Life Sciences GmbH
      • Sigma-Aldrich Corporation
      • VWR International LLC
      • Argos Technologies Inc.
      • Azer Scientific Inc.
      • E&K Scientific Products Inc.
      • CELLTREAT Scientific Products
      • BIOLOGIX GROUP LTD.
      • Abdos Labtech Private Limited
  21. Assumptions & Acronyms Used
  22. Research Methodology

List of Tables

  • Table 1: Global Market Value (USD Million) Forecast by Region, 2020 to 2035
  • Table 2: Global Market Value (USD Million) Forecast by Material , 2020 to 2035
  • Table 3: Global Market Value (USD Million) Forecast by Product, 2020 to 2035
  • Table 4: Global Market Value (USD Million) Forecast by Capacity, 2020 to 2035
  • Table 5: Global Market Value (USD Million) Forecast by End Use, 2020 to 2035
  • Table 6: North America Market Value (USD Million) Forecast by Country, 2020 to 2035
  • Table 7: North America Market Value (USD Million) Forecast by Material , 2020 to 2035
  • Table 8: North America Market Value (USD Million) Forecast by Product, 2020 to 2035
  • Table 9: North America Market Value (USD Million) Forecast by Capacity, 2020 to 2035
  • Table 10: North America Market Value (USD Million) Forecast by End Use, 2020 to 2035
  • Table 11: Latin America Market Value (USD Million) Forecast by Country, 2020 to 2035
  • Table 12: Latin America Market Value (USD Million) Forecast by Material , 2020 to 2035
  • Table 13: Latin America Market Value (USD Million) Forecast by Product, 2020 to 2035
  • Table 14: Latin America Market Value (USD Million) Forecast by Capacity, 2020 to 2035
  • Table 15: Latin America Market Value (USD Million) Forecast by End Use, 2020 to 2035
  • Table 16: Western Europe Market Value (USD Million) Forecast by Country, 2020 to 2035
  • Table 17: Western Europe Market Value (USD Million) Forecast by Material , 2020 to 2035
  • Table 18: Western Europe Market Value (USD Million) Forecast by Product, 2020 to 2035
  • Table 19: Western Europe Market Value (USD Million) Forecast by Capacity, 2020 to 2035
  • Table 20: Western Europe Market Value (USD Million) Forecast by End Use, 2020 to 2035
  • Table 21: Eastern Europe Market Value (USD Million) Forecast by Country, 2020 to 2035
  • Table 22: Eastern Europe Market Value (USD Million) Forecast by Material , 2020 to 2035
  • Table 23: Eastern Europe Market Value (USD Million) Forecast by Product, 2020 to 2035
  • Table 24: Eastern Europe Market Value (USD Million) Forecast by Capacity, 2020 to 2035
  • Table 25: Eastern Europe Market Value (USD Million) Forecast by End Use, 2020 to 2035
  • Table 26: East Asia Market Value (USD Million) Forecast by Country, 2020 to 2035
  • Table 27: East Asia Market Value (USD Million) Forecast by Material , 2020 to 2035
  • Table 28: East Asia Market Value (USD Million) Forecast by Product, 2020 to 2035
  • Table 29: East Asia Market Value (USD Million) Forecast by Capacity, 2020 to 2035
  • Table 30: East Asia Market Value (USD Million) Forecast by End Use, 2020 to 2035
  • Table 31: South Asia and Pacific Market Value (USD Million) Forecast by Country, 2020 to 2035
  • Table 32: South Asia and Pacific Market Value (USD Million) Forecast by Material , 2020 to 2035
  • Table 33: South Asia and Pacific Market Value (USD Million) Forecast by Product, 2020 to 2035
  • Table 34: South Asia and Pacific Market Value (USD Million) Forecast by Capacity, 2020 to 2035
  • Table 35: South Asia and Pacific Market Value (USD Million) Forecast by End Use, 2020 to 2035
  • Table 36: Middle East & Africa Market Value (USD Million) Forecast by Country, 2020 to 2035
  • Table 37: Middle East & Africa Market Value (USD Million) Forecast by Material , 2020 to 2035
  • Table 38: Middle East & Africa Market Value (USD Million) Forecast by Product, 2020 to 2035
  • Table 39: Middle East & Africa Market Value (USD Million) Forecast by Capacity, 2020 to 2035
  • Table 40: Middle East & Africa Market Value (USD Million) Forecast by End Use, 2020 to 2035

List of Figures

  • Figure 1: Global Market Pricing Analysis
  • Figure 2: Global Market Value (USD Million) Forecast 2020-2035
  • Figure 3: Global Market Value Share and BPS Analysis by Material , 2025 and 2035
  • Figure 4: Global Market Y to o to Y Growth Comparison by Material , 2025-2035
  • Figure 5: Global Market Attractiveness Analysis by Material
  • Figure 6: Global Market Value Share and BPS Analysis by Product, 2025 and 2035
  • Figure 7: Global Market Y to o to Y Growth Comparison by Product, 2025-2035
  • Figure 8: Global Market Attractiveness Analysis by Product
  • Figure 9: Global Market Value Share and BPS Analysis by Capacity, 2025 and 2035
  • Figure 10: Global Market Y to o to Y Growth Comparison by Capacity, 2025-2035
  • Figure 11: Global Market Attractiveness Analysis by Capacity
  • Figure 12: Global Market Value Share and BPS Analysis by End Use, 2025 and 2035
  • Figure 13: Global Market Y to o to Y Growth Comparison by End Use, 2025-2035
  • Figure 14: Global Market Attractiveness Analysis by End Use
  • Figure 15: Global Market Value (USD Million) Share and BPS Analysis by Region, 2025 and 2035
  • Figure 16: Global Market Y to o to Y Growth Comparison by Region, 2025-2035
  • Figure 17: Global Market Attractiveness Analysis by Region
  • Figure 18: North America Market Incremental Dollar Opportunity, 2025-2035
  • Figure 19: Latin America Market Incremental Dollar Opportunity, 2025-2035
  • Figure 20: Western Europe Market Incremental Dollar Opportunity, 2025-2035
  • Figure 21: Eastern Europe Market Incremental Dollar Opportunity, 2025-2035
  • Figure 22: East Asia Market Incremental Dollar Opportunity, 2025-2035
  • Figure 23: South Asia and Pacific Market Incremental Dollar Opportunity, 2025-2035
  • Figure 24: Middle East & Africa Market Incremental Dollar Opportunity, 2025-2035
  • Figure 25: North America Market Value Share and BPS Analysis by Country, 2025 and 2035
  • Figure 26: North America Market Value Share and BPS Analysis by Material , 2025 and 2035
  • Figure 27: North America Market Y to o to Y Growth Comparison by Material , 2025-2035
  • Figure 28: North America Market Attractiveness Analysis by Material
  • Figure 29: North America Market Value Share and BPS Analysis by Product, 2025 and 2035
  • Figure 30: North America Market Y to o to Y Growth Comparison by Product, 2025-2035
  • Figure 31: North America Market Attractiveness Analysis by Product
  • Figure 32: North America Market Value Share and BPS Analysis by Capacity, 2025 and 2035
  • Figure 33: North America Market Y to o to Y Growth Comparison by Capacity, 2025-2035
  • Figure 34: North America Market Attractiveness Analysis by Capacity
  • Figure 35: North America Market Value Share and BPS Analysis by End Use, 2025 and 2035
  • Figure 36: North America Market Y to o to Y Growth Comparison by End Use, 2025-2035
  • Figure 37: North America Market Attractiveness Analysis by End Use
  • Figure 38: Latin America Market Value Share and BPS Analysis by Country, 2025 and 2035
  • Figure 39: Latin America Market Value Share and BPS Analysis by Material , 2025 and 2035
  • Figure 40: Latin America Market Y to o to Y Growth Comparison by Material , 2025-2035
  • Figure 41: Latin America Market Attractiveness Analysis by Material
  • Figure 42: Latin America Market Value Share and BPS Analysis by Product, 2025 and 2035
  • Figure 43: Latin America Market Y to o to Y Growth Comparison by Product, 2025-2035
  • Figure 44: Latin America Market Attractiveness Analysis by Product
  • Figure 45: Latin America Market Value Share and BPS Analysis by Capacity, 2025 and 2035
  • Figure 46: Latin America Market Y to o to Y Growth Comparison by Capacity, 2025-2035
  • Figure 47: Latin America Market Attractiveness Analysis by Capacity
  • Figure 48: Latin America Market Value Share and BPS Analysis by End Use, 2025 and 2035
  • Figure 49: Latin America Market Y to o to Y Growth Comparison by End Use, 2025-2035
  • Figure 50: Latin America Market Attractiveness Analysis by End Use
  • Figure 51: Western Europe Market Value Share and BPS Analysis by Country, 2025 and 2035
  • Figure 52: Western Europe Market Value Share and BPS Analysis by Material , 2025 and 2035
  • Figure 53: Western Europe Market Y to o to Y Growth Comparison by Material , 2025-2035
  • Figure 54: Western Europe Market Attractiveness Analysis by Material
  • Figure 55: Western Europe Market Value Share and BPS Analysis by Product, 2025 and 2035
  • Figure 56: Western Europe Market Y to o to Y Growth Comparison by Product, 2025-2035
  • Figure 57: Western Europe Market Attractiveness Analysis by Product
  • Figure 58: Western Europe Market Value Share and BPS Analysis by Capacity, 2025 and 2035
  • Figure 59: Western Europe Market Y to o to Y Growth Comparison by Capacity, 2025-2035
  • Figure 60: Western Europe Market Attractiveness Analysis by Capacity
  • Figure 61: Western Europe Market Value Share and BPS Analysis by End Use, 2025 and 2035
  • Figure 62: Western Europe Market Y to o to Y Growth Comparison by End Use, 2025-2035
  • Figure 63: Western Europe Market Attractiveness Analysis by End Use
  • Figure 64: Eastern Europe Market Value Share and BPS Analysis by Country, 2025 and 2035
  • Figure 65: Eastern Europe Market Value Share and BPS Analysis by Material , 2025 and 2035
  • Figure 66: Eastern Europe Market Y to o to Y Growth Comparison by Material , 2025-2035
  • Figure 67: Eastern Europe Market Attractiveness Analysis by Material
  • Figure 68: Eastern Europe Market Value Share and BPS Analysis by Product, 2025 and 2035
  • Figure 69: Eastern Europe Market Y to o to Y Growth Comparison by Product, 2025-2035
  • Figure 70: Eastern Europe Market Attractiveness Analysis by Product
  • Figure 71: Eastern Europe Market Value Share and BPS Analysis by Capacity, 2025 and 2035
  • Figure 72: Eastern Europe Market Y to o to Y Growth Comparison by Capacity, 2025-2035
  • Figure 73: Eastern Europe Market Attractiveness Analysis by Capacity
  • Figure 74: Eastern Europe Market Value Share and BPS Analysis by End Use, 2025 and 2035
  • Figure 75: Eastern Europe Market Y to o to Y Growth Comparison by End Use, 2025-2035
  • Figure 76: Eastern Europe Market Attractiveness Analysis by End Use
  • Figure 77: East Asia Market Value Share and BPS Analysis by Country, 2025 and 2035
  • Figure 78: East Asia Market Value Share and BPS Analysis by Material , 2025 and 2035
  • Figure 79: East Asia Market Y to o to Y Growth Comparison by Material , 2025-2035
  • Figure 80: East Asia Market Attractiveness Analysis by Material
  • Figure 81: East Asia Market Value Share and BPS Analysis by Product, 2025 and 2035
  • Figure 82: East Asia Market Y to o to Y Growth Comparison by Product, 2025-2035
  • Figure 83: East Asia Market Attractiveness Analysis by Product
  • Figure 84: East Asia Market Value Share and BPS Analysis by Capacity, 2025 and 2035
  • Figure 85: East Asia Market Y to o to Y Growth Comparison by Capacity, 2025-2035
  • Figure 86: East Asia Market Attractiveness Analysis by Capacity
  • Figure 87: East Asia Market Value Share and BPS Analysis by End Use, 2025 and 2035
  • Figure 88: East Asia Market Y to o to Y Growth Comparison by End Use, 2025-2035
  • Figure 89: East Asia Market Attractiveness Analysis by End Use
  • Figure 90: South Asia and Pacific Market Value Share and BPS Analysis by Country, 2025 and 2035
  • Figure 91: South Asia and Pacific Market Value Share and BPS Analysis by Material , 2025 and 2035
  • Figure 92: South Asia and Pacific Market Y to o to Y Growth Comparison by Material , 2025-2035
  • Figure 93: South Asia and Pacific Market Attractiveness Analysis by Material
  • Figure 94: South Asia and Pacific Market Value Share and BPS Analysis by Product, 2025 and 2035
  • Figure 95: South Asia and Pacific Market Y to o to Y Growth Comparison by Product, 2025-2035
  • Figure 96: South Asia and Pacific Market Attractiveness Analysis by Product
  • Figure 97: South Asia and Pacific Market Value Share and BPS Analysis by Capacity, 2025 and 2035
  • Figure 98: South Asia and Pacific Market Y to o to Y Growth Comparison by Capacity, 2025-2035
  • Figure 99: South Asia and Pacific Market Attractiveness Analysis by Capacity
  • Figure 100: South Asia and Pacific Market Value Share and BPS Analysis by End Use, 2025 and 2035
  • Figure 101: South Asia and Pacific Market Y to o to Y Growth Comparison by End Use, 2025-2035
  • Figure 102: South Asia and Pacific Market Attractiveness Analysis by End Use
  • Figure 103: Middle East & Africa Market Value Share and BPS Analysis by Country, 2025 and 2035
  • Figure 104: Middle East & Africa Market Value Share and BPS Analysis by Material , 2025 and 2035
  • Figure 105: Middle East & Africa Market Y to o to Y Growth Comparison by Material , 2025-2035
  • Figure 106: Middle East & Africa Market Attractiveness Analysis by Material
  • Figure 107: Middle East & Africa Market Value Share and BPS Analysis by Product, 2025 and 2035
  • Figure 108: Middle East & Africa Market Y to o to Y Growth Comparison by Product, 2025-2035
  • Figure 109: Middle East & Africa Market Attractiveness Analysis by Product
  • Figure 110: Middle East & Africa Market Value Share and BPS Analysis by Capacity, 2025 and 2035
  • Figure 111: Middle East & Africa Market Y to o to Y Growth Comparison by Capacity, 2025-2035
  • Figure 112: Middle East & Africa Market Attractiveness Analysis by Capacity
  • Figure 113: Middle East & Africa Market Value Share and BPS Analysis by End Use, 2025 and 2035
  • Figure 114: Middle East & Africa Market Y to o to Y Growth Comparison by End Use, 2025-2035
  • Figure 115: Middle East & Africa Market Attractiveness Analysis by End Use
  • Figure 116: Global Market - Tier Structure Analysis
  • Figure 117: Global Market - Company Share Analysis
Dashboard
Dashboard
Dashboard
Dashboard
Dashboard
Dashboard

Full Research Suite comprises of:

Market outlook & trends analysis

Market outlook & trends analysis

Interviews & case studies

Interviews & case studies

Strategic recommendations

Strategic recommendations

Vendor profiles & capabilities analysis

Vendor profiles & capabilities analysis

5-year forecasts

5-year forecasts

8 regions and 60+ country-level data splits

8 regions and 60+ country-level data splits

Market segment data splits

Market segment data splits

12 months of continuous data updates

12 months of continuous data updates

DELIVERED AS:

PDF EXCEL ONLINE

Full Research Suite


$5000

$7500

$10000

Buy Report Now
Similar Industry Reports

Similar Industry Reports

Cryogenic Vials and Tubes Market

Cryogenic Vials and Tubes Market Size and Share Forecast Outlook 2025 to 2035

Cryogenic vial rack Market

Cryogenic vial rack Market

Cryogenic Label Market

Cryogenic Label Market Size and Share Forecast Outlook 2025 to 2035

Cryogenic Temperature Controller Market

Cryogenic Temperature Controller Market Size and Share Forecast Outlook 2025 to 2035

Cryogenic Vaporizer Market

Cryogenic Vaporizer Market Size and Share Forecast Outlook 2025 to 2035

Cryogenic Air Separation Unit Market

Cryogenic Air Separation Unit Market Size and Share Forecast Outlook 2025 to 2035

Cryogenic Freezers Market

Cryogenic Freezers Market Size and Share Forecast Outlook 2025 to 2035

Cryogenic Systems Market

Cryogenic Systems Market Size and Share Forecast Outlook 2025 to 2035

Cryogenic Boxes Market

Cryogenic Boxes Market Size and Share Forecast Outlook 2025 to 2035

Cryogenic Tanks Market

Cryogenic Tanks Market Size and Share Forecast Outlook 2025 to 2035

Cryogenic Ampoules Market

Cryogenic Ampoules Market Size and Share Forecast Outlook 2025 to 2035

Cryogenic Capsules Market

Cryogenic Capsules Market Growth - Demand & Forecast 2025 to 2035

Cryogenic Pump Market

Cryogenic Pump Market Size & Trends 2025 to 2035

Cryogenic Valves Market

Cryogenic Valves Market Growth - Trends & Forecast 2025 to 2035

Cryogenic Insulation Films Market Share Analysis

Competitive Overview of Cryogenic Insulation Films Companies

Cryogenic Label Market Share Analysis

Market Share Distribution Among Cryogenic Label Providers

Cryogenic Insulation Films Market

Cryogenic Insulation Films Market Report – Demand, Trends & Industry Forecast 2025-2035

Cryogenic Ampoules Market Share Analysis

Analyzing Cryogenic Ampoules Market Share & Industry Leaders

Cryogenic Technology Market

Cryogenic Technology Market

Non-Cryogenic Air Separation Unit Market

Non-Cryogenic Air Separation Unit Market Size and Share Forecast Outlook 2025 to 2035

Future Market Insights

Cryogenic Vial Market

Chat With MaRIA

Chat With

MaRIA

Hi There, I am MaRIA, Your Market Research Intelligence Assistant. How may I help you?