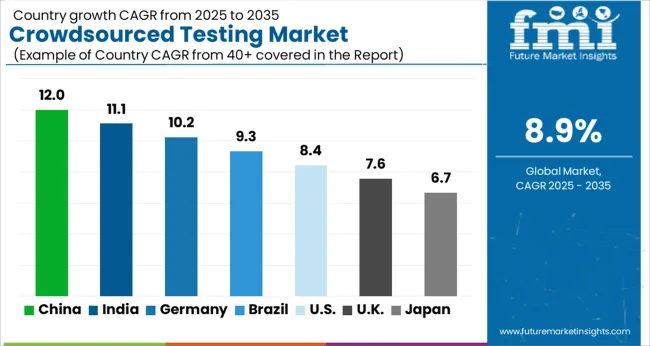
The Crowdsourced Testing Market is estimated to be valued at USD 3.5 billion in 2025 and is projected to reach USD 8.1 billion by 2035, registering a compound annual growth rate (CAGR) of 8.9% over the forecast period.
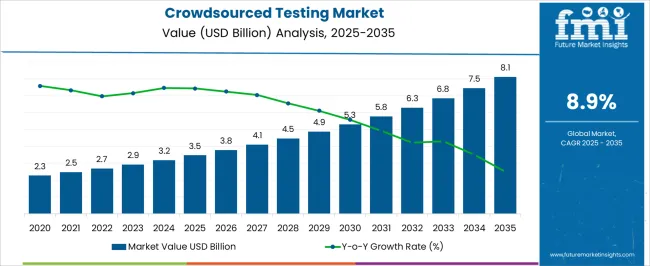
| Metric | Value |
|---|---|
| Crowdsourced Testing Market Estimated Value in (2025 E) | USD 3.5 billion |
| Crowdsourced Testing Market Forecast Value in (2035 F) | USD 8.1 billion |
| Forecast CAGR (2025 to 2035) | 8.9% |
The crowdsourced testing market is expanding steadily, supported by the growing demand for agile quality assurance practices and the rise of digital-first business models. Technology publications and corporate disclosures have emphasized the importance of rapid release cycles, which require scalable and cost-efficient testing solutions beyond in-house teams. Crowdsourced testing platforms have gained traction by providing access to a global tester base, enabling real-time validation across diverse devices, operating systems, and geographies.
The surge in digital commerce, mobile applications, and cloud-based platforms has amplified the need for scalable testing models to ensure seamless user experiences. Additionally, organizations are increasingly focusing on customer-centric development, where crowdsourced testing allows early detection of bugs under real-world conditions.
Investor briefings have highlighted ongoing investments in platform security, tester qualification, and AI-driven test management, which are improving efficiency and reliability. Looking forward, adoption is expected to rise among both large enterprises and SMEs, with growth further propelled by increased platform specialization in performance, functional, and usability testing across websites, mobile apps, and enterprise solutions.
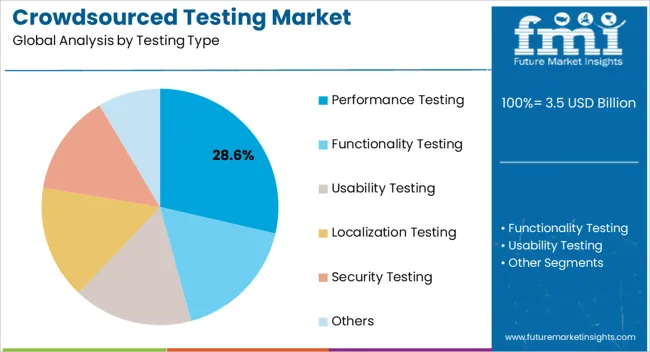
The Performance Testing segment is projected to hold 28.6% of the crowdsourced testing market revenue in 2025, reflecting its critical role in ensuring application stability under varying workloads. Growth in this segment has been driven by the rising importance of load handling, response times, and system resilience in digital platforms. Technology journals have underscored the growing emphasis placed by enterprises on user retention, where application speed and reliability are decisive factors.
Crowdsourced performance testing has been widely adopted as it leverages a global tester base to simulate real-world usage conditions, delivering scalable and cost-effective insights. Organizations have increasingly relied on such testing to identify performance bottlenecks in applications deployed across cloud and hybrid environments.
With digital transformation accelerating across industries, the demand for performance testing is expected to strengthen, as businesses prioritize seamless and uninterrupted customer experiences.
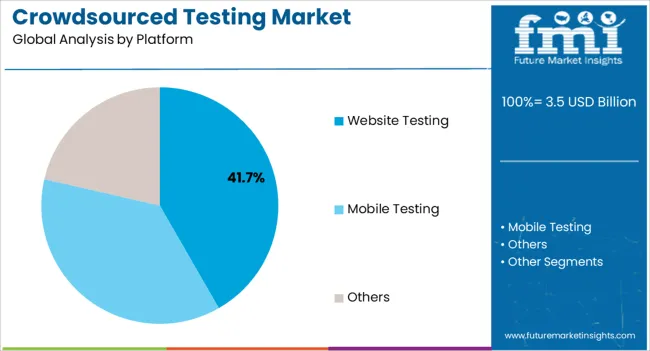
The Website Testing segment is expected to account for 41.7% of the crowdsourced testing market revenue in 2025, maintaining its leading position among platforms. This growth has been driven by the rapid proliferation of e-commerce, online banking, and digital service platforms where consistent functionality and security are essential. Companies have recognized the importance of website testing to validate navigation, compatibility, and performance across multiple browsers and devices.
Crowdsourced testing has proven particularly effective here, as distributed testers replicate real user scenarios across diverse geographies. Annual reports and product announcements from leading digital service providers have highlighted increased investments in website optimization, fueling testing demand.
Additionally, heightened cybersecurity requirements have increased the emphasis on vulnerability assessment within website testing initiatives. As businesses continue to scale digital channels, the Website Testing segment is expected to sustain its leadership in the crowdsourced testing market.
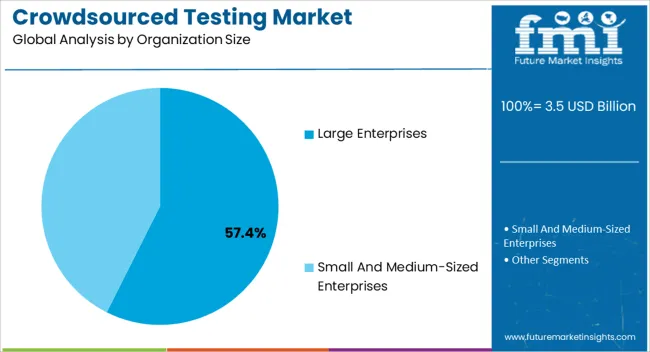
The Large Enterprises segment is projected to contribute 57.4% of the crowdsourced testing market revenue in 2025, establishing itself as the dominant organization size category. Growth of this segment has been influenced by the expansive digital transformation initiatives undertaken by global corporations, which demand robust and scalable testing frameworks. Large enterprises have leveraged crowdsourced testing to supplement in-house QA teams, enabling faster product rollouts and wider coverage across operating environments.
Corporate financial disclosures have pointed to increased technology budgets allocated to quality assurance and customer experience improvements, further driving adoption. Moreover, the complexity of enterprise-grade applications, spanning financial systems, healthcare platforms, and retail solutions, has necessitated rigorous and diversified testing environments that crowdsourced testing uniquely provides.
With their capacity to invest in long-term platform partnerships and specialized testing programs, large enterprises are expected to remain at the forefront of adoption in the crowdsourced testing market.
Future Market Insights’ reveals that website training dominated the crowdsourced testing market in terms of platform segment. Revenue through website testing garnered a CAGR of 7.2% during 2020 to 2025. The anticipated growth rate in the crowdsourced testing market is estimated at 9.3% CAGR over the forecasted period.
In crowdsourced testing, testers from various geographies are required to report on how fast websites or apps load or with issues concerning the defects or bugs found in the software. Moreover, crowdsourced testing allows the testers to work on any digital projects before they go live, such as mobile apps, games, websites, and other software programs.
Digitization has resulted in the adoption of a large number of digital devices, services, applications and operating systems. Therefore, the need to check the quality assurance of software for providing an enriching customer experience has scaled up which has resulted in the growth of the crowdsourced testing market. Therefore, companies are innovating in end-user testing solutions including crowdsourcing testing and gain rapid insights into the areas of digital quality that matter most to them.
Moreover, growth of IoT is likely to increase the crowdsourcing testing market in the forecast period. Key companies involved in IoT are indulging in providing IoT testing services. IoT solutions require a significant amount of product interaction with end users. With this, the necessity for crowdsourcing testing increases. Also, by applying crowdsourcing techniques, the hassles of other issues related to IoT is solved.
The benefit of scaling crowdsourced testing according to the need of the companies gives them an added advantage. Testers are flexible enough to scale up the testing services and businesses could hire crowds on the basis of the demand of their project. Moreover, executing several tests at the same time with the assistance of crowd-sourced testing reduces the time of the market and minimizes the need to invest in permanent quality assurance resources, thereby making crowd-sourced testing economical and cheap.
For instance, a media Giant based in Australia got rescued from the launch of its Dud iOS app through the help of crowdsourced testing. The app was distributed globally through a testing pool and 30 testers from 17 countries found 120 defects. Later after being detected the company was able to launch high-quality, user-friendly functional iOS applications. This signifies how crowdsourced testing can prevent companies from launching defective apps.
For scaling up the quality assurance testing, the crowd testers are in direct touch with the companies’ project and issues. Therefore, concerns for data privacy regulations are likely to hamper the market. Regulations such as General Data Protection Regulation make the crowd testers use test data that doesn’t comply with personal data. Therefore, in order to perform crowdsourcing testing efficiently, obtaining and applying appropriate test data becomes vital.
Moreover, crowdsourced testing comprises of testers from vast geographies. Managing a vast pool of testers becomes a challenge for the growth of the crowdsourcing testing market. Moreover, it is very tough for the testers to find critical bugs from a set of huge software and applications and expand the test coverage. Furthermore, evaluating unique and valid defects mentioned by customers while being consistent throughout the testing process is not possible. This highlights that ensuring thorough testing of the entire product can be significantly difficult even after a large number of testers are deployed for testing.
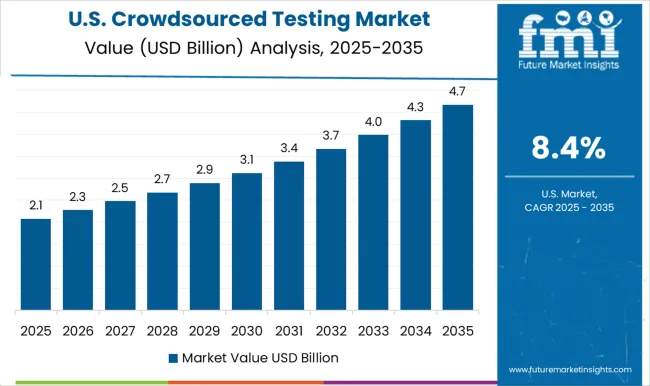
| Country | United States |
|---|---|
| 2025 Value Share in Global Market | 18.4% |
The market for Crowdsourced Testing in the United States is projected to reach a valuation of USD 8.1 billion by 2035. Revenue through crowdsourced testing in United States grew at a CAGR of 8.6% during 2020 to 2025. The United States is a key contributor to the technology development. Increase in the usage of devices necessitates the need for crowdsourced testing in the country. Being a technology hub, companies such as QAwerk have contributed to the market with testing games, mobile, and various desktops applications and websites. Moreover, companies in the United States work with eGovernment, eCommerce, startups, media and entertainment which signifies the demand for crowdsourced testing in the country. Projected growth rate in the Crowdsourced Testing is estimated at 8.3% over the forecasted period of 2025 to 2035. The absolute dollar opportunity growth in Crowdsourced Testing is estimated at USD 726.1 million by 2035.
Website testing dominated the platform segment in the Crowdsourced Testing Market. Market revenue through website testing grew at a CAGR of 8.7% during 2020 to 2025. The projected growth rate of website testing in the market is estimated at 9% over the forecast period. Customers prefer websites that function seamlessly on their phones.
Small issues in the website can lead to a bigger issue when it comes to web applications. Moreover, issues such as delayed response time, and poor usability can be alarming to a website and cause significant losses to a business. Moreover, delaying the testing process can increase the overall cost of resolving the problems. Therefore, website testing is an essential solution to detect core issues from the early phase and ensure that end-users do not face any errors while using the website.
Large enterprises dominated the crowdsourced testing market revenues. Revenue through large enterprises garnered a CAGR of 8.8% during 2020 to 2025. Demand for crowdsourced testing among large enterprises is attributed to attaining a high level of quality assurance to maintain their reputation, strengthen the development process and handle bug-related issues which are critical for large enterprises to stay competitive. For instance, a report of 2020-20 states that on average large enterprises allocate 23% of their annual IT budget towards quality assurance and testing.
The cost of quality assurance and testing is steadily increasing at major corporations. Public opinion of large-scale corporations is likely to rise, with a projected average annual growth rate of 7.9%.
Crowdsourced testing in the Asia Pacific is estimated to comprise a 23.2% market share by 2035. Asia-Pacific offers a lucrative option for the growth of crowdsourced testing due to its cost-effectiveness in providing IT services. The gig economy along with crowd services have already transformed the employment market and the APAC region is no different.
Crowd testing has been a game changer for software testers based in India and other similar developing countries. Moreover, the market in Australia has also witnessed significant growth in the Crowdsourced Testing. Crowdsprint, a professional software testing company based in Australia reported that crowdsourced testing for mobile and web applications from large newspapers and media companies comprised 40% of the Australian market share. Hence, crowdsourced testing has a huge potential in the Asia-Pacific market.
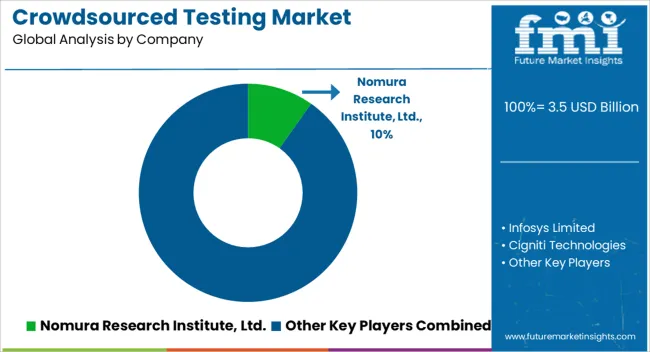
The key companies operating in the crowdsourced testing market include Nomura Research Institute, Ltd., Infosys Limited, Cigniti Technologies, EPAM Systems, Inc., Flatworld Solutions Pvt. Ltd., Test Yantra Software Solutions, Cobalt Labs Inc., Bugcrowd Inc., Qualitrix , Global App Testing, Applause App Quality, Inc., Synack, Testbirds, Rainforest QA, Inc., Digivante Ltd, Testlio Inc., Crowdsprint, MyCrowd, Ubertesters Inc., QA Mentor, Inc., Crowd4Test, TestUnity, usabitest.com, Stardust testing, and ImpactQA.
Some of the recent developments by key providers of the crowdsourced testing market are as follows:
Similarly, recent developments related to companies involved in providing crowdsourced testing solutions have been tracked by the team at Future Market Insights, which is available in the full report.
The global crowdsourced testing market is estimated to be valued at USD 3.5 billion in 2025.
The market size for the crowdsourced testing market is projected to reach USD 8.1 billion by 2035.
The crowdsourced testing market is expected to grow at a 8.9% CAGR between 2025 and 2035.
The key product types in crowdsourced testing market are performance testing, functionality testing, usability testing, localization testing, security testing and others.
In terms of platform, website testing segment to command 41.7% share in the crowdsourced testing market in 2025.


Full Research Suite comprises of:
Market outlook & trends analysis
Interviews & case studies
Strategic recommendations
Vendor profiles & capabilities analysis
5-year forecasts
8 regions and 60+ country-level data splits
Market segment data splits
12 months of continuous data updates
DELIVERED AS:
PDF EXCEL ONLINE
Crowdsourced Security Market Size and Share Forecast Outlook 2025 to 2035
Testing, Inspection & Certification Market Growth – Trends & Forecast 2025 to 2035
5G Testing Market Size and Share Forecast Outlook 2025 to 2035
AB Testing Software Market Size and Share Forecast Outlook 2025 to 2035
5G Testing Equipment Market Analysis - Size, Growth, and Forecast 2025 to 2035
Eye Testing Equipment Market Size and Share Forecast Outlook 2025 to 2035
HSV Testing Market Size and Share Forecast Outlook 2025 to 2035
IoT Testing Equipment Market Size and Share Forecast Outlook 2025 to 2035
HPV Testing and Pap Test Market Size and Share Forecast Outlook 2025 to 2035
GMO Testing Services Market Insights – Food Safety & Regulatory Compliance 2024 to 2034
GMP Testing Services Market
LTE Testing Equipment Market Growth – Trends & Forecast 2019-2027
Drug Testing Systems Market Size and Share Forecast Outlook 2025 to 2035
Sand Testing Equipments Market Size and Share Forecast Outlook 2025 to 2035
Tire Testing Machine Market Size and Share Forecast Outlook 2025 to 2035
Self-Testing Market Analysis - Size, Share, and Forecast 2025 to 2035
Food Testing Services Market Size, Growth, and Forecast for 2025–2035
Bend Testing Machine Market Growth - Trends & Forecast 2025 to 2035
An Analysis of the Leak testing Machine Market by Detectors and Sensors Hardware Type through 2035
Soil Testing Market Growth - Trends & Forecast 2025 to 2035

Thank you!
You will receive an email from our Business Development Manager. Please be sure to check your SPAM/JUNK folder too.
Chat With
MaRIA