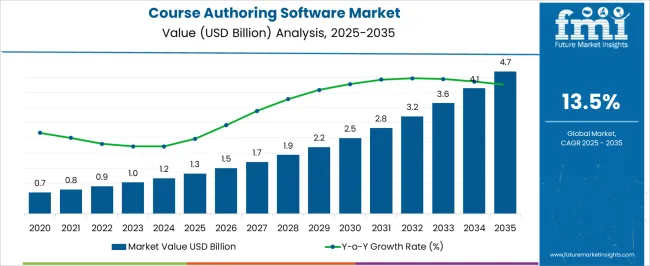
The Course Authoring Software Market is estimated to be valued at USD 1.3 billion in 2025 and is projected to reach USD 4.7 billion by 2035, registering a compound annual growth rate (CAGR) of 13.5% over the forecast period.

| Metric | Value |
|---|---|
| Course Authoring Software Market Estimated Value in (2025 E) | USD 1.3 billion |
| Course Authoring Software Market Forecast Value in (2035 F) | USD 4.7 billion |
| Forecast CAGR (2025 to 2035) | 13.5% |
The course authoring software market is gaining momentum as the digitalization of education and corporate training accelerates. Academic journals and company disclosures have emphasized the growing demand for e-learning platforms that deliver flexibility, scalability, and interactive content creation.
Cloud adoption has transformed the delivery of learning solutions by enabling institutions and enterprises to streamline content development and deployment without heavy infrastructure costs. Increased investment in education technology and workforce reskilling programs has reinforced the role of authoring software as a critical enabler of personalized and adaptive learning experiences.
Furthermore, integration with learning management systems (LMS) and advancements in multimedia tools have expanded the scope of content development, appealing to both educators and instructional designers. Strategic partnerships between software developers and universities, as well as corporate training providers, have strengthened product reach and functionality. Looking ahead, future growth is expected to be shaped by artificial intelligence-driven learning design, immersive technologies such as AR/VR, and heightened demand from emerging markets adopting digital education infrastructure.

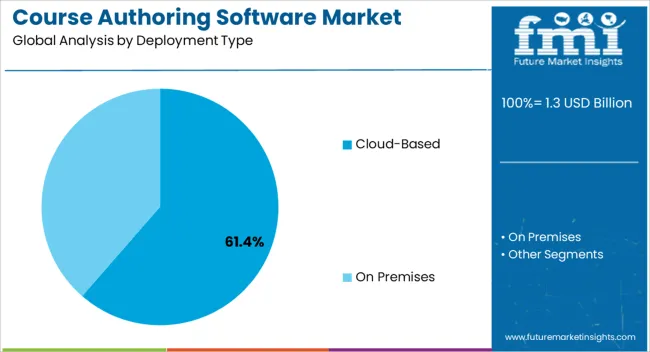
The Cloud-Based segment is projected to hold 61.40% of the course authoring software market revenue in 2025, maintaining its leadership in deployment models. Growth of this segment has been supported by the scalability, cost-efficiency, and accessibility offered by cloud platforms.
Educational institutions and enterprises have increasingly preferred cloud-based solutions as they allow remote collaboration, automatic updates, and integration with other digital learning ecosystems. Industry announcements have highlighted that cloud deployment reduces dependency on local IT infrastructure and enables faster content rollout across geographically dispersed learners.
Additionally, the shift towards hybrid and remote learning environments has reinforced the adoption of cloud-based authoring tools, which can be accessed seamlessly across devices. The ability to store and manage large volumes of multimedia content securely in the cloud has further enhanced its attractiveness. As global education and training sectors continue to prioritize flexible and user-friendly solutions, the Cloud-Based segment is expected to sustain its dominant role in driving market growth.

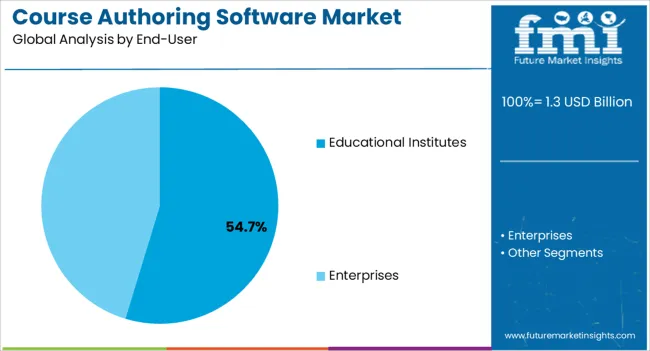
The Educational Institutes segment is projected to contribute 54.70% of the course authoring software market revenue in 2025, establishing itself as the leading end-user category. This segment’s growth has been driven by the increasing reliance on digital tools to design, manage, and deliver curriculum content in schools, colleges, and universities.
Educational organizations have adopted course authoring software to enhance student engagement through interactive modules, gamification, and multimedia integration. Reports from education authorities and institutional strategies have emphasized the importance of digital platforms in supporting blended and online learning programs.
Government initiatives to modernize education systems and expand access to remote learning have further accelerated adoption within this segment. Additionally, partnerships between software providers and universities have created customized solutions tailored to academic needs, supporting faculty in creating content efficiently. With the global education sector undergoing rapid transformation, the Educational Institutes segment is expected to retain its market leadership, supported by continuous investment in e-learning infrastructure and pedagogical innovation.
As per the Course Authoring Software Market research by Future Market Insights - a market research and competitive intelligence provider, historically, from 2020 to 2025, value of the Course Authoring Software Market increased at around 12.0% CAGR. With an absolute dollar opportunity of USD 4.7 billion, the market is projected to reach a valuation of USD 3,820 million by 2035.
Currently, businesses are fast embracing digitalization, which is driving the demand for trainers and education specialists to deliver interactive courses using software that lets students create their own websites, courses, and global positioning systems, among other things. The popularity of the quick authoring process has increased dramatically in recent years. The use of the course authoring software results in less time and money spent on training and more engaging content delivery. Reduced training expenses, greater performance, and content reuse are some of the few advantages offered by these solutions. The market for course authoring software has expanded as a result of the increased need for effective course authoring software brought about by the expansion of e-learning.
Potential drivers of the course authoring software market growth include the growing digitalization of the education industry. For better learning and results, the education industry has largely incorporated Course Authoring Software. For the purpose of teaching and content development, ed-tech businesses, educational institutions, and organizations use gadgets including smart devices, digital interactive displays, tablets, smartphones, VR gadgets, and AR gadgets. The increasing use of digital technology is also being propelled by additional resources including online/e-learning courses, online tests, virtual learning, edutainment, and digital publications.
The opportunities for course authoring software include free content, and peer-to-peer problem solving among others. Course authoring software enables users to develop and contribute content to a shared learning space. Many content management systems (CMS) allow users to contribute and develop content for a shared learning space. These tools typically provide templates or themes to help users create a cohesive and visually appealing learning space, as well as tools to help manage content revisions and approvals. Additionally, many CMSs include social features that allow users to share content with others in the community and collaborate on projects. Some popular CMSs that allow for course authoring include WordPress, Drupal, and Moodle.
The authoring of courses can be a daunting task, especially if there is a lack of requisite knowledge or skills. This is where course authoring software comes in handy. However, there are certain restraints to using such software. If the author is based in a developing nation, the technical workforce required to develop and maintain such software can be quite costly. Additionally, the lack of knowledge about how to use the software can lead to subpar results.
North America leads the global course authoring software market. The investment growth for education technology services and solutions in North America is significantly high due to the existence of course authoring software service providers, smart device producers, cloud service providers, and widespread technological advancements in the field among educational institutions and corporate organizations. In the aftermath of the ongoing pandemic and school closures across major North American countries, the constant implementation of distance learning via online classes and online exams and assessment tools is propelling the growth for learning technology, which is fueling the demand of North America course authoring software market.
In terms of economic growth and the prognosis for the online education business, APAC is a highly dynamic region. The region is particularly distinguished by the presence of numerous developing countries, like China, India, and so many South Asian countries, where investment in the online education industry and Edtech firms is quite significant. Rising urbanization, technology use in the education sector, and a growing number of corporate enterprises is among the key driving factors that make APAC an appealing market for the growth prospects of the course-authoring software industry.
The United States is expected to account for the highest market share of USD 4.7 billion by the end of 2035. The education technology business has been growing at a rapid pace in the United States, owing to the widespread adoption of sophisticated online courses among end users and increased investment and support in Ed-tech start-ups. The country’s significant expenditure on education has been fuelling the growth of course authoring software market.
The cloud-based deployment of course authoring software is expected to account for a CAGR of 13.8% by the end of 2035. Over the last several years, there has been an increase in demand for cloud-based services and cloud computing globally. One of the key aspects propelling cloud-based solutions across the education sector and business space globally is the use of cutting-edge technical solutions, improved services, and operational productivity. These software options provide ed-tech institutions with clear scalability and a flexible user interface, enabling them to lower overall costs and operational hazards. Numerous industry verticals are integrating cloud services into their corporate operations due to benefits including simple algorithms, changing cloud architecture, user-based billing, high security, regular data backups, and quick implementation.
In 2025, the Educational Institutes sector had the greatest market share among the End User Type. It is expected to have a 13.6% CAGR for the forecasted period in the global market. The need for course authoring software within educational institutions is being greatly fueled by the growth in the number of universities, colleges, and medical labs as well as the trend toward e-learning. The increased requirement for training as a result of the introduction of new innovative techniques and technologies is another factor driving demand in the enterprise category.

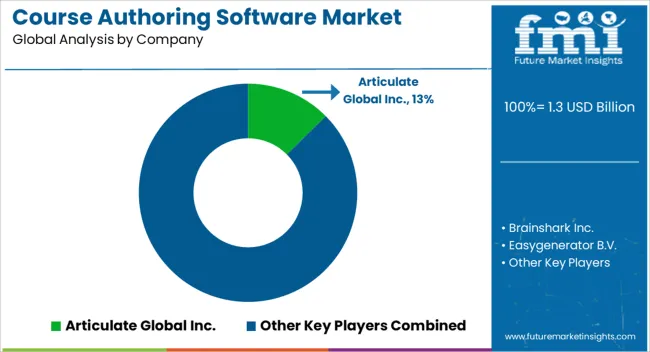
To keep an existing position in the course authoring software market, players that operate in it focus on techniques including market initiatives, mergers, and product launches. Some of the major companies like Articulate Global Inc., Brainshark Inc., Easygenerator B.V., Elucidat, iSpring Solutions, Inc., LearnWorlds Ltd, Lessonly, Inc., SAP Litmos, Adobe Inc., and Instructure Inc. are featured in the report.
Some of the recent developments for the Course Authoring Software Market are:
Similarly, more recent developments related to companies in Course Authoring Software Market services have been tracked by the team at Future Market Insights, which are available in the full report.
The global course authoring software market is estimated to be valued at USD 1.3 billion in 2025.
The market size for the course authoring software market is projected to reach USD 4.7 billion by 2035.
The course authoring software market is expected to grow at a 13.5% CAGR between 2025 and 2035.
The key product types in course authoring software market are cloud-based and on premises.
In terms of end-user, educational institutes segment to command 54.7% share in the course authoring software market in 2025.


Full Research Suite comprises of:
Market outlook & trends analysis
Interviews & case studies
Strategic recommendations
Vendor profiles & capabilities analysis
5-year forecasts
8 regions and 60+ country-level data splits
Market segment data splits
12 months of continuous data updates
DELIVERED AS:
PDF EXCEL ONLINE
Golf Course Maintenance Robot Market Size and Share Forecast Outlook 2025 to 2035
Massive Open Online Course Market Analysis – Growth, Trends & Forecast 2025 to 2035
Collaborative Authoring Tools Market Size and Share Forecast Outlook 2025 to 2035
Software Defined Vehicle Market Size and Share Forecast Outlook 2025 to 2035
Software Defined Networking (SDN) And Network Function Virtualization (NFV) Market Size and Share Forecast Outlook 2025 to 2035
Software Defined Perimeter (SDP) Market Size and Share Forecast Outlook 2025 to 2035
Software-Defined Wide Area Network SD-WAN Market Size and Share Forecast Outlook 2025 to 2035
Software Defined Radio (SDR) Market Size and Share Forecast Outlook 2025 to 2035
Software License Management (SLM) Market Size and Share Forecast Outlook 2025 to 2035
Software-Defined Networking SDN Market Size and Share Forecast Outlook 2025 to 2035
Software-Defined Anything (SDx) Market Size and Share Forecast Outlook 2025 to 2035
Software-Defined Data Center Market Size and Share Forecast Outlook 2025 to 2035
Software Containers Market Size and Share Forecast Outlook 2025 to 2035
Software Defined Application And Infrastructure Market Size and Share Forecast Outlook 2025 to 2035
Software Defined Networking Market Size and Share Forecast Outlook 2025 to 2035
Software-Defined Camera (SDC) Market Size and Share Forecast Outlook 2025 to 2035
Examining Market Share Trends in the Software Distribution Industry
Software Distribution Market Analysis by Deployment Type, by Organization Size and by Industry Vertical Through 2035
Software-Defined WAN Market - Growth & Forecast through 2034
Software Defined Video Networking Market

Thank you!
You will receive an email from our Business Development Manager. Please be sure to check your SPAM/JUNK folder too.
Chat With
MaRIA