The Cotton Candy Maker Market is estimated to be valued at USD 124.9 billion in 2025 and is projected to reach USD 195.8 billion by 2035, registering a compound annual growth rate (CAGR) of 4.6% over the forecast period.
The Cotton Candy Maker market is experiencing steady growth driven by increasing demand for home entertainment and recreational appliances. The future outlook for this market is influenced by the rising trend of experiential cooking and at-home culinary activities, which are becoming popular among families and younger consumers. Growing awareness about fun and engaging cooking experiences is fostering interest in small kitchen appliances, particularly those that can create interactive treats.
Continuous innovation in appliance design, safety features, and ease of use has further enhanced consumer adoption. Additionally, the increasing penetration of e-commerce platforms is making these products more accessible, allowing consumers to purchase them conveniently online.
The market is also benefiting from the seasonal demand during festivals, parties, and special occasions, which encourages sales of Cotton Candy Makers in both developed and emerging regions With consumers prioritizing leisure activities at home and seeking unique food experiences, the market is expected to maintain a positive growth trajectory over the coming years.
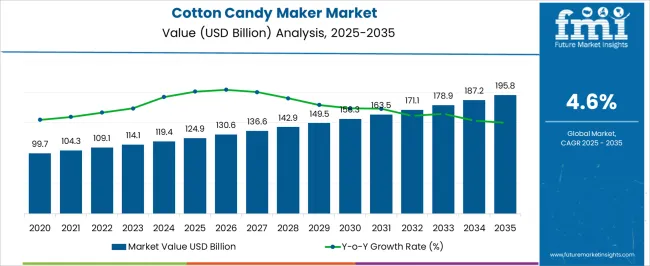
| Metric | Value |
|---|---|
| Cotton Candy Maker Market Estimated Value in (2025 E) | USD 124.9 billion |
| Cotton Candy Maker Market Forecast Value in (2035 F) | USD 195.8 billion |
| Forecast CAGR (2025 to 2035) | 4.6% |
The market is segmented by Product, Application, and Sales Channel and region. By Product, the market is divided into Big Size and Small Size. In terms of Application, the market is classified into Household and Commercial. Based on Sales Channel, the market is segmented into Online Retailers, Supermarket/Hypermarket, Specialty Stores, Wholesalers/Distributors, and Convenient Stores. Regionally, the market is classified into North America, Latin America, Western Europe, Eastern Europe, Balkan & Baltic Countries, Russia & Belarus, Central Asia, East Asia, South Asia & Pacific, and the Middle East & Africa.
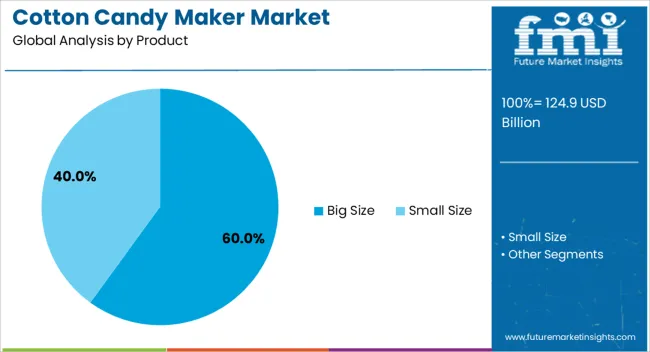
The big size product segment is projected to hold 60.00% of the Cotton Candy Maker market revenue share in 2025, making it the leading product type. The growth of this segment has been driven by its ability to produce larger quantities of cotton candy, which meets the needs of gatherings, events, and family entertainment. Enhanced functionality, durability, and ease of operation have made big size appliances a preferred choice for consumers who value performance and convenience.
The segment has also benefited from improvements in heating technology and sugar-spinning mechanisms, which ensure consistent product quality. Consumer preference for interactive and engaging cooking experiences has reinforced the adoption of big size cotton candy makers.
The widespread availability of these products through multiple sales channels has further supported their market dominance Overall, the combination of scalability, performance, and entertainment value has solidified the big size product segment as a leading revenue contributor in the Cotton Candy Maker market.
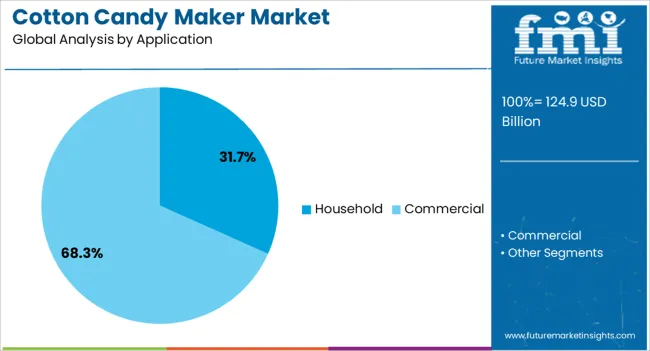
The household application segment is expected to capture 31.70% of the Cotton Candy Maker market revenue share in 2025, establishing it as the leading application category. Growth in this segment is influenced by the increasing interest in home-based cooking and entertaining activities. Cotton Candy Makers are being adopted as tools for creating fun and engaging culinary experiences for families, children, and social gatherings.
The ease of use, safety features, and compact design of modern appliances have made them suitable for domestic environments. Additionally, rising disposable incomes and consumer willingness to spend on lifestyle-enhancing products have contributed to the prominence of the household application segment.
Seasonal celebrations and festive occasions further drive demand within households, reinforcing the segment’s market share The continued focus on convenience, experiential food preparation, and interactive home entertainment supports the sustained growth of the household application category.
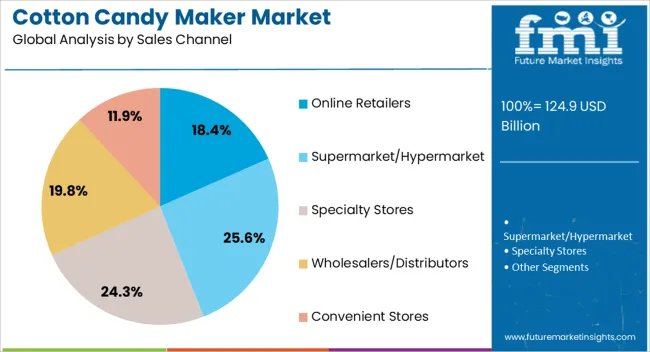
The online retailers sales channel segment is projected to account for 18.40% of the Cotton Candy Maker market revenue in 2025, making it a leading distribution route. Growth in this segment is driven by the increasing adoption of e-commerce platforms, which offer consumers convenient access to a wide variety of products. Online retail enables detailed product information, reviews, and competitive pricing, which influence purchase decisions.
The ability to reach consumers across urban and remote areas has expanded the market penetration of cotton candy makers. Additionally, promotional campaigns, digital marketing, and fast delivery services offered by online retailers enhance the customer experience and support higher sales volumes.
The flexibility and accessibility of online purchasing have made it an attractive option for consumers seeking convenient solutions for home-based entertainment products As e-commerce continues to expand globally, the online retailers segment is expected to maintain a significant contribution to market revenue.
Seasonal and Limited-edition Release Create a Buzz in the Market
The buzz heightens as cotton candy businesses make special versions for different times of the year. They tend to create flavors and designs specifically for Halloween, Christmas, and Valentine's Day. These special cotton candies get people excited and eager to buy them. It helps the companies sell more and become more popular.
By making cotton candy that fits with the seasons and holidays, they're making more money and getting people talking about them. This ultimately creates more demand for cotton candy makers. Like, PEEPS® relaunched its cotton candy-flavored marshmallow chicks in January 2025. The product was launched as part of a vibrant lineup of Chicks and Bunnies offered by the brand.
eCommerce Growth is the Shining Star When it Comes to Sales
The way people buy has changed a lot because of online shopping. Now, one can easily find and buy these machines from anywhere on websites like Amazon or eBay. This has made it easier for fans of cotton candy, people starting businesses, or just regular people to get their hands on one.
Online shopping is handy because it's easy to compare prices. Cotton candy machines, of course, get delivered right to the doorstep, which is a plus. This shift to online shopping is a big reason why the cotton candy businesses are benefiting.
Innovations Give Rise to New Robotic and Automatic Machines
Smart and automatic cotton candy machines are changing how cotton candy is made. They have new features like precise control, automation, sensors, and data analysis. These machines make it easier to make lots of cotton candy quickly and consistently. They can adjust things like temperature and spinning speed automatically, so the candy comes out perfect every time. Plus, they can send alerts if something goes wrong.
With robotic machines, operators can manage everything remotely, making production smoother and customer service better. Like, at CES 2025, Sweet Robo machines were featured. The machine spins cotton candy in about two minutes. These vending machines have 30 customizable designs and four flavors and colors.
| Segment | Household (Application) |
|---|---|
| Value Share (2025) | 31.70% |
The household application segment holds the leading cotton candy maker market shares in 2025. More families are enjoying home entertainment and doing activities themselves. Home cotton candy makers are getting popular because they let families make fluffy cotton candy at home. With this, they don’t have to go to fairs or even outside their homes.
Making cotton candy together is a fun activity, where parents and kids can try different flavors and colors. People use them for special occasions like birthdays or holidays, adding a fun touch to parties. These machines make it simple for families to have fun making and enjoying cotton candy together at home. This raises their applications in households.
| Segment | Online Retailers (Sales Channel) |
|---|---|
| Value Share (2025) | 18.40% |
The online retailers sales channel segment holds the leading cotton candy maker market shares in 2025. Buying these machines online is super easy and convenient. There are lots of options to choose from. Also, one can read reviews, and choose the perfect product for their suiting.
Online stores have a huge variety of machines from different brands and price ranges. Plus, anyone can shop anytime they want. Day or night, and getting the order delivered quickly to the doorstep is super easy now. It's a great way to save time and find the best cotton candy maker without any hassle.
| Countries | Value CAGR (2025 to 2035) |
|---|---|
| United States | 2.80% |
| Germany | 3.40% |
| China | 11.10% |
| India | 12.10% |
| Australia | 5.10% |
Regional market dynamics and growth prospects for cotton candy maker industry in North America indicate expansion at a 2.80% CAGR in the United States till 2035. Social media influencers and viral marketing are making these machines more popular. This is especially evident among younger people, which is causing more sales.
People now prefer spending money on experiences rather than just things, and these machines offer a fun experience at home. One can buy them not only in stores but also online, making them easier to find. Plus, new features like smart controls and customizable settings make them even more appealing. All these factors are making cotton candy makers a big hit and boosting the market.
Gold Medal Products Co. is a leading manufacturer in the United States. The company focuses on product innovation. It increases its visibility using advertising and marketing campaigns.
The demand for cotton candy makers in Germany will rise at a 3.40% CAGR until 2035. In Germany, people are getting more interested in fun treats like cotton candy. This is because they're into trying new things and having unique experiences. Cotton candy fits well with this trend because it's fun and different from usual desserts.
There's also a growing interest in high-quality, handcrafted foods, and cotton candy machines offering fancy flavors and ingredients are becoming sought after. At street food events, cotton candy is a hit, especially if it's made with eco-friendly materials, which is important to many Germans who care about their health and the environment.
Clatronic International GmbH is known for its innovative designs in the German market. The company expands its presence in Europe through alliances with retailers and distributors.
Industry trends in cotton candy machines indicate expansion at an 11.10% CAGR in China till 2035. In China, people are getting into Western trends, including enjoying treats like cotton candy. Social media, like WeChat and Douyin, is a big influence, with popular users shaping what people like.
As people have more money to spend on fun stuff, cotton candy machines are becoming popular for parties and outings. Also, places like hotels and theme parks are adding cotton candy stations to attract visitors. So, cotton candy machines are getting popular in China because people there want to try new things and have fun experiences, just like in the West.
Guangdong Papa Industrial Co. Ltd. is a leading cotton candy maker manufacturer in China. These companies use economies of scale for cost leadership. It invests in automation and technology for production efficiency.
The demand for cotton candy makers in India will amplify at a 12.10% CAGR until 2035. In India, people love celebrating festivals with sweet treats, and cotton candy fits right in with its fun colors and playful vibe. As cities grow, places like malls and amusement parks are becoming popular hangout spots, and cotton candy machines add to the fun there.
Young Indians are also into trendy Western food, and cotton candy is catching on as a cool dessert to share on social media. Plus, at events like weddings, cotton candy stations are a hit. With more people having money to spend on fun stuff, cotton candy machines are becoming popular for home parties too. These factors foster the market in India.
The cotton candy maker market growth in Australia is estimated at a 5.10% CAGR until 2035. In Australia, cotton candy machines are becoming more popular for a few reasons. Firstly, because outdoor events like festivals and markets are common, and cotton candy is a hit with people of all ages there. Also, places like hotels and theme parks often have cotton candy stations for guests, so there's demand for makers to supply these.
With the country's diverse population, vendors are getting creative with flavors inspired by different cuisines. And, with the rise of food trucks and pop-up events, cotton candy machines have more chances to showcase their products and cater to people looking for fun food experiences.
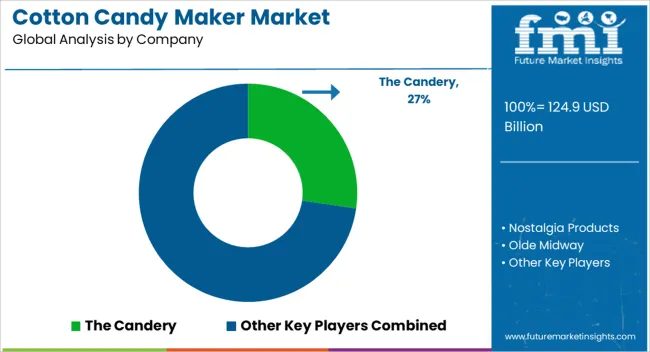
The cotton candy maker industry is highly competitive, with established companies getting the most from their reputations and distribution networks, while startups and niche competitors prioritize innovation and specialized services.
Technological improvements, changing customer tastes, and marketing methods all fuel competition. Companies compete for market share by differentiating their products, implementing cost strategies, and establishing successful distribution networks.
Recent Developments
The global cotton candy maker market is estimated to be valued at USD 124.9 billion in 2025.
The market size for the cotton candy maker market is projected to reach USD 195.8 billion by 2035.
The cotton candy maker market is expected to grow at a 4.6% CAGR between 2025 and 2035.
The key product types in cotton candy maker market are big size and small size.
In terms of application, household segment to command 31.7% share in the cotton candy maker market in 2025.


Full Research Suite comprises of:
Market outlook & trends analysis
Interviews & case studies
Strategic recommendations
Vendor profiles & capabilities analysis
5-year forecasts
8 regions and 60+ country-level data splits
Market segment data splits
12 months of continuous data updates
DELIVERED AS:
PDF EXCEL ONLINE
Examining Market Share Trends in the Cotton Candy Maker Industry
USA Residential Cotton Candy Maker Market Size and Share Forecast Outlook 2025 to 2035
Cotton Bags Market Size and Share Forecast Outlook 2025 to 2035
Cotton Processing Equipment Market Size and Share Forecast Outlook 2025 to 2035
Cottonseed Meal Market Analysis by Product Type, Nature and End Use Industry Through 2025 to 2035
Cottonseed Oil Market Analysis – Size, Share & Forecast 2025-2035
Cottonseed Hulls Market Analysis by Form, End Use, and Region through 2025 to 2035
Cotton Candy Machines Market - Fluffy & Sweet Treats 2025 to 2035
Poly Cotton Market Growth - Trends & Forecast 2025 to 2035
Poly Cotton Fabric Market Growth - Trends & Forecast 2025 to 2035
Natural Cotton Extract Market - Trends & Forecast 2025 to 2035
Global Candy and Twisting Paper Market Analysis – Growth & Forecast 2024-2034
Candy Wrapping Machine Market
Diet Candy Market Growth & Demand 2025 to 2035
Licorice Candy Market Analysis - Size, Share & Forecast 2025 to 2035
Sugar Free Candy Market Trends - Innovations & Demand 2025 to 2035
Non-Chocolate Candy Market
Ice Maker Machines Market
Soda Maker Market Size and Share Forecast Outlook 2025 to 2035
Cocoa Maker Market Size, Growth, and Forecast 2025 to 2035

Thank you!
You will receive an email from our Business Development Manager. Please be sure to check your SPAM/JUNK folder too.
Chat With
MaRIA