The Personal Care Ingredient Market is estimated to be valued at USD 14.3 billion in 2025 and is projected to reach USD 21.9 billion by 2035, registering a compound annual growth rate (CAGR) of 4.4% over the forecast period.
The Personal Care Ingredient market is experiencing consistent growth driven by the increasing demand for high-performance and safe ingredients in skincare, haircare, and other personal care products. The market is being shaped by rising consumer awareness about product safety, natural and sustainable formulations, and efficacy, which is influencing product development strategies of manufacturers. Growing disposable incomes, evolving beauty standards, and a focus on self-care are driving higher adoption of personal care products globally.
Technological advancements in ingredient formulation, coupled with stringent regulatory compliance for safety and quality, are creating opportunities for innovation. Additionally, the increasing preference for natural and multifunctional ingredients has accelerated demand across regions, supporting market expansion.
With consumers seeking targeted solutions for skin and hair concerns, the integration of advanced ingredients into personal care products is further propelling growth As the trend towards personalized and eco-conscious formulations continues, the market is expected to witness sustained growth across both developed and emerging economies.
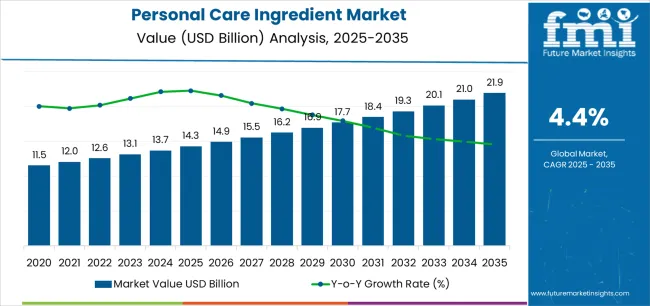
| Metric | Value |
|---|---|
| Personal Care Ingredient Market Estimated Value in (2025 E) | USD 14.3 billion |
| Personal Care Ingredient Market Forecast Value in (2035 F) | USD 21.9 billion |
| Forecast CAGR (2025 to 2035) | 4.4% |
The market is segmented by Product Type, Ingredients, and Application and region. By Product Type, the market is divided into Conditioning Polymers, Emollients, Surfactants, Rheology Modifiers, UV Absorbers, Emulsifiers, Antimicrobials, and Others. In terms of Ingredients, the market is classified into Natural and Synthetic. Based on Application, the market is segmented into Skincare, Make-Up, Oral Care, Hair Care, Toiletries, and Others. Regionally, the market is classified into North America, Latin America, Western Europe, Eastern Europe, Balkan & Baltic Countries, Russia & Belarus, Central Asia, East Asia, South Asia & Pacific, and the Middle East & Africa.
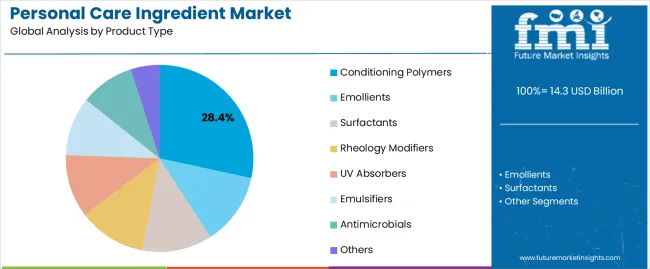
The conditioning polymers product type segment is projected to hold 28.4% of the Personal Care Ingredient market revenue share in 2025, making it a leading product type. The growth of this segment has been driven by the increasing demand for hair and skin conditioning solutions that enhance product performance and sensory experience.
Conditioning polymers provide benefits such as improved texture, moisturization, and manageability in personal care formulations, which have been highly valued by consumers. The segment has benefited from technological innovations that allow polymers to be incorporated into a wide range of product formats, including shampoos, conditioners, and skincare products, without compromising stability or efficacy.
Rising awareness about ingredient quality, multifunctionality, and sustainability has also supported adoption, particularly in premium and mass-market products The robust demand for conditioning polymers is reinforced by their ability to deliver consistent results, compatibility with natural ingredients, and adaptability to diverse formulations, making them a preferred choice among personal care manufacturers.
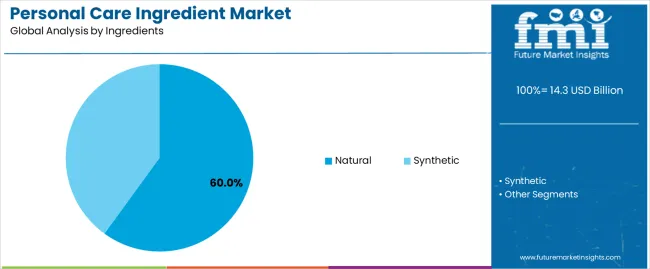
The natural ingredients segment is expected to account for 60.0% of the Personal Care Ingredient market revenue share in 2025, highlighting its dominant role in product formulations. Growth in this segment has been driven by increasing consumer preference for clean, safe, and environmentally sustainable ingredients in personal care products. Rising concerns over synthetic chemicals and potential adverse effects have prompted manufacturers to incorporate natural and plant-derived ingredients to meet consumer expectations.
Natural ingredients are valued for their multifunctional properties, including moisturization, anti-aging, and soothing effects, which enhance the appeal of formulations. Additionally, the focus on sustainability, ethical sourcing, and eco-friendly production processes has accelerated adoption across both premium and mass-market segments.
The segment is further supported by regulatory encouragement for natural formulations and growing awareness campaigns highlighting the benefits of botanical and naturally derived ingredients As consumers continue to prioritize wellness and conscious beauty choices, the demand for natural ingredients is expected to remain strong, sustaining its leading position in the market.
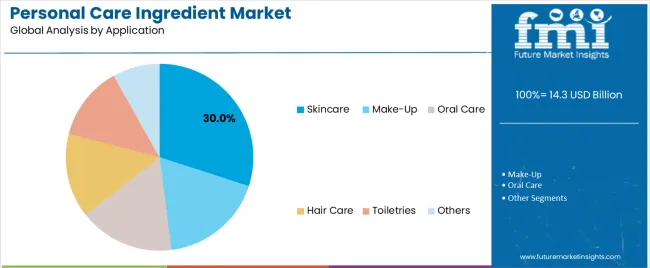
The skincare application segment is anticipated to capture 30.0% of the Personal Care Ingredient market revenue in 2025, positioning it as a leading application area. This growth has been driven by the increasing focus on skin health, anti-aging, and cosmetic benefits, which has heightened consumer demand for effective skincare products. Ingredients that provide hydration, protection, and repair functions have been particularly sought after, supporting the integration of advanced polymers and natural actives into formulations.
The rise in skincare routines, growing e-commerce penetration, and personalized beauty solutions have further accelerated market adoption. Manufacturers are investing in research and development to create formulations that are gentle yet effective, aligning with consumer expectations for multifunctional and sustainable ingredients.
The segment’s growth is reinforced by the global emphasis on wellness, rising consumer spending, and the proliferation of innovative product formats that enhance the user experience As a result, the skincare application segment continues to lead revenue share in the Personal Care Ingredient market.
The section offers enterprises insightful data and analysis of the two leading segments. Segmentation of these categories assists companies to gain a better understanding of the dynamics and invest in the beneficial zones.
Analysis of the growth outlook assists organizations to attain a better understanding of the trends, opportunities, and challenges. This examination is likely to assist them in navigating the complex business environment and making informed decisions.
In terms of product type, conditioning polymers are anticipated to account for a value share of 28.4% in 2025. Skincare is projected to emerge as the dominating application with a value share of 33.7% in the same year.
| Segment | Conditioning Polymers (Product Type) |
|---|---|
| Value Share (2025) | 28.4% |
The conditioning polymer segment is predicted to witness a CAGR of 4.1% from 2025 to 2035. This surging demand is likely to be propelled by increasing consumer preference for hair care products that offer enhanced manageability, smoothness, and frizz control. The growing popularity of multifunctional personal care products is also a key factor pushing sales.
The rising trend of premium and natural hair care products, advancements in polymer technology, and growing awareness of hair health and maintenance among millennials and Generation Z are other prominent factors pushing demand. Increased marketing efforts by renowned brands and the wide availability of products through online retail channels further drive demand.
| Segment | Skin Care (Application) |
|---|---|
| Value Share (2025) | 33.7% |
The skincare application segment is projected to hold a value share of 33.7% in 2025 owing to the growing consumer focus on maintaining healthy and youthful skin. Increased awareness of the harmful effects of pollution and UV radiation is driving the need for personal care products with protective and anti-aging properties.
The rise of social media and beauty influencers has amplified the importance of skincare routines, encouraging the use of a variety of specialized products. The trend toward natural and organic ingredients also boosts the skincare segment, as consumers seek safe and effective solutions for specific skin concerns.
The table below showcases a comparative assessment of the variation in the anticipated CAGR for the personal care ingredient industry over the semi-annual periods spanning from the base year (2025) to the current year (2025). The analysis exhibits shifts in the performance of the industry and divulges its revenue realization patterns.
The analysis helps businesses in attaining a better understanding of the industry and its growth trajectory over the year. The first half of the year, or H1, spans from January to June. The second half, H2, includes the months from July to December.
In the first half (H1) of 2025 to 2035, the industry is projected to surge at a CAGR of 4.2%, followed by a noticeable spike in the growth rate during the second half (H2), where the CAGR is anticipated to be 4.4%.
| Particular | Value CAGR |
|---|---|
| H1 | 4.2% (2025 to 2035) |
| H2 | 4.4% (2025 to 2035) |
| H1 | 4.5% (2025 to 2035) |
| H2 | 4.7% (2025 to 2035) |
Moving in the subsequent period, from H1 2025 to H2 2035, the CAGR is projected to slightly increase to 4.5% in the first half and then further surge to 4.7% in the second half. In the first half (H1), the industry saw an increase of 30 BPS, while in the second half (H2), it experienced a similar surge of 30 BPS.
Rise of Sustainable Beauty Formulations like Concentrated Shampoos Boosts Demand
Climate change and its repercussions are increasingly dominating public discourse. Consumers are, therefore, demonstrating a growing awareness of environmental issues and seeking sustainable alternatives across various industries, including beauty and personal care products. In response to this rising concern, there has been a significant surge in demand for sustainable beauty formulations.
One notable trend in the field of personal care is the increasing popularity of concentrated shampoos. These shampoos contain less water compared to traditional formulations.
By reducing water content, concentrate shampoos not only minimize packaging waste but also require less energy for transportation and production. This shift toward such shampoos aligns with consumers' desire to minimize their environmental footprint while still maintaining their personal care routine.
Concentrated shampoos typically come in small and compact packaging, further reducing their environmental impact. These formulations offer consumers a practical and eco-conscious solution without compromising on product efficacy or performance.
The rise of sustainable beauty formulations, such as concentrated shampoos, reflects a broader shift toward environmentally responsible consumption habits. As consumers increasingly prioritize sustainability in their purchasing decisions, the personal care industry is evolving to meet these demands, paving the way for a sustainable and eco-friendly future.
Increasing Promotional Activities in Emerging Countries Bolster Demand
Increasing advertisements and promotional activities have LED to consumer awareness about several beauty products available in the market. This is propelling the demand for unique beauty products across developed and developing countries.
Advertisements highlighting the hazards of over-exposure to UV rays have resulted in a significant increase in demand for sun protection products. As a result, the need for various cosmetics ingredients such as UV absorbers is expected to surge in the future.
Economic development, increasing per capita income, improving standards of living, changing lifestyle, and rising spending on personal care products, especially cosmetics, is driving growth of the overall cosmetics sector globally.
Consumers in Western European and North American countries tend to spend more on cosmetics than their counterparts in other regions. Emerging economies, however, are set to have a high potential in terms of consumer spending on cosmetics in the next ten years.
Increasing urbanization is one of the prominent factors attributed to the growth of a country’s economy. Several countries in Asia Pacific and Latin America are witnessing rapid urbanization. For instance, around 85% of the population in Brazil resides in urban areas, while this figure stands at 54% in China and 85% in the United Arab Emirates. These countries are set to represent high-potential opportunities for cosmetics during the forecast period.
Increasing Interest of Consumers in Premium Cosmetics Accelerating Sales
The global cosmetics ingredient industry is witnessing robust expansion driven by several key factors. Continuous innovation and the introduction of enhanced products have fueled consumer interest and demand for unique cosmetics ingredients. Manufacturers are investing in research and development to create innovative formulations that offer superior performance, efficacy, and safety.
There is a notable shift in consumer preferences toward premium cosmetics, which has further accelerated growth. Countries like the United States, Brazil, Germany, and Russia have emerged as significant markets for premium cosmetic products, driving the adoption of cosmetics ingredients in high-end formulations.
The projected surge of around 20% to 25% in revenue contribution from premium cosmetic products over the next five years underscores the significant growth potential of the cosmetics ingredient market. This anticipated growth trajectory is set to be sustained by the continued demand for premium cosmetics globally.
It further drives the need for high-quality and innovative ingredients to meet consumer expectations. The combination of continuous innovation, increasing demand for premium cosmetics, and the utilization of ingredients in advanced formulations is driving the expansion of the global market.
Health Risks Related to Petrochemical-derived Ingredients May Hamper Growth
The personal care ingredient industry faces significant restraints due to environmental and health concerns associated with petrochemical-derived ingredients. These chemicals undergo various processes that release toxic wastes and gases, contributing to pollution and potential health risks.
Government agencies such as the United States Environmental Protection Agency (USEPA) and the Registration, Evaluation, Authorization, and Restriction of Chemicals (REACH) in Europe are imposing stringent regulations. These regulatory bodies are tasked with mapping and monitoring the toxicity levels of chemicals used in personal care products and ensuring they remain within permissible limits.
Their regulations mandate rigorous testing, reporting, and compliance requirements for manufacturers, which can be costly and time-consuming. Considering that synthetic personal care ingredients represent a significant portion of the business, these stringent regulations can stifle growth by limiting the use of certain chemicals and imposing high production costs.
The need to comply with these regulations can slow down the introduction of new products, as companies must ensure their formulations meet all safety and environmental standards. While these regulations are essential for protecting public health and the environment, they pose a considerable challenge to the growth of the personal care ingredient industry, particularly for synthetic ingredients.
The global personal care ingredient market registered a CAGR of 2.1% during the historical period ranging from 2020 to 2025. It was valued at USD 13,100 million in 2025.
During the historical period, the industry experienced significant fluctuations due to economic qualms. The global economy encountered numerous challenges, including trade disputes, currency fluctuations, and geopolitical conflicts. These trials further impacted those end-use industries dependent on these compounds.
The COVID-19 pandemic disrupted global supply chains and industrial activities, leading to a temporary downturn. Supply chain disruptions affected raw material availability and manufacturing operations, thereby impacting the dynamics. The pandemic, however, also highlighted the importance of personal care ingredients in healthcare products, disinfectants, and pharmaceuticals, leading to increased demand in these specific segments.
The personal care ingredient market is projected to reach a value of USD 13,643.4 million in 2025. It is set to surge at a CAGR of 4.6% through the forecast period and attain a size of USD 21,416.2 million by 2035.
Demand for end-products, including toiletries and personal hygiene items, is set to increase during the forecast period owing to shifting focus toward health concerns. The global market is poised for significant growth, propelled by booming industrial activities in key countries such as India, China, and Brazil.
Growth is likely to surge at a rapid pace owing to plant expansions and digitalization of key brands. The post-COVID recovery across industries is set to provide a positive thrust to the worldwide.
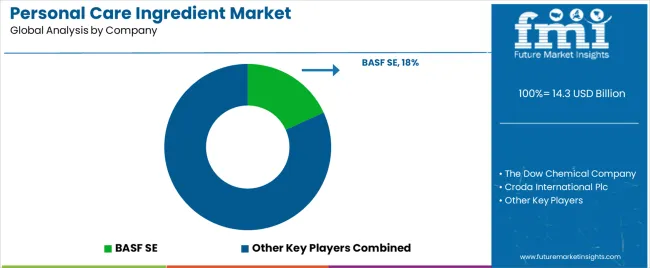
Tier 1 companies include leaders with annual revenue exceeding USD 10,000 million. These companies currently capture a significant global share of 20% to 25%. These businesses are often characterized by high production capacity and a wide product portfolio.
They are distinguished by extensive expertise in manufacturing and a broad geographical reach that is underpinned by a robust consumer base. These organizations provide a wide range of products and deploy the latest technology to meet regulatory standards. Prominent companies within Tier 1 include BASF, The Dow Chemical Company, Solvay, and Evonik among others.
Tier 2 companies encompass mid-sized players with revenue ranging from USD 3,000 to 10,000 million. They have a presence in specific regions and exert significant influence on the local economies of those areas. These firms are distinguished by their robust presence overseas and in-depth industry expertise.
Organizations in Tier 2 possess strong technological capabilities and strictly adhere to regulatory requirements. The firms, however, may not wield cutting-edge technology or maintain an extensive global reach. Noteworthy entities in Tier 2 include Nouryon, Eastman Chemical Company, and Clariant.
Tier 3 encompasses a large portion of the small-scale enterprises operating within the regional sphere and catering to specialized requirements. These enterprises have revenues below USD 3,000 million. They are notably focused on meeting the local demands and are hence categorized within the Tier 3 segment.
They are small-scale participants with limited geographical presence. In this context, Tier 3 is acknowledged as an informal sector, indicating a segment distinguished by a lack of extensive organization and formal structure compared to the structured ones in Tier 1 and Tier 2. Renowned companies in Tier 3 include Innospec, Adeka Corp, Croda International, and others.
The section below provides organizations with an overview of the market on a country-by-country basis. It contains a detailed analysis of the potential trends and opportunities. This country-specific analysis of the dynamics is likely to assist companies in understanding the complex nature of the industry.
The analysis comprises key factors, potential challenges, and forecasts impacting the demand, production, and consumption of the product within each country. It aims to help businesses make informed decisions and develop effective strategies customized to individual countries.
India is projected to emerge as a dominating country during the forecast period with an anticipated CAGR of 6.9%. China, Brazil, and Germany are estimated to follow behind to become prominent countries with expected CAGRs of 5.9%, 5.4%, and 2.7%, respectively.
| Countries | CAGR 2025 to 2035 |
|---|---|
| India | 6.9% |
| China | 5.9% |
| Brazil | 5.4% |
| Germany | 2.7% |
| United States | 2.6% |
India represents a promising hub for personal care ingredients owing to its rapidly growing population and increasing disposable income. As the middle class expands, there is a surging demand for good quality personal care products.
The country is expected to rise at a CAGR of 6.9% during the assessment period. Growth is primarily driven by the flourishing beauty and skincare industries.
Cultural emphasis on grooming and beauty in India fuels the demand for innovative and effective personal care products. The growing popularity of traditional practices like Ayurveda is merging with modern skincare trends, creating a unique niche.
Companies like Patanjali and Himalaya have successfully capitalized on this trend by offering products that blend natural ingredients with scientific formulations, appealing to a broad consumer base.
Urbanization and increasing awareness of global beauty trends contribute to growth in India. With over 35% of the population now living in urban areas, the country has greater exposure to international brands and standards, boosting the demand for diverse personal care products.
Sales of skincare products alone surged by 15% in 2025, reflecting a significant shift toward personal grooming and self-care in urban centers. This trend is likely to continue, making India a lucrative hub for personal care ingredients.
China is an attractive personal care ingredient market owing to its ever-increasing middle-class population. This growth is also driven by increasing consumer spending on beauty and personal care products as per capita income rises.
The country’s market, similar to that of India, is also greatly influenced by a strong cultural emphasis on skincare and beauty. Consumers are, therefore, preferring high-quality and effective products. The demand for skincare products, in particular, is substantial, accounting for about 40% of the total personal care industry.
International brands like L'Oréal and Estée Lauder have witnessed significant growth in China, underscoring the potential of the industry. Domestic brands are gaining traction in the country by incorporating traditional Chinese medicine (TCM) ingredients. They typically appeal to local consumers who value both modern and traditional beauty solutions.
Ongoing digital transformation in China is boosting the need for personal care products. With over 60% of the country’s population living in urban areas, there is an increased exposure to global beauty trends and a high demand for diverse personal care products.
The e-commerce boom in China further accelerates growth, with online sales of beauty products increasing by 30% annually. Platforms like Tmall and JD.com have become important channels for personal care brands, allowing them to reach a wide audience and cater to the sophisticated preferences of local consumers.
The United States remains a lucrative hub for personal care ingredients owing to its large and diverse consumer base with high incomes.
The personal care product industry in the country is expected to be valued at USD 14.3 billion in 2025 and is further projected to rise at a CAGR of 2.8% from 2025 to 2035. This growth is primarily driven by the increasing demand for innovative and high-quality products that cater to various consumer preferences and requirements.
The field of personal care ingredients in the country is characterized by a strong focus on health and wellness trends, augmenting demand for natural and organic ingredients.
Consumers are increasingly seeking products that are free of harmful chemicals, leading to a surging popularity of naturally formulated brands like Burt’s Bees and Dr. Bronner’s. This trend is supported by the rise in consumer awareness about ingredient transparency and sustainability, with 47% of consumers willing to pay more for clean beauty products.
The United States has a robust e-commerce infrastructure that significantly boosts the personal care sphere. Online sales of beauty and personal care products grew by 30% in 2024, reflecting a shift toward online shopping.
Prominent retailers like Amazon and specialized platforms like Sephora and Ulta Beauty offer extensive product selections, catering to a wide range of consumer preferences. This digital convenience, combined with the country’s innovative business environment, ensures continued growth and demand for personal care ingredients.
A few key players in the personal care ingredient market include BASF SE, The Dow Chemical Company, Croda International Plc, Ashland Global Holdings Inc., Solvay S.A., and Clariant AG.
Companies are actively enhancing their capabilities and resources to cater to the growing demand for the product across diverse applications. Leading companies are leveraging partnerships and joint ventures to co-develop innovative products and bolster their resource base.
Significant players are introducing novel products to address the increasing need for cutting-edge solutions in various end-use industries. Geographic expansion is another important strategy that is being embraced by reputed companies. Brands are focusing on organic growth strategies, including product launches and events. These activities have paved the way for business expansion.
Stringent government regulations on bulk pharmaceutical chemical (BPC) products and their ingredients, side effects of synthetic components, and the presence of home care remedies can impede growth. Companies are hence focusing on fast-growing segments. Innovation and diversification are anticipated to be crucial for growth.
Companies that are able to offer customized options along with unique formulations are likely to dominate in the forecast period. Cosmetic manufacturers are collaborating with ingredient suppliers to drive synergy and create products that stand out from their competitors.
Affordability is a crucial factor for consumers and therefore pricing strategies are likely to be pivotal worldwide. Businesses that are able to strike a balance between high-quality, ethically sourced ingredients, and reasonable pricing are likely to have a competitive edge.
Industry Updates
| Report Attributes | Details |
|---|---|
| Market Size (2025) | USD 13.6 billion |
| Projected Market Size (2035) | USD 21.4 billion |
| CAGR (2025 to 2035) | 4.6% |
| Base Year for Estimation | 2025 |
| Historical Period | 2020 to 2025 |
| Forecast Period | 2025 to 2035 |
| Quantitative Units | Revenue in USD million and Volume in kilotons |
| By Product Type | Emollients, Conditioning Polymers, Surfactants, Rheology Modifiers, UV Absorbers, Emulsifiers, Antimicrobials, Others |
| By Ingredients | Natural, Synthetic |
| By Application | Skincare, Make-up, Oral Care, Hair Care, Toiletries, Others |
| By Region | North America, Latin America, Western Europe, Eastern Europe, South Asia, East Asia, Middle East and Africa |
| Key Players | BASF SE, The Dow Chemical Company, Croda International Plc, Ashland Global Holdings Inc., Solvay S.A, Clariant AG, Evonik Industries AG, The Lubrizol Corporation, Eastman Chemical Company, Nouryon Chemicals B.V, Kao Corporation, ADEKA Corporation, Givaudan SA, Innospec Inc., Merck KGaA, L'Oréal S.A., Unilever PLC, Lonza Group AG |
| Countries Covered | United States, Canada, Mexico, Brazil, Argentina, Germany, France, United Kingdom, Italy, Spain, Netherlands, China, India, Japan, South Korea, ANZ, GCC Countries, South Africa |
| Additional Attributes | Dollar sales by product type (emollients, surfactants, UV absorbers), Dollar sales by ingredient source (natural vs synthetic), Dollar sales by application (skincare, oral care, hair care), Consumer trends in clean-label and multifunctional formulations, Regional preferences for natural ingredients in cosmetics and toiletries, Innovation trends in sustainable and bio-based ingredients |
| Customization and Pricing | Customization and Pricing Available on Request |
Based on product type, the industry is divided into emollients, conditioning polymers, surfactants, rheology modifiers, UV absorbers, emulsifiers, antimicrobials, and others.
By ingredients, the industry is bifurcated into natural and synthetic.
A few key applications include skincare, make-up, oral care, hair care, toiletries, and others.
The industry is spread across North America, Latin America, Western Europe, Eastern Europe, South Asia, East Asia, and the Middle East and Africa.
The global personal care ingredient market is estimated to be valued at USD 14.3 billion in 2025.
The market size for the personal care ingredient market is projected to reach USD 21.9 billion by 2035.
The personal care ingredient market is expected to grow at a 4.4% CAGR between 2025 and 2035.
The key product types in personal care ingredient market are conditioning polymers, emollients, surfactants, rheology modifiers, UV absorbers, emulsifiers, antimicrobials and others.
In terms of ingredients, natural segment to command 60.0% share in the personal care ingredient market in 2025.


Full Research Suite comprises of:
Market outlook & trends analysis
Interviews & case studies
Strategic recommendations
Vendor profiles & capabilities analysis
5-year forecasts
8 regions and 60+ country-level data splits
Market segment data splits
12 months of continuous data updates
DELIVERED AS:
PDF EXCEL ONLINE
Personal Protective Equipment Market Size and Share Forecast Outlook 2025 to 2035
Personality Assessment Solution Market Size and Share Forecast Outlook 2025 to 2035
Personalized Immunotherapy Market Size and Share Forecast Outlook 2025 to 2035
Personal Navigation Devices Market Size and Share Forecast Outlook 2025 to 2035
Personal Genome Testing Market Size and Share Forecast Outlook 2025 to 2035
Personal Watercraft Jet Ski Market Size and Share Forecast Outlook 2025 to 2035
Personalized Packaging Market Size and Share Forecast Outlook 2025 to 2035
Personalized Toys Market Size and Share Forecast Outlook 2025 to 2035
Personalized Nutrition Market - Size, Share, and Forecast Outlook 2025 to 2035
Personal Watercraft Market Growth - Trends & Forecast 2025 to 2035
Personal Mobility Devices Market Analysis - Trends, Growth & Forecast 2025 to 2035
Personalized Beauty Devices Market Trends - Growth & Forecast 2025 to 2035
Personalized Bakery Products Market Analysis by Product Type, Price Range, Sales Channel, End-User and Region 2025 to 2035
Personal CRM Market Report - Growth & Forecast 2025 to 2035
Personalized Medicine Market is segmented by Personalized Medicine Diagnostics, Medicine Therapeutics, and Medical Care from 2025 to 2035
Personal Fitness Trainer Market - Trends, Growth & Forecast 2025 to 2035
Personalized Home Decor Market Insights & Forecast 2024-2034
Personal Emergency Response System Market Analysis – Growth & Forecast 2024-2034
Personal Protective Gloves Market
Personal Protective Equipment Packaging Market

Thank you!
You will receive an email from our Business Development Manager. Please be sure to check your SPAM/JUNK folder too.
Chat With
MaRIA