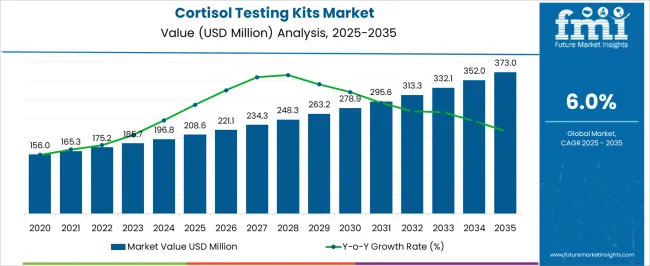
The cortisol testing kits market size is projected to be worth US$ 184.6 million in 2023. The market is likely to surpass US$ 340.7 million by 2033 at a CAGR of 6.3% during the forecast period. The market growth is being propelled by several factors, including the increasing prevalence of hormonal disorders & growing awareness and focus on stress-related health issues. Additionally, the COVID-19 pandemic has further accelerated the demand for at-home health monitoring options.
Technological advancements have significantly improved cortisol testing kits. The integration of advanced biosensor technologies, wearable devices, and smartphone applications has enhanced the accuracy, ease of use, and accessibility of cortisol testing. These advancements have expanded the market by making cortisol testing more convenient and efficient.
Other Drivers Propelling the Demand for Cortisol Testing Kits include:
Challenges for Companies /Manufacturers in the Cortisol Testing Kits Market:
Opportunities in the Cortisol Testing Kits Industry:
Latest Trends in the Cortisol Testing Kits Market:
Attributes | Details |
---|---|
Cortisol Testing Kits Market Size (2023) | US$ 184.6 million |
Cortisol Testing Kits Market Projected Size (2033) | US$ 340.7 million |
Value CAGR (2023 to 2033) | 6.3% |
Don't pay for what you don't need
Customize your report by selecting specific countries or regions and save 30%!
From 2017 to 2022, the global cortisol testing kits market experienced a CAGR of 5.1%, reaching a market size of US$ 184.6 million in 2023.
From 2017 to 2022, Over the past two decades, there has been a growing recognition of the importance of cortisol testing in diagnosing hormonal disorders such as adrenal insufficiency and Cushing's syndrome. As awareness about these conditions has increased, there has been a corresponding rise in the demand for cortisol testing kits, leading to market growth.
Future Forecast for Cortisol Testing Kits Industry:
Looking ahead, the global cortisol testing kits industry is expected to rise at a CAGR of 6.3% from 2023 to 2033. During the forecast period, the market size is expected to reach US$ 340.7 million by 2033.
The cortisol testing kits industry is expected to continue its growth trajectory from 2023 to 2033, driven by the adoption of remote patient monitoring and telehealth solutions. The integration of cortisol testing kits with digital health solutions, such as smartphone apps and wearable devices, is expected to continue.
These digital tools can facilitate convenient testing, real-time data tracking, and remote monitoring of cortisol levels. The ability to collect and analyze data seamlessly can lead to improved patient management and better healthcare outcomes, driving the growth of cortisol testing kits.
Country | The United States |
---|---|
Market Size (US$ million) by End of Forecast Period (2033) | US$ 111.4 million |
CAGR % 2023 to End of Forecast (2033) | 6.1% |
The cortisol testing kits industry in the United States is expected to reach a market size of US$ 111.4 million by 2033, expanding at a CAGR of 6.1%. Chronic diseases and conditions, such as diabetes, obesity, and cardiovascular diseases, are prevalent in the United States. There is a well-established link between stress and the development or exacerbation of these conditions. Cortisol testing kits play a crucial role in assessing stress levels and monitoring the impact of stress on disease management.
Country | The United Kingdom |
---|---|
Market Size (US$ million) by End of Forecast Period (2033) | US$ 15.4 million |
CAGR % 2023 to End of Forecast (2033) | 6.0% |
The cortisol testing kits industry in the United Kingdom is expected to reach a market share of US$ 15.4 million, expanding at a CAGR of 6.0% during the forecast period. The United Kingdom has witnessed a shift towards self-care and wellness, with individuals taking a proactive approach to managing their health. Cortisol testing kits offer a convenient and accessible way for individuals to monitor their stress levels at home. The ability to track cortisol levels empowers individuals to make informed lifestyle choices, seek appropriate interventions, and take control of their well-being.
Country | China |
---|---|
Market Size (US$ million) by End of Forecast Period (2033) | US$ 24.4 million |
CAGR % 2023 to End of Forecast (2033) | 7.3% |
The cortisol testing kits industry in China is anticipated to reach a market size of US$ 24.4 million, moving at a CAGR of 7.3% during the forecast period. Technological advancements in cortisol testing have made the process more accurate, efficient, and user-friendly. Portable and rapid cortisol testing kits enable healthcare providers to obtain immediate results, facilitating timely diagnosis and treatment decisions.
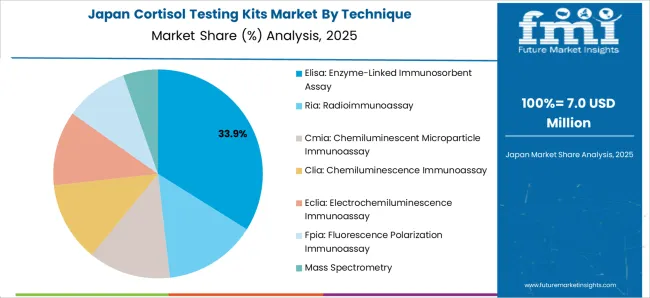
Country | Japan |
---|---|
Market Size (US$ million) by End of Forecast Period (2033) | US$ 17.8 million |
CAGR % 2023 to End of Forecast (2033) | 7.2% |
The cortisol testing kits industry in Japan is estimated to reach a market size of US$ 17.8 million by 2033, thriving at a CAGR of 7.2%. Collaboration between the medical device industry and healthcare providers is driving the adoption of cortisol testing kits in Japan. Manufacturers and suppliers of cortisol testing kits are working closely with healthcare professionals to develop and promote the use of these kits for stress assessment and management.
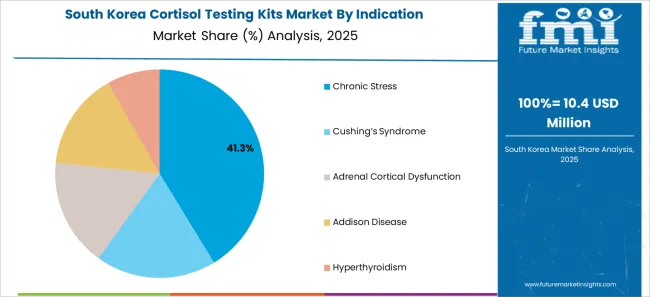
Country | South Korea |
---|---|
Market Size (US$ million) by End of Forecast Period (2033) | US$ 20.2 million |
CAGR % 2023 to End of Forecast (2033) | 7.0% |
The cortisol testing kits industry in South Korea is expected to reach a market size of US$ 20.2 million, expanding at a CAGR of 7.0% during the forecast period. South Korea has been increasing its healthcare spending, leading to improved access to healthcare services and medical devices. With greater access to healthcare facilities, there is a higher demand for medical devices, including cortisol testing kits, to support diagnosis, monitoring, and treatment. The increased healthcare spending provides opportunities for manufacturers and suppliers of cortisol testing kits to cater to the growing demand.
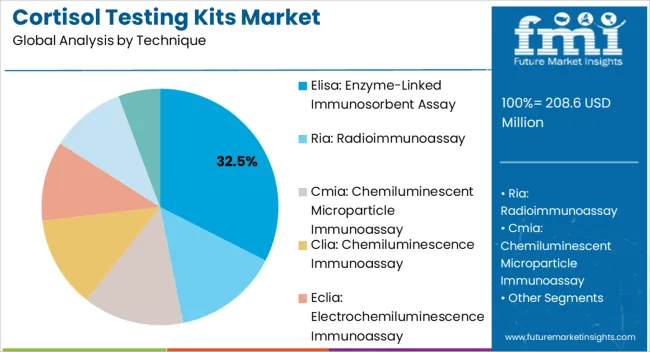
ELISA is expected to dominate the cortisol testing kits industry with a CAGR of 6.5% from 2023 to 2033. ELISA-based cortisol testing kits offer high sensitivity and specificity, allowing for accurate measurement of cortisol levels in biological samples. These kits have a lower limit of detection that enables the quantification of cortisol even at low concentrations, making them suitable for a wide range of applications.
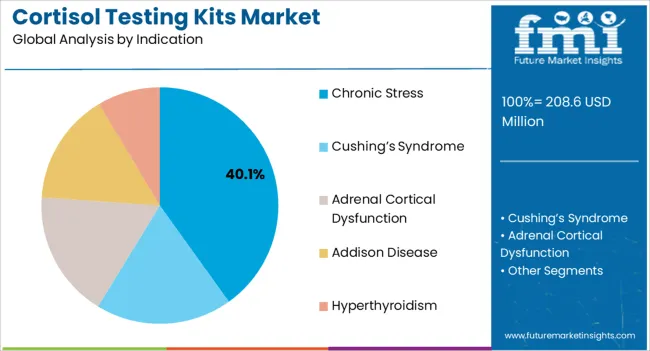
Hyperthyroidism is expected to dominate the cortisol testing kits industry with a CAGR of 6.4% from 2023 to 2033. Cortisol testing may still have some relevance in cases where hyperthyroidism is suspected to be caused by another condition or is associated with stress-related disorders. In such cases, cortisol testing can help evaluate the impact of stress on the body or assess the function of the adrenal glands, which are involved in cortisol production. This information may complement the overall assessment of a patient with suspected or diagnosed hyperthyroidism.
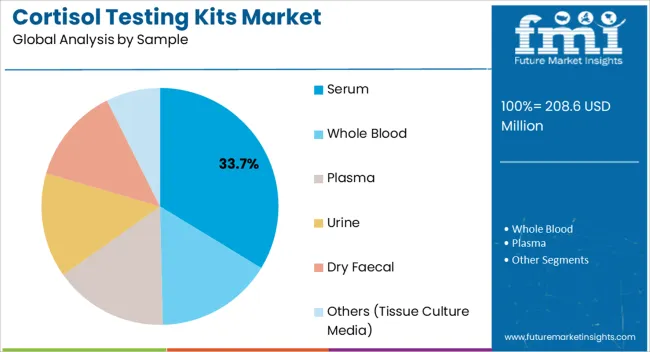
Whole blood is expected to dominate the cortisol testing kits industry with a CAGR of 6.1% from 2023 to 2033. Cortisol testing kits that utilize whole blood as the sample type are available for measuring cortisol levels. These kits are designed to provide a convenient and rapid method for cortisol analysis in whole blood samples. Whole blood cortisol testing kits are designed to provide rapid results, often within minutes. This quick turnaround time allows for immediate assessment of cortisol levels, enabling timely decision-making and intervention if necessary.
Diagnostics centers is expected to dominate the cortisol testing kits industry with a CAGR of 6.5% from 2023 to 2033. Diagnostics centers can play a significant role in offering cortisol testing services using cortisol testing kits. These centers, equipped with appropriate laboratory facilities and trained personnel, can perform cortisol testing to assess stress levels and aid in the diagnosis and management of certain conditions.
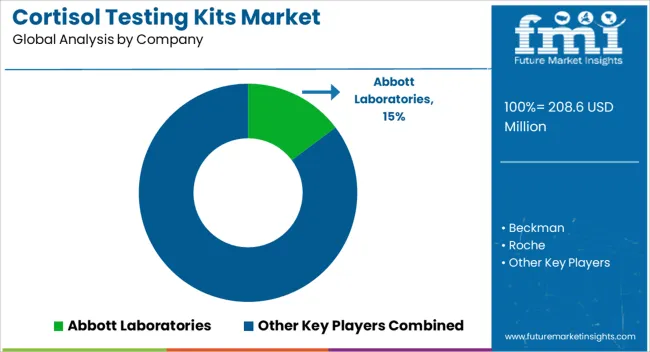
Cortisol testing kits industry is fiercely competitive, with many companies fighting for market dominance. To stay ahead of the competition in such a circumstance, essential players must employ smart techniques.
Key Strategies Used by the Participants
Companies invest heavily in R&D to develop testing kits that improve efficiency, accuracy, and cost-effectiveness. Technology innovation allows businesses to differentiate themselves from their competition while also catering to the changing demands of their consumers.
Key industry leaders frequently develop strategic partnerships and collaborations with other companies in order to harness their strengths and increase their market reach. Companies might also gain access to new technology and markets through such agreements.
Cortisol testing kits industry is expanding rapidly in emerging regions such as China and India. Key firms are enhancing their distribution networks and developing local manufacturing facilities to increase their presence in these areas.
Mergers and acquisitions are frequently used by key players in the cortisol testing kits business to consolidate their market position, extend their product range, and gain access to new markets.
Get the data you need at a Fraction of the cost
Personalize your report by choosing insights you need
and save 40%!
Key Developments in the Cortisol testing kits Market:
The sales of cortisol testing kits are anticipated to be US$ 340.7 million by 2033.
The growth potential of the market is 6.3% through 2033.
Growing hormonal disorders and surging awareness about the adverse impact of stress.
Dearth of standardized protocols and increasing costs of cortisol testing kits.
Point-of-care testing and self-monitoring are the emerging trends in the market.
1. Executive Summary 1.1. Global Market Outlook 1.2. Demand Side Trends 1.3. Supply Side Trends 1.4. Analysis and Recommendations 2. Market Overview 2.1. Market Coverage / Taxonomy 2.2. Market Definition / Scope / Limitations 2.3. Inclusions and Exclusions 3. Key Market Trends 3.1. Key Trends Impacting the Market 3.2. Product Innovation / Development Trends 4. Value Added Insights 4.1. Product Adoption by Region 4.2. Recent Product Approvals/Launches 4.3. Regulatory Landscape 4.4. PESTEL Analysis 4.5. Porter’s Analysis 5. Market Background 5.1. Macro-Economic Factors 5.1.1. Global GDP Growth Outlook 5.1.2. Global Healthcare Expenditure Outlook 5.2. Forecast Factors - Relevance & Impact 5.2.1. Key Player’s Historic Growth 5.2.2. Increasing Cases of Adrenal Cortical Dysfunction 5.2.3. Favourable Government Regulations 5.2.4. Rising Demand for Immunoassay Technique 5.2.5. Technological Advancement in Immunoassay 5.2.6. Increasing Prevalence of Addison Disease 5.3. Dynamics 5.3.1. Drivers 5.3.2. Restraints 5.3.3. Opportunity Analysis 6. Global Market Volume (in Units) Analysis 2017 to 2022 and Forecast, 2023 to 2033 6.1. Historical Volume (in Units) Analysis, 2017 to 2022 6.2. Current and Future Volume (in Units) Projections, 2023 to 2033 6.2.1. Y-o-Y Growth Trend Analysis 7. Global Market - Pricing Analysis 7.1. Regional Pricing Analysis By Product 7.2. Pricing Break-up 7.2.1. Manufacturer Level Pricing 7.2.2. Distributor Level Pricing 7.3. Global Average Pricing Analysis Benchmark 7.4. Pricing Assumptions 8. Global Market Demand (in Value or Size in US$ Mn) Analysis 2017 to 2022 and Forecast, 2023 to 2033 8.1. Historical Market Value (US$ Million) Analysis, 2017 to 2022 8.2. Current and Future Market Value (US$ Million) Projections, 2023 to 2033 8.2.1. Y-o-Y Growth Trend Analysis 8.2.2. Absolute $ Opportunity Analysis 9. Global Market Analysis 2017 to 2022 and Forecast 2023 to 2033, By Technique 9.1. Introduction / Key Findings 9.2. Historical Market Size (US$ Million) Analysis By Technique, 2017 to 2022 9.3. Current and Future Market Size (US$ Million) Analysis and Forecast By Technique, 2023 to 2033 9.3.1. RIA: Radioimmunoassay 9.3.2. CMIA: Chemiluminescent Microparticle Immunoassay 9.3.3. CLIA: Chemiluminescence Immunoassay 9.3.4. ECLIA: Electrochemiluminescence Immunoassay 9.3.5. FPIA: Fluorescence Polarization Immunoassay 9.3.6. ELISA: enzyme-linked immunosorbent assay 9.3.7. Mass Spectrometry 9.4. Market Attractiveness Analysis By Technique 10. Global Market Analysis 2017 to 2022 and Forecast 2023 to 2033, By Indication 10.1. Introduction / Key Findings 10.2. Historical Market Size (US$ Million) Analysis By Indication, 2017 to 2022 10.3. Current and Future Market Size (US$ Million) Analysis and Forecast By Indication, 2023 to 2033 10.3.1. Cushing’s syndrome 10.3.2. Adrenal cortical dysfunction 10.3.3. Addison Disease 10.3.4. Hyperthyroidism 10.3.5. Chronic Stress 10.4. Market Attractiveness Analysis By Indication 11. Global Market Analysis 2017 to 2022 and Forecast 2023 to 2033, By Sample 11.1. Introduction / Key Findings 11.2. Historical Market Size (US$ Million) Analysis By Sample, 2017 to 2022 11.3. Current and Future Market Size (US$ Million) Analysis and Forecast By Sample, 2023 to 2033 11.3.1. Whole Blood 11.3.2. Serum 11.3.3. Plasma 11.3.4. Urine 11.3.5. Dry Faecal 11.3.6. Others 11.4. Market Attractiveness Analysis By Sample 12. Global Market Analysis 2017 to 2022 and Forecast 2023 to 2033, By End User 12.1. Introduction / Key Findings 12.2. Historical Market Size (US$ Million) Analysis By End User, 2017 to 2022 12.3. Current and Future Market Size (US$ Million) Analysis and Forecast By End User, 2023 to 2033 12.3.1. Hospital Settings 12.3.2. Specialty Clinics 12.3.3. Diagnostics Centers 12.3.4. Nephropathy Clinics 12.3.5. Others 12.4. Market Attractiveness Analysis By End User 13. Global Market Analysis 2017 to 2022 and Forecast 2023 to 2033, by Region 13.1. Introduction 13.2. Historical Market Size (US$ Million) and Volume (Units) Analysis By Region, 2017 to 2022 13.3. Current and Future Market Size (US$ Million) and Volume (Units) Analysis and Forecast By Region, 2023 to 2033 13.3.1. North America 13.3.2. Latin America 13.3.3. Europe 13.3.4. South Asia 13.3.5. East Asia 13.3.6. Oceania 13.3.7. Middle East and Africa 13.4. Market Attractiveness Analysis By Region 14. North America Market Analysis 2017 to 2022 and Forecast 2023 to 2033 14.1. Introduction 14.2. Historical Market Size (US$ Million) and Volume (Units) Analysis By Market Taxonomy, 2017 to 2022 14.3. Current and Future Market Size (US$ Million) and Volume (Units) Analysis and Forecast By Market Taxonomy, 2023 to 2033 14.3.1. By Country 14.3.1.1. USA 14.3.1.2. Canada 14.3.2. By Technique 14.3.3. By Indication 14.3.4. By Sample 14.3.5. By End User 14.4. Market Attractiveness Analysis 14.4.1. By Country 14.4.2. By Technique 14.4.3. By Indication 14.4.4. By Sample 14.4.5. By End User 14.5. Country Level Analysis & Forecast 14.5.1. USA Market Analysis 14.5.1.1. Introduction 14.5.1.2. Market Analysis and Forecast by Market Taxonomy 14.5.1.2.1. By Technique 14.5.1.2.2. By Indication 14.5.1.2.3. By Sample 14.5.1.2.4. By End User 14.5.2. Canada Market Analysis 14.5.2.1. Introduction 14.5.2.2. Market Analysis and Forecast by Market Taxonomy 14.5.2.2.1. By Technique 14.5.2.2.2. By Indication 14.5.2.2.3. By Sample 14.5.2.2.4. By End User 14.6. Market Trends 14.7. Key Market Participants - Intensity Mapping 14.8. Drivers and Restraints - Impact Analysis 15. Latin America Market Analysis 2017 to 2022 and Forecast 2023 to 2033 15.1. Introduction 15.2. Historical Market Size (US$ Million) and Volume (Units) Analysis By Market Taxonomy, 2017 to 2022 15.3. Current and Future Market Size (US$ Million) and Volume (Units) Analysis and Forecast By Market Taxonomy, 2023 to 2033 15.3.1. By Country 15.3.1.1. Brazil 15.3.1.2. Mexico 15.3.1.3. Argentina 15.3.1.4. Rest of Latin America 15.3.2. By Technique 15.3.3. By Indication 15.3.4. By Sample 15.3.5. By End User 15.4. Market Attractiveness Analysis 15.4.1. By Country 15.4.2. By Technique 15.4.3. By Indication 15.4.4. By Sample 15.4.5. By End User 15.5. Country Level Analysis & Forecast 15.5.1. Brazil Market Analysis 15.5.1.1. Introduction 15.5.1.2. Market Analysis and Forecast by Market Taxonomy 15.5.1.2.1. By Technique 15.5.1.2.2. By Indication 15.5.1.2.3. By Sample 15.5.1.2.4. By End User 15.5.2. Mexico Market Analysis 15.5.2.1. Introduction 15.5.2.2. Market Analysis and Forecast by Market Taxonomy 15.5.2.2.1. By Technique 15.5.2.2.2. By Indication 15.5.2.2.3. By Sample 15.5.2.2.4. By End User 15.5.3. Argentina Market Analysis 15.5.3.1. Introduction 15.5.3.2. Market Analysis and Forecast by Market Taxonomy 15.5.3.2.1. By Technique 15.5.3.2.2. By Indication 15.5.3.2.3. By Sample 15.5.3.2.4. By End User 15.6. Market Trends 15.7. Key Market Participants - Intensity Mapping 15.8. Drivers and Restraints - Impact Analysis 16. Europe Market Analysis 2017 to 2022 and Forecast 2023 to 2033 16.1. Introduction 16.2. Historical Market Size (US$ Million) and Volume (Units) Analysis By Market Taxonomy, 2017 to 2022 16.3. Current and Future Market Size (US$ Million) and Volume (Units) Analysis and Forecast By Market Taxonomy, 2023 to 2033 16.3.1. By Country 16.3.1.1. Germany 16.3.1.2. France 16.3.1.3. Italy 16.3.1.4. UK 16.3.1.5. Spain 16.3.1.6. Russia 16.3.1.7. BENELUX 16.3.1.8. Rest of Europe 16.3.2. By Technique 16.3.3. By Indication 16.3.4. By Sample 16.3.5. By End User 16.4. Market Attractiveness Analysis 16.4.1. By Country 16.4.2. By Technique 16.4.3. By Indication 16.4.4. By Sample 16.4.5. By End User 16.5. Country Level Analysis & Forecast 16.5.1. Germany Market Analysis 16.5.1.1. Introduction 16.5.1.2. Market Analysis and Forecast by Market Taxonomy 16.5.1.2.1. By Technique 16.5.1.2.2. By Indication 16.5.1.2.3. By Sample 16.5.1.2.4. By End User 16.5.2. France Market Analysis 16.5.2.1. Introduction 16.5.2.2. Market Analysis and Forecast by Market Taxonomy 16.5.2.2.1. By Technique 16.5.2.2.2. By Indication 16.5.2.2.3. By Sample 16.5.2.2.4. By End User 16.5.3. Italy Market Analysis 16.5.3.1. Introduction 16.5.3.2. Market Analysis and Forecast by Market Taxonomy 16.5.3.2.1. By Technique 16.5.3.2.2. By Indication 16.5.3.2.3. By Sample 16.5.3.2.4. By End User 16.5.4. UK Market Analysis 16.5.4.1. Introduction 16.5.4.2. Market Analysis and Forecast by Market Taxonomy 16.5.4.2.1. By Technique 16.5.4.2.2. By Indication 16.5.4.2.3. By Sample 16.5.4.2.4. By End User 16.5.5. Spain Market Analysis 16.5.5.1. Introduction 16.5.5.2. Market Analysis and Forecast by Market Taxonomy 16.5.5.2.1. By Technique 16.5.5.2.2. By Indication 16.5.5.2.3. By Sample 16.5.5.2.4. By End User 16.5.6. Russia Market Analysis 16.5.6.1. Introduction 16.5.6.2. Market Analysis and Forecast by Market Taxonomy 16.5.6.2.1. By Technique 16.5.6.2.2. By Indication 16.5.6.2.3. By Sample 16.5.6.2.4. By End User 16.5.7. BENELUX Market Analysis 16.5.7.1. Introduction 16.5.7.2. Market Analysis and Forecast by Market Taxonomy 16.5.7.2.1. By Technique 16.5.7.2.2. By Indication 16.5.7.2.3. By Sample 16.5.7.2.4. By End User 16.6. Market Trends 16.7. Key Market Participants - Intensity Mapping 16.8. Drivers and Restraints - Impact Analysis 17. South Asia Market Analysis 2017 to 2022 and Forecast 2023 to 2033 17.1. Introduction 17.2. Historical Market Size (US$ Million) and Volume (Units) Analysis By Market Taxonomy, 2017 to 2022 17.3. Current and Future Market Size (US$ Million) and Volume (Units) Analysis and Forecast By Market Taxonomy, 2023 to 2033 17.3.1. By Country 17.3.1.1. India 17.3.1.2. Thailand 17.3.1.3. Indonesia 17.3.1.4. Malaysia 17.3.1.5. Rest of South Asia 17.3.2. By Technique 17.3.3. By Indication 17.3.4. By Sample 17.3.5. By End User 17.4. Market Attractiveness Analysis 17.4.1. By Country 17.4.2. By Technique 17.4.3. By Indication 17.4.4. By Sample 17.4.5. By End User 17.5. Country Level Analysis & Forecast 17.5.1. India Market Analysis 17.5.1.1. Introduction 17.5.1.2. Market Analysis and Forecast by Market Taxonomy 17.5.1.2.1. By Technique 17.5.1.2.2. By Indication 17.5.1.2.3. By Sample 17.5.1.2.4. By End User 17.5.2. Thailand Market Analysis 17.5.2.1. Introduction 17.5.2.2. Market Analysis and Forecast by Market Taxonomy 17.5.2.2.1. By Technique 17.5.2.2.2. By Indication 17.5.2.2.3. By Sample 17.5.2.2.4. By End User 17.5.3. Indonesia Market Analysis 17.5.3.1. Introduction 17.5.3.2. Market Analysis and Forecast by Market Taxonomy 17.5.3.2.1. By Technique 17.5.3.2.2. By Indication 17.5.3.2.3. By Sample 17.5.3.2.4. By End User 17.5.4. Malaysia Market Analysis 17.5.4.1. Introduction 17.5.4.2. Market Analysis and Forecast by Market Taxonomy 17.5.4.2.1. By Technique 17.5.4.2.2. By Indication 17.5.4.2.3. By Sample 17.5.4.2.4. By End User 17.6. Market Trends 17.7. Key Market Participants - Intensity Mapping 17.8. Drivers and Restraints - Impact Analysis 18. East Asia Market Analysis 2017 to 2022 and Forecast 2023 to 2033 18.1. Introduction 18.2. Historical Market Size (US$ Million) and Volume (Units) Analysis By Market Taxonomy, 2017 to 2022 18.3. Current and Future Market Size (US$ Million) and Volume (Units) Analysis and Forecast By Market Taxonomy, 2023 to 2033 18.3.1. By Country 18.3.1.1. China 18.3.1.2. Japan 18.3.1.3. South Korea 18.3.2. By Technique 18.3.3. By Indication 18.3.4. By Sample 18.3.5. By End User 18.4. Market Attractiveness Analysis 18.4.1. By Country 18.4.2. By Technique 18.4.3. By Indication 18.4.4. By Sample 18.4.5. By End User 18.5. Country Level Analysis & Forecast 18.5.1. China Market Analysis 18.5.1.1. Introduction 18.5.1.2. Market Analysis and Forecast by Market Taxonomy 18.5.1.2.1. By Technique 18.5.1.2.2. By Indication 18.5.1.2.3. By Sample 18.5.1.2.4. By End User 18.5.2. Japan Market Analysis 18.5.2.1. Introduction 18.5.2.2. Market Analysis and Forecast by Market Taxonomy 18.5.2.2.1. By Technique 18.5.2.2.2. By Indication 18.5.2.2.3. By Sample 18.5.2.2.4. By End User 18.5.3. South Korea Market Analysis 18.5.3.1. Introduction 18.5.3.2. Market Analysis and Forecast by Market Taxonomy 18.5.3.2.1. By Technique 18.5.3.2.2. By Indication 18.5.3.2.3. By Sample 18.5.3.2.4. By End User 18.6. Market Trends 18.7. Key Market Participants - Intensity Mapping 18.8. Drivers and Restraints - Impact Analysis 19. Oceania Market Analysis 2017 to 2022 and Forecast 2023 to 2033 19.1. Introduction 19.2. Historical Market Size (US$ Million) and Volume (Units) Analysis By Market Taxonomy, 2017 to 2022 19.3. Current and Future Market Size (US$ Million) and Volume (Units) Analysis and Forecast By Market Taxonomy, 2023 to 2033 19.3.1. By Country 19.3.1.1. Australia 19.3.1.2. New Zealand 19.3.2. By Technique 19.3.3. By Indication 19.3.4. By Sample 19.3.5. By End User 19.4. Market Attractiveness Analysis 19.4.1. By Country 19.4.2. By Technique 19.4.3. By Indication 19.4.4. By Sample 19.4.5. By End User 19.5. Country Level Analysis & Forecast 19.5.1. Australia Market Analysis 19.5.1.1. Introduction 19.5.1.2. Market Analysis and Forecast by Market Taxonomy 19.5.1.2.1. By Technique 19.5.1.2.2. By Indication 19.5.1.2.3. By Sample 19.5.1.2.4. By End User 19.5.2. New Zealand Market Analysis 19.5.2.1. Introduction 19.5.2.2. Market Analysis and Forecast by Market Taxonomy 19.5.2.2.1. By Technique 19.5.2.2.2. By Indication 19.5.2.2.3. By Sample 19.5.2.2.4. By End User 19.6. Market Trends 19.7. Key Market Participants - Intensity Mapping 19.8. Drivers and Restraints - Impact Analysis 20. Middle East and Africa Market Analysis 2017 to 2022 and Forecast 2023 to 2033 20.1. Introduction 20.2. Historical Market Size (US$ Million) and Volume (Units) Analysis By Market Taxonomy, 2017 to 2022 20.3. Current and Future Market Size (US$ Million) and Volume (Units) Analysis and Forecast By Market Taxonomy, 2023 to 2033 20.3.1. By Country 20.3.1.1. GCC Countries 20.3.1.2. Türkiye 20.3.1.3. Northern Africa 20.3.1.4. South Africa 20.3.1.5. Rest of Middle East and Africa 20.3.2. By Technique 20.3.3. By Indication 20.3.4. By Sample 20.3.5. By End User 20.4. Market Attractiveness Analysis 20.4.1. By Country 20.4.2. By Technique 20.4.3. By Indication 20.4.4. By Sample 20.4.5. By End User 20.5. Country Level Analysis & Forecast 20.5.1. GCC Countries Market Analysis 20.5.1.1. Introduction 20.5.1.2. Market Analysis and Forecast by Market Taxonomy 20.5.1.2.1. By Technique 20.5.1.2.2. By Indication 20.5.1.2.3. By Sample 20.5.1.2.4. By End User 20.5.2. Türkiye Market Analysis 20.5.2.1. Introduction 20.5.2.2. Market Analysis and Forecast by Market Taxonomy 20.5.2.2.1. By Technique 20.5.2.2.2. By Indication 20.5.2.2.3. By Sample 20.5.2.2.4. By End User 20.5.3. Northern Africa Market Analysis 20.5.3.1. Introduction 20.5.3.2. Market Analysis and Forecast by Market Taxonomy 20.5.3.2.1. By Technique 20.5.3.2.2. By Indication 20.5.3.2.3. By Sample 20.5.3.2.4. By End User 20.5.4. South Africa Market Analysis 20.5.4.1. Introduction 20.5.4.2. Market Analysis and Forecast by Market Taxonomy 20.5.4.2.1. By Technique 20.5.4.2.2. By Indication 20.5.4.2.3. By Sample 20.5.4.2.4. By End User 20.6. Market Trends 20.7. Key Market Participants - Intensity Mapping 20.8. Drivers and Restraints - Impact Analysis 21. Market Structure Analysis 21.1. Market Analysis by Tier of Companies 21.2. Market Share Analysis of Top Players 21.3. Market Presence Analysis 22. Competition Analysis 22.1. Competition Dashboard 22.2. Branding and Promotional Strategies, By Key Players 22.3. Key Development Analysis 22.4. Competition Deep Dive 22.4.1. Abbott 22.4.1.1. Overview 22.4.1.2. Product Portfolio 22.4.1.3. Key Financials 22.4.1.4. Sales Footprint 22.4.1.5. SWOT Analysis 22.4.1.6. Strategy Overview 22.4.1.6.1. Marketing Strategy 22.4.1.6.2. Product Strategy 22.4.1.6.3. Channel Strategy 22.4.2. Beckman 22.4.2.1. Overview 22.4.2.2. Product Portfolio 22.4.2.3. Key Financials 22.4.2.4. Sales Footprint 22.4.2.5. SWOT Analysis 22.4.2.6. Strategy Overview 22.4.2.6.1. Marketing Strategy 22.4.2.6.2. Product Strategy 22.4.2.6.3. Channel Strategy 22.4.3. Roche 22.4.3.1. Overview 22.4.3.2. Product Portfolio 22.4.3.3. Key Financials 22.4.3.4. Sales Footprint 22.4.3.5. SWOT Analysis 22.4.3.6. Strategy Overview 22.4.3.6.1. Marketing Strategy 22.4.3.6.2. Product Strategy 22.4.3.6.3. Channel Strategy 22.4.4. Siemens 22.4.4.1. Overview 22.4.4.2. Product Portfolio 22.4.4.3. Key Financials 22.4.4.4. Sales Footprint 22.4.4.5. SWOT Analysis 22.4.4.6. Strategy Overview 22.4.4.6.1. Marketing Strategy 22.4.4.6.2. Product Strategy 22.4.4.6.3. Channel Strategy 22.4.5. arigo Biolaboratories Corp 22.4.5.1. Overview 22.4.5.2. Product Portfolio 22.4.5.3. Key Financials 22.4.5.4. Sales Footprint 22.4.5.5. SWOT Analysis 22.4.5.6. Strategy Overview 22.4.5.6.1. Marketing Strategy 22.4.5.6.2. Product Strategy 22.4.5.6.3. Channel Strategy 22.4.6. Eagle Biosciences, Inc. 22.4.6.1. Overview 22.4.6.2. Product Portfolio 22.4.6.3. Key Financials 22.4.6.4. Sales Footprint 22.4.6.5. SWOT Analysis 22.4.6.6. Strategy Overview 22.4.6.6.1. Marketing Strategy 22.4.6.6.2. Product Strategy 22.4.6.6.3. Channel Strategy 22.4.7. Monobind Inc. 22.4.7.1. Overview 22.4.7.2. Product Portfolio 22.4.7.3. Key Financials 22.4.7.4. Sales Footprint 22.4.7.5. SWOT Analysis 22.4.7.6. Strategy Overview 22.4.7.6.1. Marketing Strategy 22.4.7.6.2. Product Strategy 22.4.7.6.3. Channel Strategy 22.4.8. Snibe 22.4.8.1. Overview 22.4.8.2. Product Portfolio 22.4.8.3. Key Financials 22.4.8.4. Sales Footprint 22.4.8.5. SWOT Analysis 22.4.8.6. Strategy Overview 22.4.8.6.1. Marketing Strategy 22.4.8.6.2. Product Strategy 22.4.8.6.3. Channel Strategy 22.4.9. Elabscience Biotechnology Inc 22.4.9.1. Overview 22.4.9.2. Product Portfolio 22.4.9.3. Key Financials 22.4.9.4. Sales Footprint 22.4.9.5. SWOT Analysis 22.4.9.6. Strategy Overview 22.4.9.6.1. Marketing Strategy 22.4.9.6.2. Product Strategy 22.4.9.6.3. Channel Strategy 22.4.10. Thermo Fisher Scientific Inc 22.4.10.1. Overview 22.4.10.2. Product Portfolio 22.4.10.3. Key Financials 22.4.10.4. Sales Footprint 22.4.10.5. SWOT Analysis 22.4.10.6. Strategy Overview 22.4.10.6.1. Marketing Strategy 22.4.10.6.2. Product Strategy 22.4.10.6.3. Channel Strategy 22.4.11. bioMérieux SA 22.4.11.1. Overview 22.4.11.2. Product Portfolio 22.4.11.3. Key Financials 22.4.11.4. Sales Footprint 22.4.11.5. SWOT Analysis 22.4.11.6. Strategy Overview 22.4.11.6.1. Marketing Strategy 22.4.11.6.2. Product Strategy 22.4.11.6.3. Channel Strategy 22.4.12. Salimetrics 22.4.12.1. Overview 22.4.12.2. Product Portfolio 22.4.12.3. Key Financials 22.4.12.4. Sales Footprint 22.4.12.5. SWOT Analysis 22.4.12.6. Strategy Overview 22.4.12.6.1. Marketing Strategy 22.4.12.6.2. Product Strategy 22.4.12.6.3. Channel Strategy 22.4.13. Caymanchem 22.4.13.1. Overview 22.4.13.2. Product Portfolio 22.4.13.3. Key Financials 22.4.13.4. Sales Footprint 22.4.13.5. SWOT Analysis 22.4.13.6. Strategy Overview 22.4.13.6.1. Marketing Strategy 22.4.13.6.2. Product Strategy 22.4.13.6.3. Channel Strategy 23. Assumptions and Acronyms Used 24. Research Methodology
Explore Healthcare Insights
View Reports