Cornstarch Packaging Market Outlook (2023 to 2033)

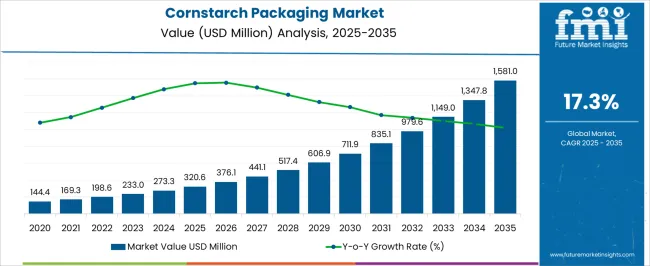
The cornstarch packaging market size is projected to be valued at US$ 233.0 million in 2023 and is expected to rise to US$ 1,145.0 million by 2033. The sales of cornstarch packaging are expected to record a significant CAGR of 17.3% during the forecast period. Various factors propelling the demand for cornstarch packaging g are:

Cornstarch packaging, also known as biodegradable or compostable packaging, is becoming increasingly popular in the market due to its environmental benefits.

Unlike traditional packaging materials such as plastic, cornstarch packaging is made from renewable resources and can be biodegraded or composted after use. Reducing the amount of waste in landfills and the environment.

Customers opted for single-use plastics to protect their health and hygiene during the outbreak of the pandemic, leading to a shift in consumer purchasing behavior. However, as immunization rates climb, customers and businesses alike are refocusing on sustainability.

Scaling up packaging options is essential to the success of both the product and the business as more companies are declaring their commitment to the environment.

The demand for cornstarch-based packaging is not limited to the food industry but extends to the paper, adhesives, poultry/animal feed, and fireworks industries.

While the usage of corn starch bags as a plastic substitute is gaining traction, the market is still in its early stages.

Corn starch bags are biodegradable and 30% more durable than existing polythene bags, making them an appealing option for environmentally conscious consumers. This offers a niche market for new entrants who may be able to attract a core audience.

Although numerous natural raw materials can be utilized to manufacture biodegradable bags, maize is the widely available raw material worldwide.

The complexity and price of switching from plastic to corn starch packaging are significant variables that could affect market growth.

However, the fact that starch accounts for only a small portion of the nation's maize supply indicate that there is much opportunity for capability expansion.

The regulatory environment and consumer awareness also have an impact on the growth of the corn starch packaging industry. As a result, corn starch-based packaging has the potential to capture a substantial market share in the next ten years.

Attribute Details
Cornstarch Packaging Market Estimated Size (2023) US$ 233.0 million
Cornstarch Packaging Market CAGR (2023 to 2033) 17.3%
Cornstarch Packaging Market Forecasted Size (2033) US$ 1,145.0 million

Don't pay for what you don't need

Customize your report by selecting specific countries or regions and save 30%!

2018 to 2022 Cornstarch Packaging Market Outlook in Comparison to 2023 to 2033 Growth Forecast

Food takeaway and food orders have become standard practices worldwide due to people's busy lifestyles. Resulting in a surge in demand for the biodegradable food packaging market. Another trend that is driving sales of biodegradable food packaging is food on the go.

The market is estimated to expand at 17.3% CAGR between 2023 and 2033, in comparison to the 8.5% CAGR registered from 2018 to 2022.

In recent years, the cornstarch packaging business has grown significantly. The fundamental driver of this increase has been the desire for sustainable and eco-friendly packaging solutions. Consumer preferences are shifting towards biodegradable packaging solutions as people become more aware of environmental issues and the environmental impact of plastic waste.

The food and beverage industry, which is the leading contributor to plastic waste, has predominantly fueled the market for cornstarch packaging. Cornstarch packaging is widely utilized in this business for snacks, baked items, and fresh produce. Cornstarch packaging is also being used in the cosmetics and personal care industries for items like soap and shampoo bars.

The growth of the cornstarch packaging market is also expected to be influenced by technological advancements. Such as, in the production of biodegradable materials and the development of new and innovative packaging solutions. As more companies declare their commitment to the environment, scaling up packaging options is essential to the success of both the product and the business.

The above-mentioned factors are likely to assist the market to surpass the value of US$ 1,145.0 million by 2033.

Businesses Should Consider Cornstarch Packaging for Several Reasons

  • Firstly, it offers advantages for both the company and the environment, making it a worthwhile choice.
  • By using corn-starch packaging, companies can become more socially responsible, which is an attractive feature for environmentally conscious customers who support eco-friendly businesses.
  • Customers are now more aware of greenwashing and packaging materials used in the industry. Making it essential for companies to adapt and make sustainable changes.
  • Using corn-starch packaging can also help companies market their brand more effectively in developing economies and establish a genuine connection with customers.
  • Bans on single-use plastics are inevitable, and it is becoming necessary, rather than optional, to switch to sustainable options.
  • Using eco-friendly and innovative options, such as corn-starch packing materials, demonstrates a company's commitment to sustainability efforts and sets it apart from the competition.
  • Lastly, choosing better and more sustainable packaging options allows companies to handle a dynamic client. This delivers an effective and fantastic customer experience.
  • Therefore, businesses should consider switching to corn-starch packaging to stay ahead of the curve and make a positive impact on the environment while attracting eco-conscious customers.
Ismail Sutaria
Ismail Sutaria

Principal Consultant

Talk to Analyst

Find your sweet spots for generating winning opportunities in this market.

Category-wise Insights of Cornstarch Packaging

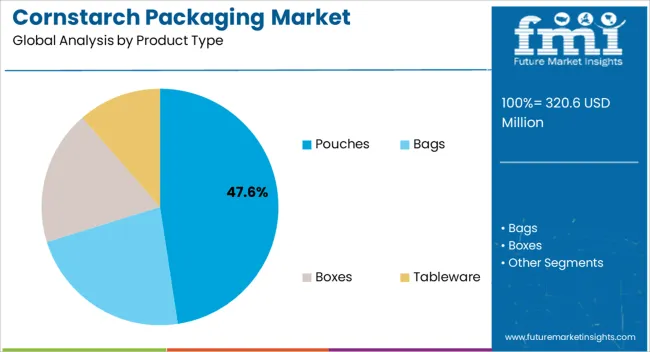
Tableware’s Widely Utilized Across Various End-user Industries Due to its Beneficial Characteristics. The Segment had likely to Surpass 80.6% of the Market Share in 2022.

Cornstarch-based tableware, such as disposable plates, cups, and silverware, accounts for a substantial portion of the cornstarch packaging business. These biodegradable and compostable goods have become a popular alternative to standard petroleum-based plastics for single-use items.

Tableware made of cornstarch has various advantages over standard plastic tableware. They are constructed of renewable resources and are biodegradable and compostable. This means they can be broken down into natural components and do not contribute to environmental plastic waste. Furthermore, cornstarch-based tableware is microwave and freezer safe, making it ideal for a variety of uses.

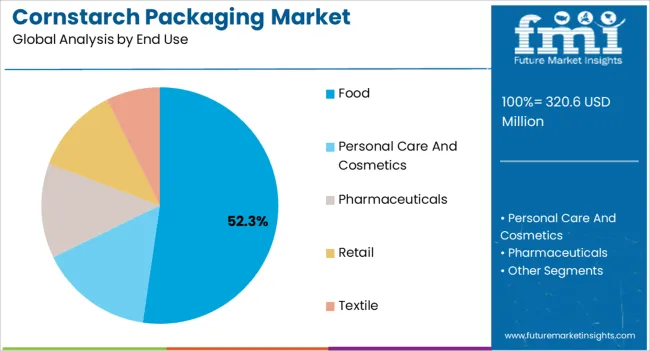
Cornstarch-based Packaging is Popular in the Food Industry due to Consumer Demand for Environmentally Friendly Packaging. Food Businesses to Acquire 60.6% Market Share of Cornstarch Packaging Market.

Cornstarch-based packaging goods are widely used in the food business. Cornstarch-based packaging can be utilized in a variety of food packaging applications, including bags, containers, trays, and films.

The cornstarch packaging for the food sector is biodegradable and compostable, which means that it can be disposed of in an ecologically sound manner. Lowering the amount of plastic waste that ends up in landfills or seas. Furthermore, cornstarch-based packaging can be created with a variety of barrier qualities. Making it useful for packing a variety of food items such as dry goods, snacks, and fresh produce.
Regional Analysis of the Market

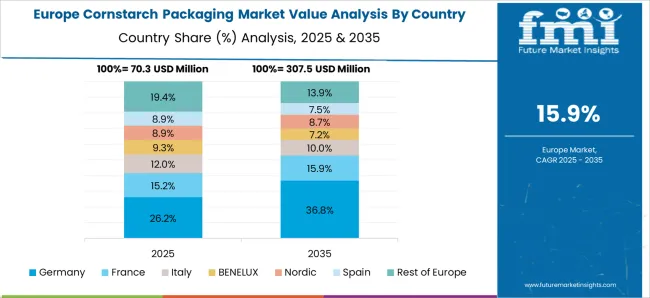
Europe is one of the Influential Markets in Cornstarch Packaging and Captured a Market Share of 30.6% in 2022

Europe is a significant market for cornstarch-based packaging because of rising consumer demand and government requirements. The region has been at the forefront of the transition to sustainable packaging solutions.

Several European countries have put regulations in place to limit plastic waste. Such as banning single-use plastic goods and incentivizing the use of sustainable packaging alternatives. This has increased demand for biodegradable and compostable cornstarch-based packaging goods, which are an appealing alternative to standard petroleum-based plastics.

The European cornstarch packaging market is also known for its high degree of innovation. Where manufacturers always produce new and improved products to fulfill the changing needs of consumers and the industry.

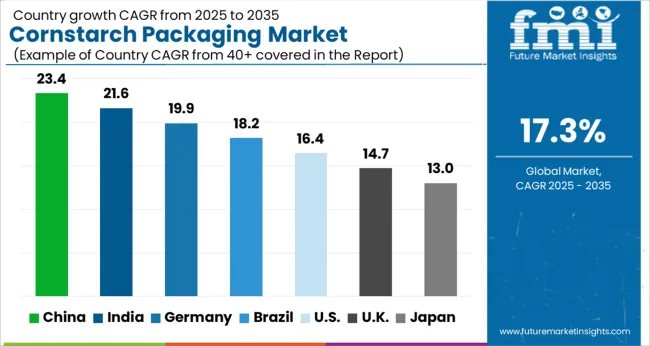
The United Kingdom to Witness a Transforming Growth Rate of 14.6% Between the Analysis Period

The United Kingdom is one of the top countries in Europe, with an increasing need for biodegradable packaging. The increased awareness of the sustainability elements of packaging products, together with recent government measures, is providing a favorable market setting for the country's growth of the researched industry.

The restriction on single-use plastics is one of the key factors influencing demand for biodegradable packaging. To combat plastic pollution, the United Kingdom government announced plans in 2021 to ban single-use plastic cutlery, plates, and polystyrene cups in England.
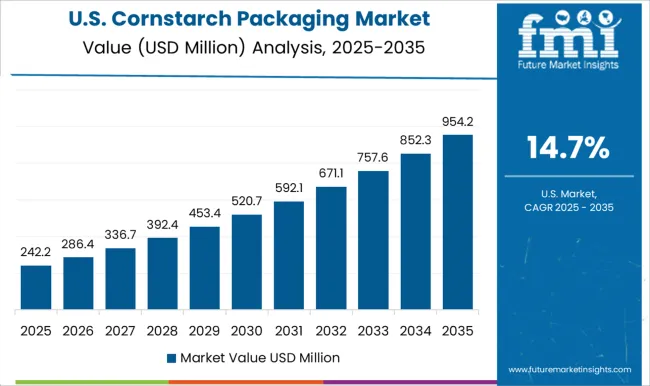
The United States is a Prominent Market, Holding a Market Share of 14.1% in 2022 Because of Environmental Concerns and Favorable Government Policies

The food sector in the United States is vast, and many businesses are seeking sustainable packaging solutions. To reduce their environmental effect and meet consumer demand for eco-friendly products. Cornstarch-based packaging is a biodegradable and compostable alternative to standard petroleum-based plastics, making it an appealing choice for businesses trying to lessen their environmental impact. Furthermore, numerous jurisdictions in the United States have established regulations to limit plastic waste. Such as prohibitions on certain single-use plastic products and plastic bag levies. These policies have raised the demand for environmentally friendly packaging solutions, such as cornstarch packaging.

Cornstarch-based Packaging Products have a Sizable Market in Asia Pacific

Given the region's vast population and expanding middle class, demand for packaged food and beverages has soared. As a result, there is a greater demand for environmentally friendly packaging alternatives, such as cornstarch-based packaging.

China is set to be one of the Lucrative Markets Globally, Recording a CAGR of 19.7% during the Forecast Period.

Many cornstarch-based packaging producers are also situated in China. The country has a substantial corn sector, which provides a convenient and low-cost source of raw materials for the manufacture of cornstarch-based packaging solutions. Chinese producers are investing in R&D to create new and novel cornstarch-based packaging goods with enhanced features such as strength, durability, and heat resistance.

Growing Awareness of the Benefits of Recycling and Bioplastics in India has Increased the Demand for Cornstarch Packaging. Region to Witness a CAGR of 17.2% during the Analysis Period.

The abundance of raw materials and rapid technological advancement in the field of cornstarch packaging are expected to be key market drivers.

According to the Packaging Industry Association of India (PIAI), the Indian packaging market is likely to be worth more than US$ 204.81 billion by the end of 2025. Rising per capita spending and high demand for superior products with lightweight and durable cornstarch packaging that protects them from contamination drive market growth over the forecast period.
Get the data you need at a Fraction of the cost

Personalize your report by choosing insights you need
and save 40%!

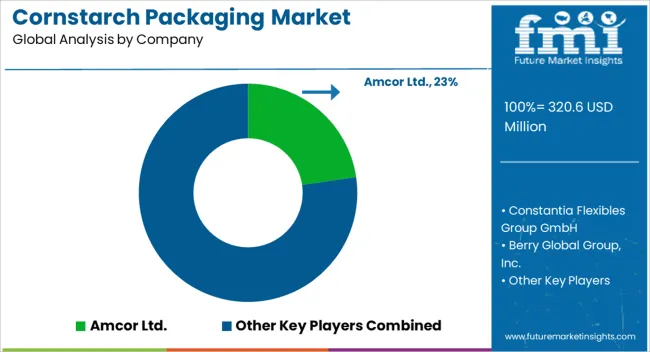
The Competitive Landscape of the Cornstarch Packaging Market is Diverse, with Several Players Operating in the Market

Some key players in the market include:

  • BASF SE - The company offers a range of biodegradable and compostable plastics. Including cornstarch-based packaging products, under its eco-flex brand.
  • NatureWorks LLC - The company is a leading manufacturer of biopolymers. Including cornstarch-based polylactic acid (PLA) packaging products.
  • Novamont S.p.A - The company offers a range of biodegradable and compostable plastics. Including cornstarch-based packaging products, under its Mater-Bi brand.
  • Biopak Pty Ltd - The company is a leading manufacturer of sustainable packaging solutions. Including cornstarch-based packaging products, for the foodservice industry.
  • Huhtamaki Oyj - The company is a global packaging solutions provider that offers a range of sustainable packaging solutions. Including cornstarch-based packaging products, for various industries.

Other notable players in the cornstarch packaging market include Cargill Inc., PSM Biodegradable Packaging, LLC, and Eco-Products, Inc.

The market is characterized by intense competition, with players focusing on innovation and product differentiation to gain a competitive edge. Manufacturers are investing in research and development to create new and improved cornstarch-based packaging products with enhanced properties such as increased strength, durability, and heat resistance. Additionally, players are focusing on developing customized packaging solutions for specific applications, such as food packaging, to cater to the specific needs of their customers.

Scope of the Report

Attribute Details
Growth Rate CAGR of 17.3% from 2023 to 2033
Base Year of Estimation 2023
Historical Data 2018 to 2022
Forecast Period 2023 to 2033
Quantitative Units Revenue in US$ million and Volume in Units and F-CAGR from 2023 to 2033
Report Coverage Revenue Forecast, Volume Forecast, Company Ranking, Competitive Landscape, growth factors, Trends, and Pricing Analysis
Key Segments Covered
  • By Product type
  • By Sales Channel
  • By End User Industry
  • By Region
Regions Covered
  • North America
  • Latin America
  • Europe
  • East Asia
  • South Asia
  • The Middle East & Africa
  • Oceania
Key Countries Profiled
  • The United States
  • Canada
  • Brazil
  • Mexico
  • Germany
  • Italy
  • France
  • The United Kingdom
  • Spain
  • Russia
  • China
  • Japan
  • India
  • GCC Countries
  • Australia
Key Companies Profiled
  • Amcor Ltd.
  • Constantia Flexibles Group GmbH
  • Berry Global Group, Inc.
  • Huhtamäki Oyj
  • Sonoco Products Company
  • Bemis Company, Inc.
  • Sealed Air Corporation
  • AR Packaging Group AB
  • Mondi Group
  • DS Smith Plc
  • CCL Industries Inc.
Customization & Pricing Available upon Request

Key Segments Covered in the Cornstarch Packaging Market Report

By Product Type:

  • Pouches
  • Bags
  • Boxes
  • Tableware

By End Use:

  • Food
  • Personal Care and Cosmetics
  • Pharmaceuticals
  • Retail
  • Textile

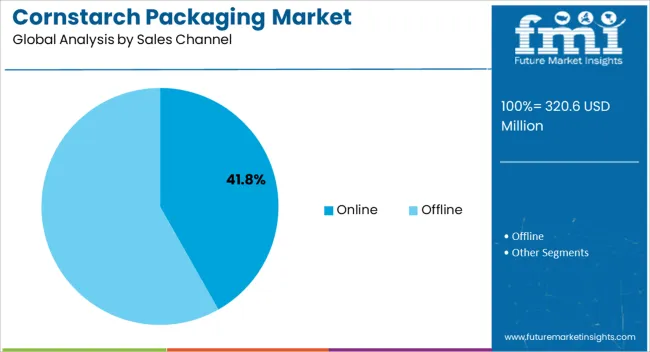
By Sales Channel:

  • Online
  • Offline

By Region:

  • North America
  • Latin America
  • Western Europe
  • Eastern Europe
  • Asia Pacific Excluding Japan (APEJ)
  • Japan
  • The Middle East & Africa (MEA)

Frequently Asked Questions

What is the Cornstarch Packaging Market Value in 2023?

The market is valued at US$ 233.0 million in 2023.

What is the Growth Forecast for Cornstarch Packaging Market?

The market is estimated to record a CAGR of 17.3% through 2033.

How was the Historical Performance of the Market?

The market registered an 8.5% CAGR from 2017 to 2022.

What is the Projected Size of the Market by 2033?

The global market is expected to reach US$ 1,145.0 million by 2033.

Which is the Projected Key Segment by Product Type?

Cornstarch-based tableware is likely to remain preferred through 2033.

Table of Content

1. Executive Summary | Cornstarch Packaging Market

    1.1. Global Market Outlook

    1.2. Demand-side Trends

    1.3. Supply-side Trends

    1.4. Technology Roadmap Analysis

    1.5. Analysis and Recommendations

2. Market Overview

    2.1. Market Coverage / Taxonomy

    2.2. Market Definition / Scope / Limitations

3. Market Background

    3.1. Market Dynamics

        3.1.1. Drivers

        3.1.2. Restraints

        3.1.3. Opportunity

        3.1.4. Trends

    3.2. Scenario Forecast

        3.2.1. Demand in Optimistic Scenario

        3.2.2. Demand in Likely Scenario

        3.2.3. Demand in Conservative Scenario

    3.3. Product Launches & Recent Developments

    3.4. Product Life Cycle Analysis

    3.5. Value Chain Analysis

        3.5.1. Supply Side Participants and their Roles

            3.5.1.1. Producers

            3.5.1.2. Mid-Level Participants (Traders/ Agents/ Brokers)

            3.5.1.3. Wholesalers and Distributors

        3.5.2. % of Operating Margin Analysis

        3.5.3. List of Existing and Potential Buyer’s

    3.6. Pricing Analysis

        3.6.1. Price Point Assessment by Region

        3.6.2. Price Point Assessment by production

        3.6.3. Price Forecast till 2033

        3.6.4. Factors affecting pricing

    3.7. Forecast Factors - Relevance & Impact

    3.8. Regulatory Landscape

    3.9. Regional Parent Market Outlook

    3.10. Production and Consumption Statistics

    3.11. Consumers Survey Analysis

    3.12. Macro-Economic Factors

4. Global Analysis 2018 to 2022 and Forecast, 2023 to 2033

    4.1. Historical Market Size Value (US$ Million) & Volume (Units) Analysis, 2018 to 2022

    4.2. Current and Future Market Size Value (US$ Million) & Volume (Units) Projections, 2023 to 2033

        4.2.1. Y-o-Y Growth Trend Analysis

        4.2.2. Absolute $ Opportunity Analysis

5. Global Analysis 2018 to 2022 and Forecast 2023 to 2033, By Product Type

    5.1. Introduction / Key Findings

    5.2. Historical Market Size Value (US$ Million) & Volume (Units) Analysis By Product Type, 2018 to 2022

    5.3. Current and Future Market Size Value (US$ Million) & Volume (Units) Analysis and Forecast By

        5.3.1. Product Type, 2023 to 2033

        5.3.2. Tableware

        5.3.3. Bags

        5.3.4. Pouches

        5.3.5. Boxes

    5.4. Y-o-Y Growth Trend Analysis By Product Type, 2018 to 2022

    5.5. Absolute $ Opportunity Analysis By Product Type, 2023 to 2033

6. Global Analysis 2018 to 2022 and Forecast 2023 to 2033, By Sales Channel

    6.1. Introduction / Key Findings

    6.2. Historical Market Size Value (US$ Million) & Volume (Units) Analysis By Sales Channel, 2018 to 2022

    6.3. Current and Future Market Size Value (US$ c) & Volume (Units) Analysis and Forecast By

        6.3.1. Sales Channel, 2023 to 2033

        6.3.2. Online

        6.3.3. Offline

    6.4. Y-o-Y Growth Trend Analysis By Sales Channel, 2018 to 2022

    6.5. Absolute $ Opportunity Analysis By Sales Channel, 2023 to 2033

7. Global Analysis 2018 to 2022 and Forecast 2023 to 2033, By End Use

    7.1. Introduction / Key Findings

    7.2. Historical Market Size Value (US$ Million) & Volume (Units) Analysis By End Use, 2018 to 2022

    7.3. Current and Future Market Size Value (US$ Million) & Volume (Units) Analysis and Forecast By

        7.3.1. End Use, 2023 to 2033

        7.3.2. Food

        7.3.3. Personal Care & Cosmetics

        7.3.4. Pharmaceuticals

        7.3.5. Textile

        7.3.6. Retail

    7.4. Y-o-Y Growth Trend Analysis By End Use, 2018 to 2022

    7.5. Absolute $ Opportunity Analysis By End Use, 2023 to 2033

8. Global Analysis 2018 to 2022 and Forecast 2023 to 2033, By Region

    8.1. Introduction

    8.2. Historical Market Size Value (US$ Million) & Volume (Units) Analysis By Region, 2018 to 2022

    8.3. Current Market Size Value (US$ Million) & Volume (Units) Analysis and Forecast By Region, 2023 to 2033

        8.3.1. North America

        8.3.2. Latin America

        8.3.3. Europe

        8.3.4. East Asia

        8.3.5. South Asia

        8.3.6. Oceania

        8.3.7. MEA

    8.4. Market Attractiveness Analysis By Region

9. North America Analysis 2018 to 2022 and Forecast 2023 to 2033, By Country

    9.1. Historical Market Size Value (US$ Million) & Volume (Units) Trend Analysis By Market Taxonomy,

        9.1.1. 2018 to 2022

    9.2. Market Size Value (US$ Million) & Volume (Units) Forecast By Market Taxonomy, 2023 to 2033

        9.2.1. By Country

            9.2.1.1. USA

            9.2.1.2. Canada

        9.2.2. By Product Type

        9.2.3. By Sales Channel

        9.2.4. By End Use

    9.3. Market Attractiveness Analysis

        9.3.1. By Country

        9.3.2. By Product Type

        9.3.3. By Sales Channel

        9.3.4. By End Use

    9.4. Key Takeaways

10. Latin America Analysis 2018 to 2022 and Forecast 2023 to 2033, By Country

    10.1. Historical Market Size Value (US$ Million) & Volume (Units) Trend Analysis By Market Taxonomy,

        10.1.1. 2018 to 2022

    10.2. Market Size Value (US$ Million) & Volume (Units) Forecast By Market Taxonomy, 2023 to 2033

        10.2.1. By Country

            10.2.1.1. Brazil

            10.2.1.2. Mexico

            10.2.1.3. Argentina

            10.2.1.4. Chile

            10.2.1.5. Peru

            10.2.1.6. Rest of Latin America

        10.2.2. By Product Type

        10.2.3. By Sales Channel

        10.2.4. By End Use

    10.3. Market Attractiveness Analysis

        10.3.1. By Country

        10.3.2. By Product Type

        10.3.3. By Sales Channel

        10.3.4. By End Use

    10.4. Key Takeaways

11. Europe Analysis 2018 to 2022 and Forecast 2023 to 2033, By Country

    11.1. Historical Market Size Value (US$ Million) & Volume (Units) Trend Analysis By Market Taxonomy,

        11.1.1. 2018 to 2022

    11.2. Market Size Value (US$ Million) & Volume (Units) Forecast By Market Taxonomy, 2023 to 2033

        11.2.1. By Country

            11.2.1.1. Germany

            11.2.1.2. Italy

            11.2.1.3. France

            11.2.1.4. UNITED KINGDOM

            11.2.1.5. Spain

            11.2.1.6. Russia

            11.2.1.7. BENELUX

            11.2.1.8. Poland

            11.2.1.9. Nordic Countries

            11.2.1.10. Rest of Europe

        11.2.2. By Product Type

        11.2.3. By Sales Channel

        11.2.4. By End Use

    11.3. Market Attractiveness Analysis

        11.3.1. By Country

        11.3.2. By Product Type

        11.3.3. By Sales Channel

        11.3.4. By End Use

    11.4. Key Takeaways

12. East Asia Analysis 2018 to 2022 and Forecast 2023 to 2033, By Country

    12.1. Historical Market Size Value (US$ Million) & Volume (Units) Trend Analysis By Market Taxonomy,

        12.1.1. 2018 to 2022

    12.2. Market Size Value (US$ Million) & Volume (Units) Forecast By Market Taxonomy, 2023 to 2033

        12.2.1. By Country

            12.2.1.1. China

            12.2.1.2. Japan

            12.2.1.3. South Korea

        12.2.2. By Product Type

        12.2.3. By Sales Channel

        12.2.4. By End Use

    12.3. Market Attractiveness Analysis

        12.3.1. By Country

        12.3.2. By Product Type

        12.3.3. By Sales Channel

        12.3.4. By End Use

    12.4. Key Takeaways

13. South Asia Analysis 2018 to 2022 and Forecast 2023 to 2033, By Country

    13.1. Historical Market Size Value (US$ Million) & Volume (Units) Trend Analysis By Market Taxonomy,

        13.1.1. 2018 to 2022

    13.2. Market Size Value (US$ Million) & Volume (Units) Forecast By Market Taxonomy, 2023 to 2033

        13.2.1. By Country

            13.2.1.1. India

            13.2.1.2. Thailand

            13.2.1.3. Malaysia

            13.2.1.4. Indonesia

            13.2.1.5. Singapore

            13.2.1.6. Rest of South Asia

        13.2.2. By Product Type

        13.2.3. By Sales Channel

        13.2.4. By End Use

    13.3. Market Attractiveness Analysis

        13.3.1. By Country

        13.3.2. By Product Type

        13.3.3. By Sales Channel

        13.3.4. By End Use

    13.4. Key Takeaways

14. Oceania Analysis 2018 to 2022 and Forecast 2023 to 2033, By Country

    14.1. Historical Market Size Value (US$ Million) & Volume (Units) Trend Analysis By Market Taxonomy,

        14.1.1. 2018 to 2022

    14.2. Market Size Value (US$ Million) & Volume (Units) Forecast By Market Taxonomy, 2023 to 2033

        14.2.1. By Country

            14.2.1.1. Australia

            14.2.1.2. New Zealand

        14.2.2. By Product Type

        14.2.3. By Sales Channel

        14.2.4. By End Use

    14.3. Market Attractiveness Analysis

        14.3.1. By Country

        14.3.2. By Product Type

        14.3.3. By Sales Channel

        14.3.4. By End Use

    14.4. Key Takeaways

15. MEA Analysis 2018 to 2022 and Forecast 2023 to 2033, By Country

    15.1. Historical Market Size Value (US$ Million) & Volume (Units) Trend Analysis By Market Taxonomy,

        15.1.1. 2018 to 2022

    15.2. Market Size Value (US$ Million) & Volume (Units) Forecast By Market Taxonomy, 2023 to 2033

        15.2.1. By Country

            15.2.1.1. GCC Countries

            15.2.1.2. South Africa

            15.2.1.3. Central Africa

            15.2.1.4. North Africa

        15.2.2. By Product Type

        15.2.3. By Sales Channel

        15.2.4. By End Use

    15.3. Market Attractiveness Analysis

        15.3.1. By Country

        15.3.2. By Product Type

        15.3.3. By Sales Channel

        15.3.4. By End Use

    15.4. Key Takeaways

16. Key Countries Analysis

    16.1. USA

        16.1.1. Pricing Analysis

        16.1.2. Market Share Analysis, 2022

            16.1.2.1. By Product Type

            16.1.2.2. By Sales Channel

            16.1.2.3. By End Use

    16.2. Canada

        16.2.1. Pricing Analysis

        16.2.2. Market Share Analysis, 2022

            16.2.2.1. By Product Type

            16.2.2.2. By Sales Channel

            16.2.2.3. By End Use

    16.3. Brazil

        16.3.1. Pricing Analysis

        16.3.2. Market Share Analysis, 2022

            16.3.2.1. By Product Type

            16.3.2.2. By Sales Channel

            16.3.2.3. By End Use

    16.4. Mexico

        16.4.1. Pricing Analysis

        16.4.2. Market Share Analysis, 2022

            16.4.2.1. By Product Type

            16.4.2.2. By Sales Channel

            16.4.2.3. By End Use

    16.5. Argentina

        16.5.1. Pricing Analysis

        16.5.2. Market Share Analysis, 2022

            16.5.2.1. By Product Type

            16.5.2.2. By Sales Channel

            16.5.2.3. By End Use

    16.6. Chile

        16.6.1. Pricing Analysis

        16.6.2. Market Share Analysis, 2022

            16.6.2.1. By Product Type

            16.6.2.2. By Sales Channel

            16.6.2.3. By End Use

    16.7. Peru

        16.7.1. Pricing Analysis

        16.7.2. Market Share Analysis, 2022

            16.7.2.1. By Product Type

            16.7.2.2. By Sales Channel

            16.7.2.3. By End Use

    16.8. Germany

        16.8.1. Pricing Analysis

        16.8.2. Market Share Analysis, 2022

            16.8.2.1. By Product Type

            16.8.2.2. By Sales Channel

            16.8.2.3. By End Use

    16.9. Italy

        16.9.1. Pricing Analysis

        16.9.2. Market Share Analysis, 2022

            16.9.2.1. By Product Type

            16.9.2.2. By Sales Channel

            16.9.2.3. By End Use

    16.10. France

        16.10.1. Pricing Analysis

        16.10.2. Market Share Analysis, 2022

            16.10.2.1. By Product Type

            16.10.2.2. By Sales Channel

            16.10.2.3. By End Use

    16.11. Spain

        16.11.1. Pricing Analysis

        16.11.2. Market Share Analysis, 2022

            16.11.2.1. By Product Type

            16.11.2.2. By Sales Channel

            16.11.2.3. By End Use

    16.12. UNITED KINGDOM

        16.12.1. Pricing Analysis

        16.12.2. Market Share Analysis, 2022

            16.12.2.1. By Product Type

            16.12.2.2. By Sales Channel

            16.12.2.3. By End Use

    16.13. Russia

        16.13.1. Pricing Analysis

        16.13.2. Market Share Analysis, 2022

            16.13.2.1. By Product Type

            16.13.2.2. By Sales Channel

            16.13.2.3. By End Use

    16.14. Poland

        16.14.1. Pricing Analysis

        16.14.2. Market Share Analysis, 2022

            16.14.2.1. By Product Type

            16.14.2.2. By Sales Channel

            16.14.2.3. By End Use

    16.15. BENELUX

        16.15.1. Pricing Analysis

        16.15.2. Market Share Analysis, 2022

            16.15.2.1. By Product Type

            16.15.2.2. By Sales Channel

            16.15.2.3. By End Use

    16.16. Nordic Countries

        16.16.1. Pricing Analysis

        16.16.2. Market Share Analysis, 2022

            16.16.2.1. By Product Type

            16.16.2.2. By Sales Channel

            16.16.2.3. By End Use

    16.17. China

        16.17.1. Pricing Analysis

        16.17.2. Market Share Analysis, 2022

            16.17.2.1. By Product Type

            16.17.2.2. By Sales Channel

            16.17.2.3. By End Use

    16.18. Japan

        16.18.1. Pricing Analysis

        16.18.2. Market Share Analysis, 2022

            16.18.2.1. By Product Type

            16.18.2.2. By Sales Channel

            16.18.2.3. By End Use

    16.19. South Korea

        16.19.1. Pricing Analysis

        16.19.2. Market Share Analysis, 2022

            16.19.2.1. By Product Type

            16.19.2.2. By Sales Channel

            16.19.2.3. By End Use

    16.20. India

        16.20.1. Pricing Analysis

        16.20.2. Market Share Analysis, 2022

            16.20.2.1. By Product Type

            16.20.2.2. By Sales Channel

            16.20.2.3. By End Use

    16.21. Thailand

        16.21.1. Pricing Analysis

        16.21.2. Market Share Analysis, 2022

            16.21.2.1. By Product Type

            16.21.2.2. By Sales Channel

            16.21.2.3. By End Use

    16.22. Indonesia

        16.22.1. Pricing Analysis

        16.22.2. Market Share Analysis, 2022

            16.22.2.1. By Product Type

            16.22.2.2. By Sales Channel

            16.22.2.3. By End Use

    16.23. Malaysia

        16.23.1. Pricing Analysis

        16.23.2. Market Share Analysis, 2022

            16.23.2.1. By Product Type

            16.23.2.2. By Sales Channel

            16.23.2.3. By End Use

    16.24. Singapore

        16.24.1. Pricing Analysis

        16.24.2. Market Share Analysis, 2022

            16.24.2.1. By Product Type

            16.24.2.2. By Sales Channel

            16.24.2.3. By End Use

    16.25. Australia

        16.25.1. Pricing Analysis

        16.25.2. Market Share Analysis, 2022

            16.25.2.1. By Product Type

            16.25.2.2. By Sales Channel

            16.25.2.3. By End Use

    16.26. New Zealand

        16.26.1. Pricing Analysis

        16.26.2. Market Share Analysis, 2022

            16.26.2.1. By Product Type

            16.26.2.2. By Sales Channel

            16.26.2.3. By End Use

    16.27. GCC Countries

        16.27.1. Pricing Analysis

        16.27.2. Market Share Analysis, 2022

            16.27.2.1. By Product Type

            16.27.2.2. By Sales Channel

            16.27.2.3. By End Use

    16.28. South Africa

        16.28.1. Pricing Analysis

        16.28.2. Market Share Analysis, 2022

            16.28.2.1. By Product Type

            16.28.2.2. By Sales Channel

            16.28.2.3. By End Use

    16.29. North Africa

        16.29.1. Pricing Analysis

        16.29.2. Market Share Analysis, 2022

            16.29.2.1. By Product Type

            16.29.2.2. By Sales Channel

            16.29.2.3. By End Use

    16.30. Central Africa

        16.30.1. Pricing Analysis

        16.30.2. Market Share Analysis, 2022

            16.30.2.1. By Product Type

            16.30.2.2. By Sales Channel

            16.30.2.3. By End Use

17. Market Structure Analysis

    17.1. Competition Dashboard

    17.2. Competition Benchmarking

    17.3. Market Share Analysis of Top Players

        17.3.1. By Regional

        17.3.2. By Product Type

        17.3.3. By Sales Channel

        17.3.4. By End Use

18. Competition Analysis

    18.1. Competition Deep Dive

        18.1.1. L&P Packaging Co. Ltd

            18.1.1.1. Overview

            18.1.1.2. Product Portfolio

            18.1.1.3. Profitability by Market Segments (Product/Age /Sales Channel/Region)

            18.1.1.4. Sales Footprint

            18.1.1.5. Strategy Overview

                18.1.1.5.1. Marketing Strategy

                18.1.1.5.2. Product Strategy

                18.1.1.5.3. Channel Strategy

        18.1.2. Vegware

            18.1.2.1. Overview

            18.1.2.2. Product Portfolio

            18.1.2.3. Profitability by Market Segments (Product/Age /Sales Channel/Region)

            18.1.2.4. Sales Footprint

            18.1.2.5. Strategy Overview

                18.1.2.5.1. Marketing Strategy

                18.1.2.5.2. Product Strategy

                18.1.2.5.3. Channel Strategy

        18.1.3. Navkar Plastic

            18.1.3.1. Overview

            18.1.3.2. Product Portfolio

            18.1.3.3. Profitability by Market Segments (Product/Age /Sales Channel/Region)

            18.1.3.4. Sales Footprint

            18.1.3.5. Strategy Overview

                18.1.3.5.1. Marketing Strategy

                18.1.3.5.2. Product Strategy

                18.1.3.5.3. Channel Strategy

        18.1.4. Easy Green Eco Packaging Co., Ltd.

            18.1.4.1. Overview

            18.1.4.2. Product Portfolio

            18.1.4.3. Profitability by Market Segments (Product/Age /Sales Channel/Region)

            18.1.4.4. Sales Footprint

            18.1.4.5. Strategy Overview

                18.1.4.5.1. Marketing Strategy

                18.1.4.5.2. Product Strategy

                18.1.4.5.3. Channel Strategy

        18.1.5. Gainyo

            18.1.5.1. Overview

            18.1.5.2. Product Portfolio

            18.1.5.3. Profitability by Market Segments (Product/Age /Sales Channel/Region)

            18.1.5.4. Sales Footprint

            18.1.5.5. Strategy Overview

                18.1.5.5.1. Marketing Strategy

                18.1.5.5.2. Product Strategy

                18.1.5.5.3. Channel Strategy

        18.1.6. Weavabel

            18.1.6.1. Overview

            18.1.6.2. Product Portfolio

            18.1.6.3. Profitability by Market Segments (Product/Age /Sales Channel/Region)

            18.1.6.4. Sales Footprint

            18.1.6.5. Strategy Overview

                18.1.6.5.1. Marketing Strategy

                18.1.6.5.2. Product Strategy

                18.1.6.5.3. Channel Strategy

        18.1.7. Yinji Paper Products Factory

            18.1.7.1. Overview

            18.1.7.2. Product Portfolio

            18.1.7.3. Profitability by Market Segments (Product/Age /Sales Channel/Region)

            18.1.7.4. Sales Footprint

            18.1.7.5. Strategy Overview

                18.1.7.5.1. Marketing Strategy

                18.1.7.5.2. Product Strategy

                18.1.7.5.3. Channel Strategy

        18.1.8. Hefei Hyde Environment Protection Technology Co., Ltd.

            18.1.8.1. Overview

            18.1.8.2. Product Portfolio

            18.1.8.3. Profitability by Market Segments (Product/Age /Sales Channel/Region)

            18.1.8.4. Sales Footprint

            18.1.8.5. Strategy Overview

                18.1.8.5.1. Marketing Strategy

                18.1.8.5.2. Product Strategy

                18.1.8.5.3. Channel Strategy

        18.1.9. Somya Enterprises

            18.1.9.1. Overview

            18.1.9.2. Product Portfolio

            18.1.9.3. Profitability by Market Segments (Product/Age /Sales Channel/Region)

            18.1.9.4. Sales Footprint

            18.1.9.5. Strategy Overview

                18.1.9.5.1. Marketing Strategy

                18.1.9.5.2. Product Strategy

                18.1.9.5.3. Channel Strategy

        18.1.10. Biopacktech Co.,Ltd

            18.1.10.1. Overview

            18.1.10.2. Product Portfolio

            18.1.10.3. Profitability by Market Segments (Product/Age /Sales Channel/Region)

            18.1.10.4. Sales Footprint

            18.1.10.5. Strategy Overview

                18.1.10.5.1. Marketing Strategy

                18.1.10.5.2. Product Strategy

                18.1.10.5.3. Channel Strategy

        18.1.11. Green Man Packaging.

            18.1.11.1. Overview

            18.1.11.2. Product Portfolio

            18.1.11.3. Profitability by Market Segments (Product/Age /Sales Channel/Region)

            18.1.11.4. Sales Footprint

            18.1.11.5. Strategy Overview

                18.1.11.5.1. Marketing Strategy

                18.1.11.5.2. Product Strategy

                18.1.11.5.3. Channel Strategy

        18.1.12. Eco Packaging Solutions

            18.1.12.1. Overview

            18.1.12.2. Product Portfolio

            18.1.12.3. Profitability by Market Segments (Product/Age /Sales Channel/Region)

            18.1.12.4. Sales Footprint

            18.1.12.5. Strategy Overview

                18.1.12.5.1. Marketing Strategy

                18.1.12.5.2. Product Strategy

                18.1.12.5.3. Channel Strategy

        18.1.13. Packtato

            18.1.13.1. Overview

            18.1.13.2. Product Portfolio

            18.1.13.3. Profitability by Market Segments (Product/Age /Sales Channel/Region)

            18.1.13.4. Sales Footprint

            18.1.13.5. Strategy Overview

                18.1.13.5.1. Marketing Strategy

                18.1.13.5.2. Product Strategy

                18.1.13.5.3. Channel Strategy

        18.1.14. CHANNEL PACKAGING PVT LTD.

            18.1.14.1. Overview

            18.1.14.2. Product Portfolio

            18.1.14.3. Profitability by Market Segments (Product/Age /Sales Channel/Region)

            18.1.14.4. Sales Footprint

            18.1.14.5. Strategy Overview

                18.1.14.5.1. Marketing Strategy

                18.1.14.5.2. Product Strategy

                18.1.14.5.3. Channel Strategy

        18.1.15. Agroha Industries

            18.1.15.1. Overview

            18.1.15.2. Product Portfolio

            18.1.15.3. Profitability by Market Segments (Product/Age /Sales Channel/Region)

            18.1.15.4. Sales Footprint

            18.1.15.5. Strategy Overview

                18.1.15.5.1. Marketing Strategy

                18.1.15.5.2. Product Strategy

                18.1.15.5.3. Channel Strategy

        18.1.16. Easy Flux

            18.1.16.1. Overview

            18.1.16.2. Product Portfolio

            18.1.16.3. Profitability by Market Segments (Product/Age /Sales Channel/Region)

            18.1.16.4. Sales Footprint

            18.1.16.5. Strategy Overview

                18.1.16.5.1. Marketing Strategy

                18.1.16.5.2. Product Strategy

                18.1.16.5.3. Channel Strategy

        18.1.17. Green Olive Environmental Technology Co., Ltd.

            18.1.17.1. Overview

            18.1.17.2. Product Portfolio

            18.1.17.3. Profitability by Market Segments (Product/Age /Sales Channel/Region)

            18.1.17.4. Sales Footprint

            18.1.17.5. Strategy Overview

                18.1.17.5.1. Marketing Strategy

                18.1.17.5.2. Product Strategy

                18.1.17.5.3. Channel Strategy

        18.1.18. EcoGreen Packaging Pte Ltd

            18.1.18.1. Overview

            18.1.18.2. Product Portfolio

            18.1.18.3. Profitability by Market Segments (Product/Age /Sales Channel/Region)

            18.1.18.4. Sales Footprint

            18.1.18.5. Strategy Overview

                18.1.18.5.1. Marketing Strategy

                18.1.18.5.2. Product Strategy

                18.1.18.5.3. Channel Strategy

19. Assumptions & Acronyms Used

20. Research Methodology

Recommendations

Packaging

FMCG Packaging Market

May 2023

REP-GB-110

324 pages

Explore Packaging Insights

View Reports
Future Market Insights

Cornstarch Packaging Market

Schedule a Call