The cooling tower fans industry stands at the threshold of a decade-long expansion trajectory that promises to reshape industrial cooling technology, energy-efficient ventilation solutions, and automated fan control applications. The market's journey from USD 222.7 million in 2025 to USD 317.2 million by 2035 represents substantial growth, demonstrating the accelerating adoption of advanced fan configurations and cooling optimization technology across chemical manufacturing, power generation facilities, petrochemical operations, and specialty industrial sectors.
The first half of the decade (2025-2030) will witness the market climbing from USD 222.7 million to approximately USD 267.3 million, adding USD 44.6 million in value, which constitutes 47% of the total forecast growth period. This phase will be characterized by the rapid adoption of variable frequency drive systems, driven by increasing industrial energy efficiency requirements and the growing need for high-performance cooling equipment worldwide. Advanced automation capabilities and electronically commutated motor systems will become standard expectations rather than premium options.
The latter half (2030-2035) will witness sustained growth from USD 267.3 million to USD 317.2 million, representing an addition of USD 49.9 million or 53% of the decade's expansion. This period will be defined by mass market penetration of specialized smart cooling systems, integration with comprehensive facility management platforms, and seamless compatibility with existing industrial infrastructure. The market trajectory signals fundamental shifts in how industrial facilities approach thermal management optimization and operational efficiency, with participants positioned to benefit from sustained demand across multiple fan types and industry application segments.
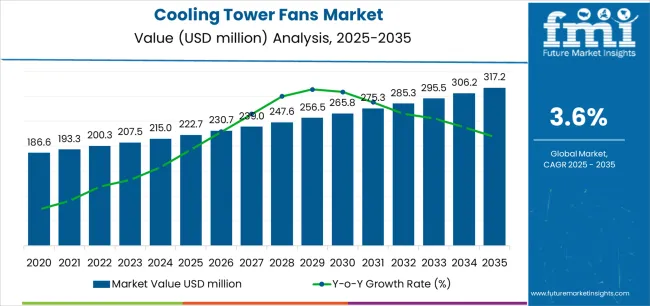
The Cooling Tower Fans market demonstrates distinct growth phases with varying market characteristics and competitive dynamics. Between 2025 and 2030, the market progresses through its energy efficiency adoption phase, expanding from USD 222.7 million to USD 267.3 million with steady annual increments averaging 3.6% growth. This period showcases the transition from conventional fixed-speed fan systems to advanced variable frequency drive configurations with enhanced control capabilities and integrated monitoring systems becoming mainstream features.
The 2025-2030 phase adds USD 44.6 million to market value, representing 47% of total decade expansion. Market maturation factors include standardization of electronically commutated motor protocols, declining component costs for VFD-enabled cooling tower fans, and increasing industry awareness of energy reduction benefits reaching 70-75% operational efficiency in industrial cooling applications. Competitive landscape evolution during this period features established cooling equipment manufacturers like SPX Cooling Technologies and Baltimore Aircoil Company expanding their energy-efficient fan portfolios while specialty manufacturers focus on advanced control development and enhanced noise reduction capabilities.
From 2030 to 2035, market dynamics shift toward advanced automation integration and global industrial expansion, with growth continuing from USD 267.3 million to USD 317.2 million, adding USD 49.9 million or 53% of total expansion. This phase transition centers on fully integrated cooling management systems, integration with comprehensive facility monitoring networks, and deployment across diverse industrial and commercial scenarios, becoming standard rather than specialized applications. The competitive environment matures with focus shifting from basic mechanical capability to comprehensive thermal optimization systems and integration with predictive maintenance platforms.
| Metric | Value |
|---|---|
| Market Value (2025) | USD 222.7 million |
| Market Forecast (2035) | USD 317.2 million |
| Growth Rate | 3.6% CAGR |
| Leading Technology | Axial Cooling Tower Fans Product Type |
| Primary Application | Chemical Manufacturing End-Use Segment |
The market demonstrates strong fundamentals with axial cooling tower fan systems capturing a dominant share through advanced airflow management and energy optimization capabilities. Chemical manufacturing applications drive primary demand, supported by increasing industrial process cooling and facility thermal management requirements. Geographic expansion remains concentrated in developed industrial regions with established cooling infrastructure, while emerging economies show accelerating adoption rates driven by manufacturing capacity expansion and rising energy efficiency standards.
Market expansion rests on three fundamental shifts driving adoption across the industrial cooling, power generation, and manufacturing sectors. First, industrial capacity expansion demand creates compelling operational advantages through cooling tower fans that provide efficient heat rejection without excessive energy consumption, enabling facilities to maintain optimal process temperatures while maximizing productivity and reducing operational costs. Second, energy efficiency modernization accelerates as industrial operations worldwide seek advanced VFD-enabled systems that replace fixed-speed fan configurations, enabling power consumption reduction and thermal control optimization that align with environmental regulations and operational cost standards.
Third, data center proliferation drives adoption from technology facilities and cloud computing companies requiring effective heat dissipation solutions that minimize equipment exposure to elevated temperatures while maintaining operational reliability during continuous operation and high-density computing operations. However, growth faces headwinds from capital investment challenges that vary across industrial facilities regarding the procurement of advanced electronically commutated motor systems and automation controls, which may limit adoption in price-sensitive manufacturing environments. Installation complexity also persists regarding retrofitting existing cooling towers and structural modification requirements that may reduce effectiveness in aging facility infrastructure and space-constrained installations, which affect equipment integration and operational deployment.
The cooling tower fans market represents a specialized yet critical industrial equipment opportunity driven by expanding global manufacturing capacity, sustainable cooling infrastructure modernization, and the need for superior energy efficiency in diverse industrial applications. As facilities worldwide seek to achieve 70-75% fan system efficiency, reduce energy consumption by 40-50%, and integrate advanced control systems with remote monitoring platforms, cooling tower fans are evolving from basic mechanical ventilation equipment to sophisticated thermal management solutions ensuring operational efficiency and equipment reliability.
The market's growth trajectory from USD 222.7 million in 2025 to USD 317.2 million by 2035 at a 3.6% CAGR reflects fundamental shifts in industrial sustainability requirements and energy optimization. Geographic expansion opportunities are particularly pronounced in Asia Pacific markets, while the dominance of axial fan systems (72% market share) and chemical manufacturing applications (27% share) provides clear strategic focus areas.
Strengthening the dominant axial cooling tower fan segment (72% market share) through enhanced electronically commutated motor configurations, superior airflow capacity, and automated control systems. This pathway focuses on optimizing motor efficiency, improving aerodynamic blade designs, extending equipment effectiveness to 85-90% energy efficiency ratings, and developing specialized fans for diverse cooling tower applications. Market leadership consolidation through advanced motor engineering and VFD integration enables premium positioning while defending competitive advantages against conventional fixed-speed equipment. Expected revenue pool: USD 19.8-26.1 million
Rapid manufacturing capacity and industrial development growth across Asia Pacific creates substantial expansion opportunities through local fan production capabilities and technology transfer partnerships. Growing chemical processing facilities and government industrial development initiatives drive sustained demand for advanced cooling tower fan systems. Regional manufacturing strategies reduce import costs, enable faster technical support, and position companies advantageously for industrial procurement programs while accessing growing domestic markets. Expected revenue pool: USD 17.2-22.7 million
Expansion within the dominant chemical manufacturing segment (27% market share) through specialized fan systems addressing high-temperature process cooling standards and corrosive environment requirements. This pathway encompasses corrosion-resistant blade materials, specialized coatings for chemical exposure, and compatibility with diverse manufacturing process cooling requirements. Premium positioning reflects superior operational reliability and comprehensive safety compliance supporting modern petrochemical, specialty chemical, and industrial chemical production. Expected revenue pool: USD 14.5-19.1 million
Strategic advancement in VFD-enabled fan adoption requires enhanced motor control capabilities and specialized automation systems addressing industrial operational requirements. This pathway addresses energy-optimized cooling operations, load-matching capability, and dynamic speed control responding to real-time thermal demands with advanced electronic controls for demanding continuous operation conditions. Premium pricing reflects energy leadership and operational cost savings through reduced power consumption requirements. Expected revenue pool: USD 12.9-17 million
Development of specialized high-reliability fan systems for power plant cooling towers, data center thermal management, and mission-critical facility applications, addressing specific uptime requirements and redundancy optimization demands. This pathway encompasses remote-controlled operation, predictive maintenance integration, and continuous operation alternatives for critical infrastructure environments. Technology differentiation through proprietary monitoring platforms enables diversified revenue streams while reducing dependency on traditional industrial applications. Expected revenue pool: USD 11-14.5 million
Expansion targeting urban industrial facilities, commercial HVAC applications, and noise-sensitive installations through specialized low-sound fan configurations. This pathway encompasses advanced acoustic engineering, vibration isolation systems, and specialized blade designs for quiet operation requirements. Market development through application-specific engineering enables differentiated positioning while accessing growing urban industrial markets requiring noise compliance solutions. Expected revenue pool: USD 9.9-13 million
Development of comprehensive fan monitoring systems addressing maintenance optimization and failure prevention requirements across cooling tower installations. This pathway encompasses IoT sensor integration, AI-powered vibration analytics, and comprehensive asset management platforms. Premium positioning reflects operational excellence and total cost of ownership optimization while enabling access to digitalization-focused industrial facilities and technology-driven equipment partnerships. Expected revenue pool: USD 8.4-11 million
Primary Classification: The market segments by product type into Axial Cooling Tower Fans and Centrifugal Cooling Tower Fans categories, representing the evolution from basic air movement equipment to specialized fan solutions for comprehensive industrial cooling optimization.
Secondary Classification: End-use segmentation divides the market into Chemical Manufacturing, Power Generation, Petrochemicals & Oil & Gas, Food & Beverage Manufacturing, and Other Industries, reflecting distinct requirements for operational reliability, cooling capacity, and industrial application standards.
Regional Classification: Geographic distribution covers Asia Pacific, North America, Europe, Middle East & Africa, and Latin America, with developed industrial markets leading technology adoption while emerging economies show accelerating growth patterns driven by manufacturing capacity development programs.
The segmentation structure reveals technology progression from conventional fixed-speed mechanical fans toward VFD-enabled systems with enhanced automation and remote monitoring capabilities, while application diversity spans from chemical processing to data center cooling requiring advanced thermal management solutions.
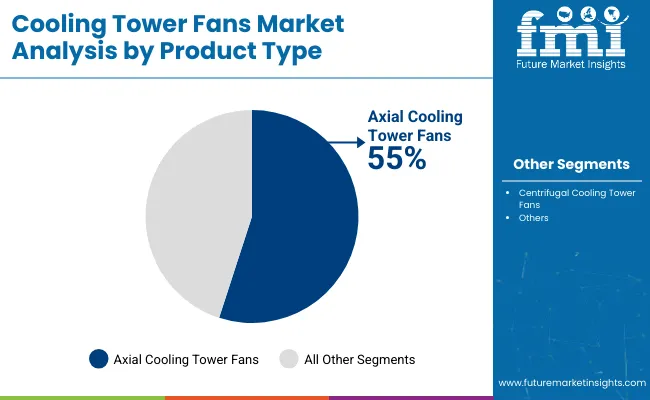
Market Position: Axial cooling tower fan systems command the leading position in the Cooling Tower Fans market with approximately 72% market share through advanced airflow characteristics, including superior volumetric flow rates, efficient air movement capability, and operational simplicity that enable industrial facilities to achieve optimal heat rejection across diverse cooling tower configurations.
Value Drivers: The segment benefits from facility operator preference for high-volume airflow systems that provide consistent cooling performance, reduced installation complexity, and energy efficiency optimization without requiring extensive structural modifications. Advanced aerodynamic features enable variable pitch control, direct drive configurations, and integration with existing cooling tower infrastructure, where airflow performance and mechanical reliability represent critical operational requirements.
Competitive Advantages: Axial cooling tower fan systems differentiate through proven mechanical simplicity, optimal airflow-to-power consumption ratios, and integration with standard cooling tower designs that enhance operational effectiveness while maintaining equipment costs suitable for diverse industrial applications and facility budgets.
Key market characteristics:
Centrifugal cooling tower fan systems maintain significant market presence (28% share) due to their high-pressure air delivery capabilities in specialized cooling tower configurations requiring elevated static pressure performance and space-constrained installations.
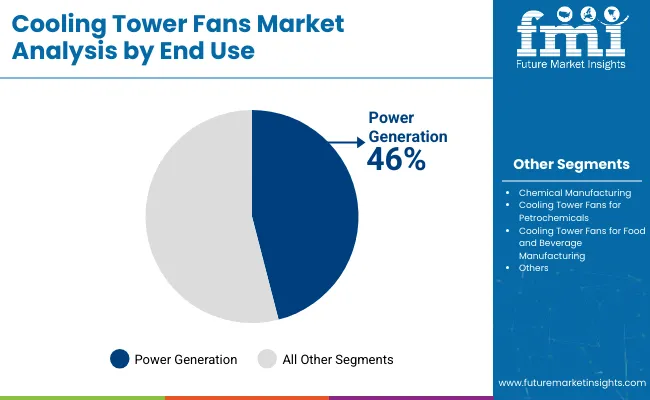
Market Context: Chemical manufacturing applications dominate the Cooling Tower Fans market with approximately 27% market share due to widespread adoption of industrial cooling systems and increasing focus on process temperature control, reactor cooling requirements, and chemical production applications that maximize operational efficiency while maintaining thermal management standards.
Appeal Factors: Chemical facilities prioritize equipment corrosion resistance, operational reliability, and integration with existing process cooling infrastructure that enables coordinated thermal management operations across multiple production units. The segment benefits from substantial chemical industry capacity investment and specialty chemical production programs that emphasize the acquisition of reliable cooling equipment for petrochemical synthesis, polymer production, and industrial chemical manufacturing applications.
Growth Drivers: Petrochemical capacity expansion programs incorporate specialized cooling tower fans as essential equipment for exothermic reaction control operations, while specialty chemical production growth increases demand for precision thermal management capabilities that comply with process safety standards and optimize production quality.
Market Challenges: Corrosive chemical environments and high-temperature operating conditions may limit equipment lifespan across different chemical processes or facility scenarios.
Application dynamics include:
Power generation operations maintain substantial equipment demand (26% share) through thermal power plant cooling towers, combined cycle facilities, and nuclear plant auxiliary cooling applications. Petrochemicals and oil and gas industries capture significant portions (18% share) through refinery cooling systems, gas processing facilities, and upstream production operations requiring industrial-grade cooling solutions.
Growth Accelerators: Industrial capacity expansion drives primary adoption as cooling tower fans provide essential heat rejection capabilities that enable manufacturing facilities to maintain optimal process temperatures beneath demanding production schedules without excessive energy consumption, supporting continuous operation requirements and industrial reliability missions that require efficient thermal management applications. Energy efficiency transformation demand accelerates market expansion as facilities seek VFD-enabled fan systems that eliminate energy waste while maintaining cooling effectiveness during variable load conditions and seasonal temperature fluctuations. Data center infrastructure spending increases worldwide, creating sustained demand for specialized cooling tower fans that complement precision thermal management processes and provide operational flexibility in mission-critical computing environments.
Growth Inhibitors: Capital cost challenges vary across industrial facilities regarding the procurement of VFD-enabled fans and automation control systems, which may limit operational flexibility and market penetration in regions with constrained capital budgets or price-sensitive manufacturing sectors. Maintenance complexity persists regarding specialized electronically commutated motors and control systems that may reduce effectiveness in facilities lacking technical expertise, preventive maintenance programs, or continuous monitoring capability, affecting equipment reliability and operational continuity. Market fragmentation across multiple fan specifications and cooling tower design standards creates compatibility concerns between different equipment suppliers and existing facility infrastructure.
Market Evolution Patterns: Adoption accelerates in large-scale industrial operations and premium chemical manufacturing sectors where reliability requirements justify advanced fan system costs, with geographic concentration in developed industrial regions transitioning toward mainstream adoption in emerging economies driven by manufacturing capacity development and environmental regulation enforcement. Technology development focuses on enhanced motor efficiency, improved aerodynamic designs, and integration with facility management platforms that optimize equipment deployment and energy consumption. The market could face disruption if alternative cooling technologies or closed-loop thermal management systems significantly limit the deployment of evaporative cooling tower equipment in industrial applications, though the industry's fundamental need for cost-effective heat rejection continues to make cooling tower fans irreplaceable in industrial thermal management.
The cooling tower fans market demonstrates varied regional dynamics with Growth Leaders including India (4.2% CAGR) and the United States (3.8% CAGR) driving expansion through industrial capacity additions and data center infrastructure programs. Strong Performers encompass China (3.7% CAGR), South Korea (3.5% CAGR), and the United Kingdom (3.4% CAGR), benefiting from established manufacturing industries and advanced cooling technology adoption. Steady Markets feature Germany (3.3% CAGR) and Japan (3.2% CAGR), where specialized industrial applications and equipment replacement programs support consistent growth patterns.
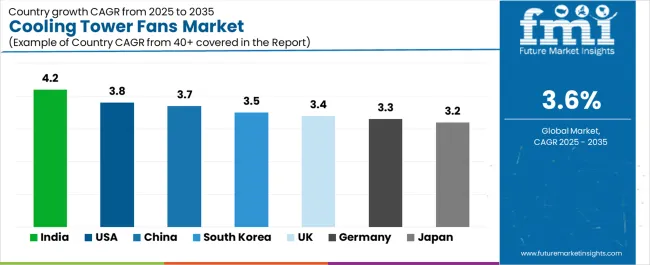
| Country | CAGR (2025-2035) |
|---|---|
| India | 4.2% |
| United States | 3.8% |
| China | 3.7% |
| South Korea | 3.5% |
| United Kingdom | 3.4% |
| Germany | 3.3% |
| Japan | 3.2% |
Regional synthesis reveals Asia Pacific markets leading adoption through manufacturing capacity expansion and industrial infrastructure development, while North American countries maintain strong growth supported by data center buildout and energy efficiency regulations. European markets show moderate expansion driven by industrial equipment modernization and sustainability procurement trends.
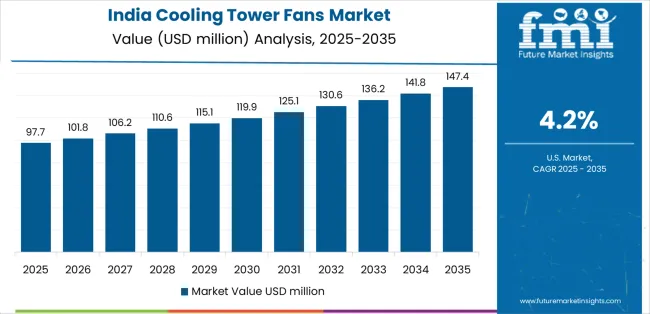
India leads growth momentum with a 4.2% CAGR, driven by rapid power generation capacity expansion, refinery and petrochemical project intensification, and emerging manufacturing facility development across major industrial states including Gujarat, Maharashtra, Tamil Nadu, and Andhra Pradesh. Power sector capacity additions through thermal power plants and renewable energy integration drive primary cooling tower fan demand, while growing chemical and pharmaceutical manufacturing support industrial cooling equipment procurement. Government infrastructure investment through Make in India programs, industrial corridor development incentives, and manufacturing sector growth initiatives support sustained expansion.
The convergence of industrial capacity growth, energy demand increases through coal-fired and gas-based power generation, and manufacturing sector modernization replacing aging equipment positions India as a key emerging market for cooling tower fans. Food and beverage processing facility expansion and pharmaceutical manufacturing growth accelerate equipment adoption, while environmental regulation enforcement drives replacement of inefficient legacy fans with modern VFD-enabled systems meeting energy efficiency requirements.
Performance Metrics:
The USA market emphasizes advanced cooling tower fan features, including precision VFD control and integration with comprehensive facility management platforms that manage energy optimization, predictive maintenance, and remote monitoring applications through unified building management systems. The country demonstrates strong growth at 3.8% CAGR driven by data center infrastructure buildout, EPA and DOE efficiency regulations enforcement, and utility and refinery equipment retrofits that support cooling system modernization. American industrial operators prioritize operational efficiency with cooling tower fans delivering reliable performance through advanced motor technology and comprehensive control system integration capabilities. Equipment deployment channels include industrial contractors, facility management companies, and equipment distributors that support professional installations for complex chemical processing and power generation applications.
Data center construction in major technology hubs including Northern Virginia, Silicon Valley, and Texas drives sustained demand for high-reliability cooling tower fan systems. Chemical processing facility upgrades and refinery cooling tower replacements create additional market opportunities for energy-efficient fan configurations.
Strategic Development Indicators:
The Chinese market emphasizes extensive cooling tower fan capacity with documented operational effectiveness in thermal power generation and chemical processing facilities through integration with domestic manufacturing capabilities and industrial infrastructure. The country leverages manufacturing expertise in fan production and motor technology to maintain substantial market presence at 3.7% CAGR. Industrial regions including Jiangsu, Shandong, Zhejiang, and Guangdong showcase large-scale installations where cooling tower fans integrate with comprehensive facility platforms and process control systems to optimize thermal management efficiency and operational reliability. Chinese industrial facilities prioritize high-capacity equipment and domestic manufacturing capabilities, creating demand for locally produced systems with competitive pricing that meet national industrial standards. The market benefits from government support for industrial efficiency through 14th Five-Year Plan provisions, manufacturing upgrade programs, and energy conservation initiatives that emphasize advanced equipment adoption.
State-owned enterprises drive substantial equipment procurement through centralized purchasing programs, while integrated industrial parks require comprehensive cooling systems. Environmental regulations promoting energy efficiency and emissions reduction create additional demand for VFD-enabled cooling tower fan installations.
Market Intelligence Brief:
Australia's advanced industrial market demonstrates sophisticated cooling tower fan deployment with documented operational effectiveness in mining process cooling, chemical manufacturing facilities, and power generation applications through integration with energy management systems and efficiency monitoring infrastructure. The country leverages engineering expertise in industrial technology and operational excellence to maintain steady equipment adoption patterns. Mining regions including Western Australia, Queensland, and New South Wales showcase premium installations where cooling tower fans integrate with comprehensive facility management platforms and remote monitoring systems to optimize energy consumption and equipment reliability. Australian industrial facilities prioritize operational efficiency, automation integration, and environmental compliance, creating demand for premium equipment with advanced features including VFD control, remote diagnostics capability, and predictive maintenance integration.
Mining operations requiring process cooling and power generation facilities drive sustained demand, while chemical manufacturing in industrial corridors requires specialized corrosion-resistant fan systems. Food processing operations in agricultural regions create emerging opportunities for sanitary-grade cooling tower fans.
Strategic Market Indicators:
Chile demonstrates consistent market presence through mining process cooling requirements, particularly in copper concentrator facilities and metallurgical operations requiring large-scale thermal management. Major mining companies operating in northern regions including Antofagasta, Atacama, and Coquimbo require specialized cooling tower fans for mineral processing water cooling and smelter auxiliary systems. State copper producer Codelco and private operators including BHP and Anglo American invest in industrial cooling infrastructure for concentrator plants, electrowinning facilities, and process water recirculation applications. Desert climate conditions and water scarcity drive adoption of efficient cooling tower systems with optimized fan performance for arid environment operations.
The expansion of copper mining capacity and lithium processing facilities requires significant investment in industrial cooling infrastructure capable of supporting high-altitude operations in water-constrained environments. Cooling tower modernization projects at established mining operations drive equipment replacement demand.
Performance Metrics:
Canada maintains steady expansion through diversified demand from oil sands processing, chemical manufacturing, food processing, and power generation operations across major provinces. Alberta oil sands facilities and petrochemical operations require specialized cooling tower fans for process heat rejection and facility thermal management. Ontario and Quebec chemical manufacturers and food processing operations require industrial cooling equipment supporting production facilities. British Columbia pulp and paper operations and emerging data center projects provide diversified market opportunities.
Industrial facility cooling requirements including refinery process cooling, chemical plant thermal management, and food processing applications drive specialized fan system demand. Mining operations in remote locations require robust cooling tower fan configurations for mineral processing facilities.
Market Characteristics:
The UK market emphasizes cooling tower fan applications in healthcare facility HVAC systems, commercial building district cooling, and data center thermal management that support infrastructure modernization programs. The country demonstrates steady growth at 3.4% CAGR driven by hospital and commercial HVAC refurbishments, data center cooling infrastructure expansion, and sustainability procurement regulations that support equipment upgrades. British facility operators prioritize energy efficiency with fan systems delivering optimized performance through advanced control features and comprehensive monitoring capabilities. Equipment deployment includes healthcare facility operators, commercial property managers, and technology companies that support cooling infrastructure for complex building systems and data center applications.
Healthcare facility cooling system upgrades in National Health Service hospitals and private medical centers drive sustained demand for reliable fan equipment. Data center construction in London and regional technology hubs creates additional market opportunities for high-efficiency cooling tower fans.
Performance Metrics:
South Africa's industrial market focuses on mining process cooling and power generation with system requirements for mineral processing facilities and coal-fired power plants. Mining operations in Gauteng, Limpopo, and North West provinces require cooling tower fan systems for concentrator facilities, metallurgical operations, and process water cooling. Power generation facilities operated by Eskom and independent power producers require large-scale cooling tower fans for thermal power plant applications. Mining companies including Anglo American, Sibanye-Stillwater, and Glencore operate facilities requiring comprehensive cooling infrastructure supporting underground operations and mineral processing.
Industrial cooling challenges and equipment reliability requirements drive investment in robust fan systems capable of continuous operation in demanding environmental conditions. Cooling tower modernization programs at aging power plants create sustained equipment replacement demand.
Performance Metrics:
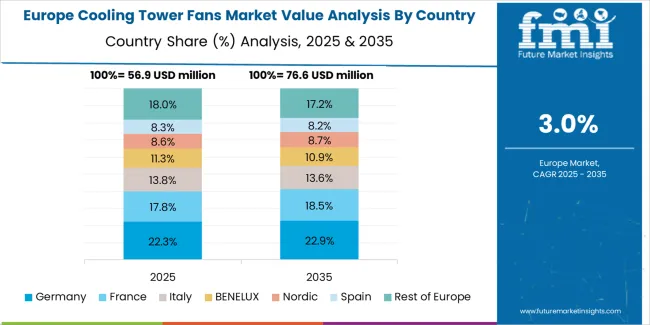
The cooling tower fans market in Europe is projected to grow from USD 60.1 million in 2025 to USD 85.3 million by 2035, registering a CAGR of approximately 3.5% over the forecast period. Germany is expected to maintain its leadership position with a 26.5% market share in 2025, declining slightly to 25.9% by 2035, supported by steady chemical and process industry upgrades and district cooling pilot programs across major industrial regions.
The United Kingdom follows with a 17.5% share in 2025, projected to edge up to 17.7% by 2035, as healthcare and commercial HVAC refurbishment programs offset cyclical industrial spending patterns. France holds a 16.8% share in 2025, expected to rise to 17.2% by 2035 through food processing facility investments and pharmaceutical manufacturing expansions. Italy commands a 12.5% share in 2025, increasing to 12.8% by 2035, supported by petrochemical and metallurgy cooling asset modernization programs. Spain accounts for 10.8% in 2025, reaching 11.1% by 2035, aided by tourism-linked commercial construction projects and renewable energy adjacent industrial park developments. The Rest of Europe region is anticipated to hold 16% in 2025, moderating to 15.3% by 2035, reflecting steady contributions from Nordic and Eastern European equipment replacement programs and EU-funded efficiency upgrade initiatives.
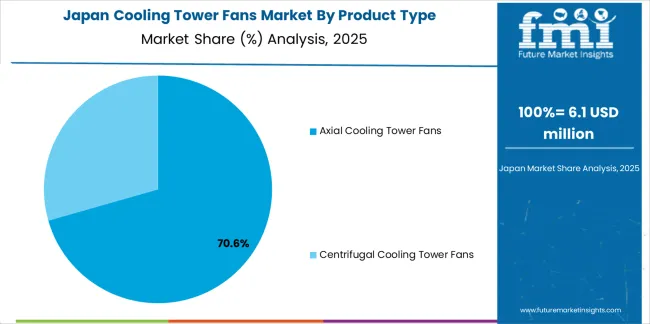
Japan demonstrates specialized market characteristics focused on semiconductor and electronics manufacturing precision cooling applications and advanced equipment quality preferences that emphasize operational reliability, low-noise performance, and comprehensive monitoring systems. The Japanese market focuses on high-specification industrial applications including semiconductor fabrication facility cooling, electronics manufacturing climate control, and specialized systems for cleanroom environments requiring premium equipment specifications that reflect the country's renowned manufacturing excellence standards. Cooling tower fan procurement emphasizes technological sophistication, integration with comprehensive facility management systems, and long-term reliability requirements that align with Japanese industrial quality expectations.
Market Development Factors:
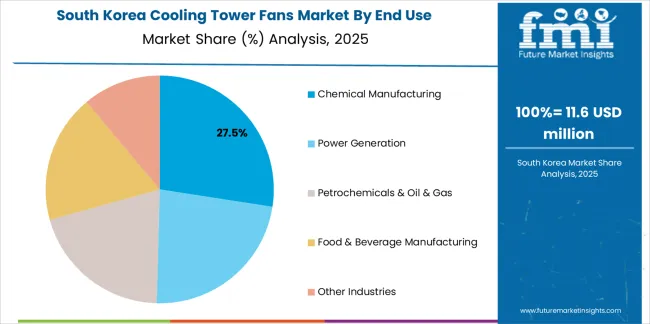
South Korea demonstrates advanced market characteristics focused on semiconductor manufacturing expansion, battery production facility cooling, and hyperscale data center thermal management with sophisticated control systems and comprehensive automation features. The Korean market emphasizes electronics manufacturing precision cooling, semiconductor fabrication facility applications, and smart factory installations requiring high-specification cooling tower fans with advanced monitoring capabilities and energy optimization features. Korean industrial facilities and technology companies prioritize automation integration, predictive maintenance programs, and digital transformation initiatives that reflect the country's leadership in industrial technology adoption and smart manufacturing systems. The market benefits from government support for industrial facility modernization, energy efficiency programs, and technology development initiatives supporting equipment upgrades and operational optimization improvements.
Strategic Development Indicators:
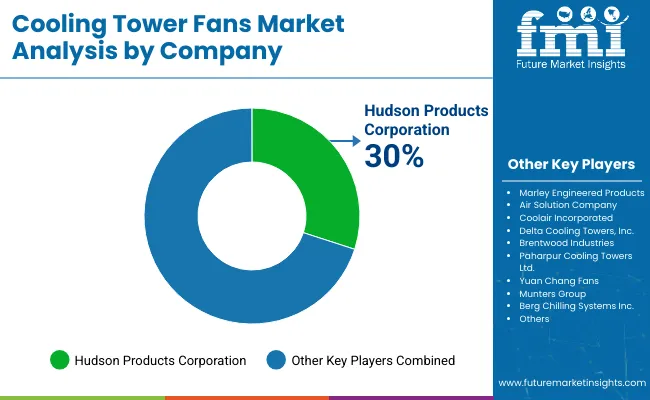
The Cooling Tower Fans market operates with moderate concentration, featuring approximately 40-50 meaningful participants, where leading companies control roughly 35-40% of the global market share through established industrial relationships and comprehensive product portfolios. Competition emphasizes energy efficiency capabilities, reliability performance, and technical support quality rather than price-based rivalry. Tier 1 companies including SPX Cooling Technologies, Baltimore Aircoil Company, and EVAPCO collectively command approximately 28-32% market share through their comprehensive cooling tower fan product lines and extensive global industrial presence.
Market Leaders encompass SPX Cooling Technologies (Marley brand), Baltimore Aircoil Company, and EVAPCO, which maintain competitive advantages through extensive cooling tower expertise, global service networks, and comprehensive system integration capabilities that create customer switching costs and support premium positioning. SPX Cooling Technologies alone holds approximately 14% market share through its Marley fan technology leadership and industrial cooling relationships.
Technology Innovators include Howden (Chart Industries), Ebara Corporation, and Munters Group, which compete through focused motor efficiency development and innovative control interfaces that appeal to industrial facilities seeking advanced energy optimization capabilities. Regional Specialists feature companies with specific geographic market presence and specialized applications, including corrosion-resistant fan systems and integrated monitoring solutions.
Recent market developments include Baltimore Aircoil Company showcasing EC fan system innovations with plug-and-play controls at major 2024 industry events, EVAPCO releasing updated closed-circuit cooler models featuring reduced fan motor power requirements and VFD-ready configurations, and SPX Cooling Technologies expanding its Marley axial fan portfolio with low-sound and high-efficiency models plus new adiabatic series options for retrofit tower applications.
| Item | Value |
|---|---|
| Quantitative Units | USD 222.7 Million |
| Product Type | Axial Cooling Tower Fans, Centrifugal Cooling Tower Fans |
| End Use | Chemical Manufacturing, Power Generation, Petrochemicals & Oil & Gas, Food & Beverage Manufacturing, Other Industries |
| Regions Covered | Asia Pacific, North America, Europe, Middle East & Africa, Latin America |
| Countries Covered | United States, China, India, Germany, United Kingdom, Japan, South Korea, and 25+ additional countries |
| Key Companies Profiled | SPX Cooling Technologies (Marley), Baltimore Aircoil Company, EVAPCO, Inc., Howden (Chart Industries), Ebara Corporation, Munters Group, Delta Cooling Towers, Inc., Paharpur Cooling Towers Ltd., Brentwood Industries, Hudson Products Corporation |
| Additional Attributes | Dollar sales by product type and end-use industry categories, regional adoption trends across Asia Pacific, North America, and Europe, competitive landscape with cooling equipment manufacturers and industrial technology suppliers, facility operator preferences for energy efficiency and operational reliability, integration with facility management platforms and automated control systems, innovations in VFD configurations and electronically commutated motor capabilities, and development of low-noise solutions with enhanced performance and energy optimization capabilities. |
The global cooling tower fans market is estimated to be valued at USD 222.7 million in 2025.
The market size for the cooling tower fans market is projected to reach USD 317.2 million by 2035.
The cooling tower fans market is expected to grow at a 3.6% CAGR between 2025 and 2035.
The key product types in cooling tower fans market are axial cooling tower fans and centrifugal cooling tower fans.
In terms of end use, chemical manufacturing segment to command 27.0% share in the cooling tower fans market in 2025.


Full Research Suite comprises of:
Market outlook & trends analysis
Interviews & case studies
Strategic recommendations
Vendor profiles & capabilities analysis
5-year forecasts
8 regions and 60+ country-level data splits
Market segment data splits
12 months of continuous data updates
DELIVERED AS:
PDF EXCEL ONLINE
Cooling Skincare Gels Market Size and Share Forecast Outlook 2025 to 2035
Cooling Laser Power Measurement Sphere Market Size and Share Forecast Outlook 2025 to 2035
Cooling Agents Market Size and Share Forecast Outlook 2025 to 2035
Cooling Pump Market Size and Share Forecast Outlook 2025 to 2035
Cooling Essences Market Size and Share Forecast Outlook 2025 to 2035
Cooling Boxes Market Size and Share Forecast Outlook 2025 to 2035
Cooling Management System Market - Growth & Demand 2025 to 2035
Cooling Water Treatment Chemicals Market Growth - Trends & Forecast 2025 to 2035
Cooling and Heating as a Service Market Growth – Trends & Forecast 2025-2035
Cooling Fans Market Growth - Trends & Forecast 2025 to 2035
Cooling Tower Market Size and Share Forecast Outlook 2025 to 2035
Cooling Tower Rental Market Size, Growth, and Forecast 2025 to 2035
Gas Cooling System Market Analysis - Size, Share, and Forecast Outlook 2025 to 2035
Self Cooling Packaging Market Size and Share Forecast Outlook 2025 to 2035
Green Cooling Technologies Market
Vacuum Cooling Equipment Market Analysis - Size, Share, and Forecast Outlook for 2025 to 2035
Aircraft Cooling Turbines Market Size and Share Forecast Outlook 2025 to 2035
Combined Cooling Heat and Power Plant Market Analysis - Size, Share, and Forecast Outlook 2025 to 2035
District Cooling Market - Growth & Demand 2025 to 2035
Seawater Cooling Pumps Market

Thank you!
You will receive an email from our Business Development Manager. Please be sure to check your SPAM/JUNK folder too.
Chat With
MaRIA