Content Creation Market Outlook (2023 to 2033)

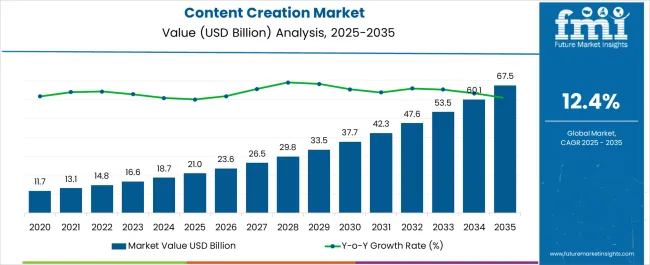
The content creation market is anticipated to record a CAGR of 12.4% during the forecast period from 2023 to 2033. The market is expected to be valued at US$ 1,66,11.5 million in 2023 and is likely to reach US$ 5,36,23.3 million by 2033.

The content creation market adoption trends are on a high trajectory owing to the benefits associated with it, including precise targeting, cheap operating costs, ease of measurement and adjustment, high return on investment (ROI), brand extension, and a focus on conducting business and segmentation.

The process of producing ideas and obtaining information from any media in certain contexts is known as content creation. Further, Audio or video files, animations, text, photographs, and graphics are all content creation examples. It also allows the company to communicate with its traffic audience, which helps to build brand scalability, thereby propelling the demand for content creation.

The primary forces driving the global content creation market growth are an increase in IT expenditure, the introduction of cloud computing, and the acceptance of AI. A few other projected drivers of the global market include decreased data storage costs and the expansion of e-commerce business platforms.

The decreasing content creation pricing, growing smartphone and tablet user bases, rising internet penetration, and great usage of digital marketing tools are likely to impact the market positively. Further, to attract potential clients, players are focusing on developing and implementing digital strategies, enabling the expansion of market share.

Content creation tools and services are critical in content generation to satisfy the needs of organizations. Moreover, the creation of relevant material, such as blog posts, case studies, white papers, e-newsletters, and so on, aids in the targeting of the proper audience, fueling the adoption of content creation. On account of the rising online traffic and proliferation of internet services, content development has become a vital instrument for B2B communication.

Personalization marketing, voice search, and AI content creation are transforming the market in the hospitality industry. As a result, the hospitality industry is predicted to be the third-largest income generator in the content creation business, and it is significantly adopting digital technologies.

Hospitality marketers are concentrating their efforts on email marketing to generate leads and raise awareness within their target demographic. Further, targeted emails help stakeholders establish a personal relationship with customers, which leads to many visits.

Content creation agencies are focused on developing digital marketing strategies and using content development tools and services to take advantage of the growing internet traffic. Also, the market has moved forward in recent years as a result of the same.

Attributes Details
Content Creation Market CAGR (2023 to 2033) 12.4%
Content Creation Market Value (2023) US$ 1,66,11.5 million
Content Creation Market Value (2033) US$ 5,36,23.3 million

Don't pay for what you don't need

Customize your report by selecting specific countries or regions and save 30%!

What are the key Content Creation Market Dynamics?

Authoring, publishing digital material, and distributing are made easier with content production software, which is driving the demand for content creation from around the globe. The widespread usage of social media platforms such as Instagram, Twitter, Facebook, and LinkedIn, among others, is opening up a wide variety of content creation market opportunities.

The lack of open-source software, on the other hand, is a major impediment to the expansion of the market size. Furthermore, the content creation market trends are predicted to advance due to rising digitization, increased use of social media marketing, and increased availability of high-speed internet connectivity.

The growing importance of client involvement and appropriate advertising through the Internet is likely to fuel the content development business. As a result, the global market for content development is augmenting. Furthermore, the expansion of the content creation market size is aided by businesses' increased marketing budgets.

On account of the constantly rising demand for social media marketing, the worldwide market is expected to move forward significantly during the projected period. Implementing content creation tools is helping businesses increase revenue and promote their brands as well as augment their contention creation market share.

In addition, the adoption of content creation is on the surge owing to the usage of content development technologies in the education sector. However, the widespread availability of free content production tools is limiting the usage of content creation tools on a big scale.

In light of numerous privacy concerns, certain governments have enacted rules governing the distribution of content. As a result, the use of content technologies is restricted in many countries, impeding the overall content creation market outlook.

The rising implementation of SaaS or cloud models is a significant factor driving market growth. Due to its cost-effectiveness, immense computing capacity, and flexibility, the technology is gaining a large customer base. Furthermore, as content creation processes evolve, so do the ways in which content creation technologies are used, and the same is likely to augur well for market future trends.

How is the Content Creation Market Categorized?

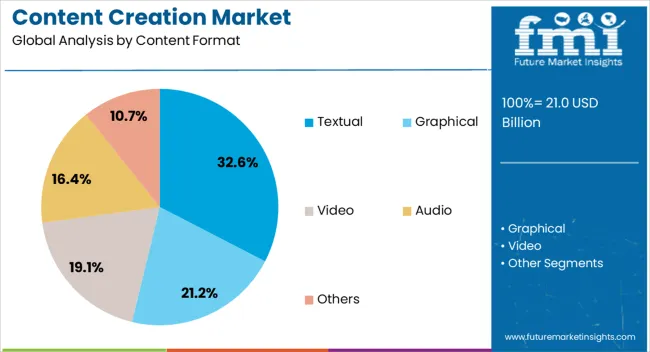
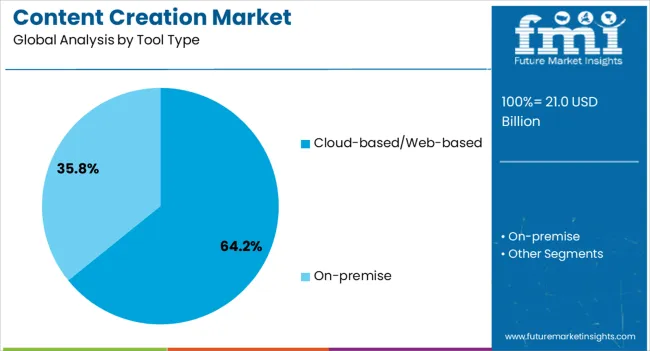
Based on the content format, the market is segmented into textual, graphical, video, audio, and others. The market, based on tool type, is categorized into cloud-based content creation tools and on-premise content creation tools. The cloud-based segment is likely to hold 72.4% of the content creation market share.

Cloud is being democratized for companies and individuals, allowing everyone to participate in the digital economy. As producers find it simple to communicate tales cooperatively, the cloud has grown capable of handling workloads in the media and entertainment business. As a result, the revenue of the cloud is likely to rise at an exponential rate in the content creation market, which is expected to develop at an exponential rate.

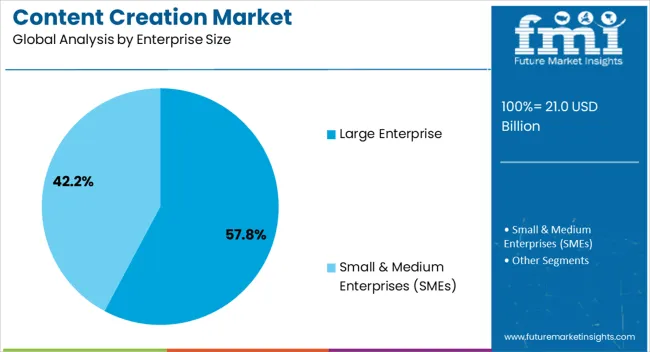
Based on enterprise size, the market is segmented into large enterprises and small & medium enterprises (SMEs), where the large enterprises segment is expected to dominate the market with a market share of 77.2%.

In terms of the end-use industry, the market is categorized into IT & telecom, travel & hospitality, retail, education, healthcare, media & entertainment, and others. The IT & telecom segment is anticipated to be at the forefront of the market, with a content creation market share of 38.4% through 2032.

Sudip Saha
Sudip Saha

Principal Consultant

Talk to Analyst

Find your sweet spots for generating winning opportunities in this market.

What is the Regional Analysis for the Content Creation Market?

Regions CAGR (2023 to 2033)
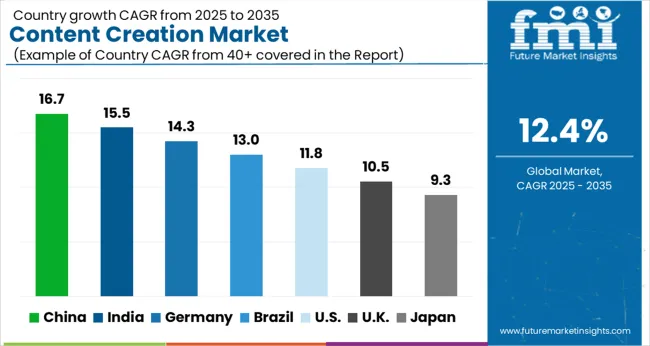
The United States 18.5%
The United Kingdom 9.3%
China Market 12.6%
Japan Market 5.3%
India Market 16.5%

The United States is likely to account for a significant share on account of the widespread adoption of content creation tools across a variety of industry verticals and the presence of leading tool developers in the region.

The content creation market in the United States is expected to increase significantly during the forecast period with a CAGR of 11.9%. Due to the increased usage of content creation tools and services across emerging countries, China and Japan markets are predicted to be the significantly expanding region throughout the projection period.

The United Kingdom is likely to have a significant presence in this market, advancing at a 10.7% growth rate.

China is expected to rise due to an increase in the number of small and medium businesses across leading nations and increased adoption of marketing methods during the forecast period. In addition, the United Kingdom is also likely to have a significant presence in this market, advancing at a 10.7% growth rate.

The United States is likely to account for a significant share. The market in the United States is anticipated to expand significantly during the forecast period with a CAGR of 11.9%, on account of the widespread adoption of content creation tools across a variety of industry verticals and the presence of leading tool developers in the region.

China and Japan markets are predicted to significantly expanding markets throughout the projection period due to the increased usage of content creation tools and services across emerging countries. During the forecast period, the market in China is expected to rise due to an increase in product approvals, product launches, and other organic growth strategies such as patents and events are being prioritized by several companies.
Competitive Landscape

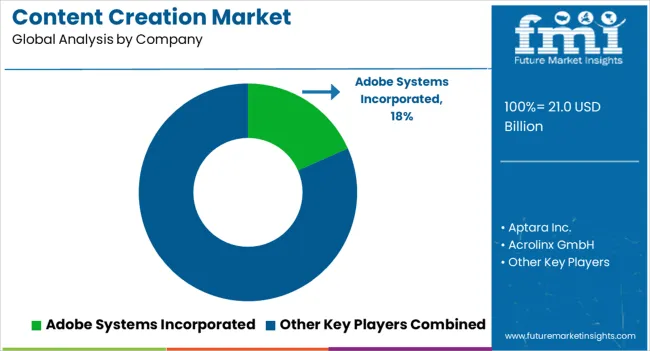
Acquisitions, as well as partnerships and collaborations, were seen as inorganic growth tactics in the market. These initiatives have paved the road for market players to expand their business and client base and are bringing about emerging trends in the content creation market. Also, with the increased demand for filter products in the worldwide industry, market players are expected to benefit from significant growth prospects in the future.

Recent developments

  • Magisto's Emotion Sense Technology (EST) is an AI-based processing system that allows users to turn their photo and video collections into high-quality films with Hollywood-style suspense.
  • By providing scalability, flexibility, vast processing capacity, and cost-effectiveness, EST aids in the improvement of content audits.
  • Acrolinx GmbH, a provider of AI software for enterprise digital content development, has announced the majority acquisition of Gesnui GmbH, which is likely to help the worldwide market expand even further.
  • Acrolinx GmbH's artificial intelligence software platform employs a unique linguistic mechanism to read information and provide rapid instruction, as well as a sophisticated algorithm to improve its effectiveness. The number of small and medium businesses across major nations and increased adoption of marketing methods.
  • Adobe introduced their customized Substance 3D solutions for the fashion and retail sectors in January 2023 and revealed new clients like Louis Vuitton, Burberry, and Amazon.

Get the data you need at a Fraction of the cost

Personalize your report by choosing insights you need
and save 40%!

Key Players Profiled in the Market

  • Adobe Systems Incorporated
  • Aptara Inc.
  • Acrolinx GmbH
  • Apple, Inc.
  • Corel Corporation
  • Integra Software Services Pvt. Ltd.
  • MarketMuse, Inc.
  • Microsoft Corporation
  • Quark Software, Inc.
  • Trivantis

Key Segmentation

By Content Format:

  • Textual
  • Graphical
  • Video
  • Audio
  • Others

By Tool Type:

  • Cloud-based/Web-based
  • On-premise

By Enterprise Size:

  • Large Enterprise
  • Small & Medium Enterprises (SMEs)

By End-use Industry:

  • IT & Telecom
  • Travel & Hospitality
  • Retail
  • Education
  • Healthcare
  • Media & Entertainment
  • Others

By Region:

  • North America
  • Latin America
  • Asia Pacific
  • The Middle East and Africa
  • Europe

Frequently Asked Questions

Why the Market in the United States is Witnessing Higher Growth?

Growing industry vertical is fueling the demand in the United States.

How the Market is Performing in Europe?

The market in India is likely to secure a growth of 16.5% through 2033.

What is Driving the Adoption of Content Creation Globally?

Promoting brands and advertising has necessitated smart water bottles.

What is the Contribution of the United States in the Global Market Growth?

The United States hold a CAGR of 18.5% of the global market in 2023.

Which Region Presents Lucrative Growth Opportunities?

North America to witness a lucrative growth opportunities through 2033.

Table of Content

1. Executive Summary

    1.1. Global Market Outlook

    1.2. Demand-side Trends

    1.3. Supply-side Trends

    1.4. Technology Roadmap Analysis

    1.5. Analysis and Recommendations

2. Market Overview

    2.1. Market Coverage / Taxonomy

    2.2. Market Definition / Scope / Limitations

3. Market Background

    3.1. Market Dynamics

        3.1.1. Drivers

        3.1.2. Restraints

        3.1.3. Opportunity

        3.1.4. Trends

    3.2. Scenario Forecast

        3.2.1. Demand in Optimistic Scenario

        3.2.2. Demand in Likely Scenario

        3.2.3. Demand in Conservative Scenario

    3.3. Opportunity Map Analysis

    3.4. Investment Feasibility Matrix

    3.5. PESTLE and Porter’s Analysis

    3.6. Regulatory Landscape

        3.6.1. By Key Regions

        3.6.2. By Key Countries

    3.7. Regional Parent Market Outlook

4. Global Market Analysis 2018 to 2022 and Forecast, 2023 to 2033

    4.1. Historical Market Size Value (US$ Million) Analysis, 2018 to 2022

    4.2. Current and Future Market Size Value (US$ Million) Projections, 2023 to 2033

        4.2.1. Y-o-Y Growth Trend Analysis

        4.2.2. Absolute $ Opportunity Analysis

5. Global Market Analysis 2018 to 2022 and Forecast 2023 to 2033, By Content Format

    5.1. Introduction / Key Findings

    5.2. Historical Market Size Value (US$ Million) Analysis By Content Format, 2018 to 2022

    5.3. Current and Future Market Size Value (US$ Million) Analysis and Forecast By Content Format, 2023 to 2033

        5.3.1. Textual

        5.3.2. Graphical

        5.3.3. Video

        5.3.4. Audio

        5.3.5. Others

    5.4. Y-o-Y Growth Trend Analysis By Content Format, 2018 to 2022

    5.5. Absolute $ Opportunity Analysis By Content Format, 2023 to 2033

6. Global Market Analysis 2018 to 2022 and Forecast 2023 to 2033, By Tool Type

    6.1. Introduction / Key Findings

    6.2. Historical Market Size Value (US$ Million) Analysis By Tool Type, 2018 to 2022

    6.3. Current and Future Market Size Value (US$ Million) Analysis and Forecast By Tool Type, 2023 to 2033

        6.3.1. Cloud-based/Web-based Tools

        6.3.2. On-premise Tool

    6.4. Y-o-Y Growth Trend Analysis By Tool Type, 2018 to 2022

    6.5. Absolute $ Opportunity Analysis By Tool Type, 2023 to 2033

7. Global Market Analysis 2018 to 2022 and Forecast 2023 to 2033, By Enterprise Size

    7.1. Introduction / Key Findings

    7.2. Historical Market Size Value (US$ Million) Analysis By Enterprise Size, 2018 to 2022

    7.3. Current and Future Market Size Value (US$ Million) Analysis and Forecast By Enterprise Size, 2023 to 2033

        7.3.1. Large Enterprise

        7.3.2. Small & Medium Enterprises (SMEs)

    7.4. Y-o-Y Growth Trend Analysis By Enterprise Size, 2018 to 2022

    7.5. Absolute $ Opportunity Analysis By Enterprise Size, 2023 to 2033

8. Global Market Analysis 2018 to 2022 and Forecast 2023 to 2033, By End-use Industry

    8.1. Introduction / Key Findings

    8.2. Historical Market Size Value (US$ Million) Analysis By End-use Industry, 2018 to 2022

    8.3. Current and Future Market Size Value (US$ Million) Analysis and Forecast By End-use Industry, 2023 to 2033

        8.3.1. IT & Telecom

        8.3.2. Travel & Hospitality

        8.3.3. Retail

        8.3.4. Education

        8.3.5. Healthcare

        8.3.6. Media & Entertainment

        8.3.7. Others

    8.4. Y-o-Y Growth Trend Analysis By End-use Industry, 2018 to 2022

    8.5. Absolute $ Opportunity Analysis By End-use Industry, 2023 to 2033

9. Global Market Analysis 2018 to 2022 and Forecast 2023 to 2033, By Region

    9.1. Introduction

    9.2. Historical Market Size Value (US$ Million) Analysis By Region, 2018 to 2022

    9.3. Current Market Size Value (US$ Million) Analysis and Forecast By Region, 2023 to 2033

        9.3.1. North America

        9.3.2. Latin America

        9.3.3. Western Europe

        9.3.4. Eastern Europe

        9.3.5. South Asia and Pacific

        9.3.6. East Asia

        9.3.7. Middle East and Africa

    9.4. Market Attractiveness Analysis By Region

10. North America Market Analysis 2018 to 2022 and Forecast 2023 to 2033, By Country

    10.1. Historical Market Size Value (US$ Million) Trend Analysis By Market Taxonomy, 2018 to 2022

    10.2. Market Size Value (US$ Million) Forecast By Market Taxonomy, 2023 to 2033

        10.2.1. By Country

            10.2.1.1. USA

            10.2.1.2. Canada

        10.2.2. By Content Format

        10.2.3. By Tool Type

        10.2.4. By Enterprise Size

        10.2.5. By End-use Industry

    10.3. Market Attractiveness Analysis

        10.3.1. By Country

        10.3.2. By Content Format

        10.3.3. By Tool Type

        10.3.4. By Enterprise Size

        10.3.5. By End-use Industry

    10.4. Key Takeaways

11. Latin America Market Analysis 2018 to 2022 and Forecast 2023 to 2033, By Country

    11.1. Historical Market Size Value (US$ Million) Trend Analysis By Market Taxonomy, 2018 to 2022

    11.2. Market Size Value (US$ Million) Forecast By Market Taxonomy, 2023 to 2033

        11.2.1. By Country

            11.2.1.1. Brazil

            11.2.1.2. Mexico

            11.2.1.3. Rest of Latin America

        11.2.2. By Content Format

        11.2.3. By Tool Type

        11.2.4. By Enterprise Size

        11.2.5. By End-use Industry

    11.3. Market Attractiveness Analysis

        11.3.1. By Country

        11.3.2. By Content Format

        11.3.3. By Tool Type

        11.3.4. By Enterprise Size

        11.3.5. By End-use Industry

    11.4. Key Takeaways

12. Western Europe Market Analysis 2018 to 2022 and Forecast 2023 to 2033, By Country

    12.1. Historical Market Size Value (US$ Million) Trend Analysis By Market Taxonomy, 2018 to 2022

    12.2. Market Size Value (US$ Million) Forecast By Market Taxonomy, 2023 to 2033

        12.2.1. By Country

            12.2.1.1. Germany

            12.2.1.2. UK

            12.2.1.3. France

            12.2.1.4. Spain

            12.2.1.5. Italy

            12.2.1.6. Rest of Western Europe

        12.2.2. By Content Format

        12.2.3. By Tool Type

        12.2.4. By Enterprise Size

        12.2.5. By End-use Industry

    12.3. Market Attractiveness Analysis

        12.3.1. By Country

        12.3.2. By Content Format

        12.3.3. By Tool Type

        12.3.4. By Enterprise Size

        12.3.5. By End-use Industry

    12.4. Key Takeaways

13. Eastern Europe Market Analysis 2018 to 2022 and Forecast 2023 to 2033, By Country

    13.1. Historical Market Size Value (US$ Million) Trend Analysis By Market Taxonomy, 2018 to 2022

    13.2. Market Size Value (US$ Million) Forecast By Market Taxonomy, 2023 to 2033

        13.2.1. By Country

            13.2.1.1. Poland

            13.2.1.2. Russia

            13.2.1.3. Czech Republic

            13.2.1.4. Romania

            13.2.1.5. Rest of Eastern Europe

        13.2.2. By Content Format

        13.2.3. By Tool Type

        13.2.4. By Enterprise Size

        13.2.5. By End-use Industry

    13.3. Market Attractiveness Analysis

        13.3.1. By Country

        13.3.2. By Content Format

        13.3.3. By Tool Type

        13.3.4. By Enterprise Size

        13.3.5. By End-use Industry

    13.4. Key Takeaways

14. South Asia and Pacific Market Analysis 2018 to 2022 and Forecast 2023 to 2033, By Country

    14.1. Historical Market Size Value (US$ Million) Trend Analysis By Market Taxonomy, 2018 to 2022

    14.2. Market Size Value (US$ Million) Forecast By Market Taxonomy, 2023 to 2033

        14.2.1. By Country

            14.2.1.1. India

            14.2.1.2. Bangladesh

            14.2.1.3. Australia

            14.2.1.4. New Zealand

            14.2.1.5. Rest of South Asia and Pacific

        14.2.2. By Content Format

        14.2.3. By Tool Type

        14.2.4. By Enterprise Size

        14.2.5. By End-use Industry

    14.3. Market Attractiveness Analysis

        14.3.1. By Country

        14.3.2. By Content Format

        14.3.3. By Tool Type

        14.3.4. By Enterprise Size

        14.3.5. By End-use Industry

    14.4. Key Takeaways

15. East Asia Market Analysis 2018 to 2022 and Forecast 2023 to 2033, By Country

    15.1. Historical Market Size Value (US$ Million) Trend Analysis By Market Taxonomy, 2018 to 2022

    15.2. Market Size Value (US$ Million) Forecast By Market Taxonomy, 2023 to 2033

        15.2.1. By Country

            15.2.1.1. China

            15.2.1.2. Japan

            15.2.1.3. South Korea

        15.2.2. By Content Format

        15.2.3. By Tool Type

        15.2.4. By Enterprise Size

        15.2.5. By End-use Industry

    15.3. Market Attractiveness Analysis

        15.3.1. By Country

        15.3.2. By Content Format

        15.3.3. By Tool Type

        15.3.4. By Enterprise Size

        15.3.5. By End-use Industry

    15.4. Key Takeaways

16. Middle East and Africa Market Analysis 2018 to 2022 and Forecast 2023 to 2033, By Country

    16.1. Historical Market Size Value (US$ Million) Trend Analysis By Market Taxonomy, 2018 to 2022

    16.2. Market Size Value (US$ Million) Forecast By Market Taxonomy, 2023 to 2033

        16.2.1. By Country

            16.2.1.1. GCC Countries

            16.2.1.2. South Africa

            16.2.1.3. Israel

            16.2.1.4. Rest of MEA

        16.2.2. By Content Format

        16.2.3. By Tool Type

        16.2.4. By Enterprise Size

        16.2.5. By End-use Industry

    16.3. Market Attractiveness Analysis

        16.3.1. By Country

        16.3.2. By Content Format

        16.3.3. By Tool Type

        16.3.4. By Enterprise Size

        16.3.5. By End-use Industry

    16.4. Key Takeaways

17. Key Countries Market Analysis

    17.1. USA

        17.1.1. Pricing Analysis

        17.1.2. Market Share Analysis, 2022

            17.1.2.1. By Content Format

            17.1.2.2. By Tool Type

            17.1.2.3. By Enterprise Size

            17.1.2.4. By End-use Industry

    17.2. Canada

        17.2.1. Pricing Analysis

        17.2.2. Market Share Analysis, 2022

            17.2.2.1. By Content Format

            17.2.2.2. By Tool Type

            17.2.2.3. By Enterprise Size

            17.2.2.4. By End-use Industry

    17.3. Brazil

        17.3.1. Pricing Analysis

        17.3.2. Market Share Analysis, 2022

            17.3.2.1. By Content Format

            17.3.2.2. By Tool Type

            17.3.2.3. By Enterprise Size

            17.3.2.4. By End-use Industry

    17.4. Mexico

        17.4.1. Pricing Analysis

        17.4.2. Market Share Analysis, 2022

            17.4.2.1. By Content Format

            17.4.2.2. By Tool Type

            17.4.2.3. By Enterprise Size

            17.4.2.4. By End-use Industry

    17.5. Germany

        17.5.1. Pricing Analysis

        17.5.2. Market Share Analysis, 2022

            17.5.2.1. By Content Format

            17.5.2.2. By Tool Type

            17.5.2.3. By Enterprise Size

            17.5.2.4. By End-use Industry

    17.6. UK

        17.6.1. Pricing Analysis

        17.6.2. Market Share Analysis, 2022

            17.6.2.1. By Content Format

            17.6.2.2. By Tool Type

            17.6.2.3. By Enterprise Size

            17.6.2.4. By End-use Industry

    17.7. France

        17.7.1. Pricing Analysis

        17.7.2. Market Share Analysis, 2022

            17.7.2.1. By Content Format

            17.7.2.2. By Tool Type

            17.7.2.3. By Enterprise Size

            17.7.2.4. By End-use Industry

    17.8. Spain

        17.8.1. Pricing Analysis

        17.8.2. Market Share Analysis, 2022

            17.8.2.1. By Content Format

            17.8.2.2. By Tool Type

            17.8.2.3. By Enterprise Size

            17.8.2.4. By End-use Industry

    17.9. Italy

        17.9.1. Pricing Analysis

        17.9.2. Market Share Analysis, 2022

            17.9.2.1. By Content Format

            17.9.2.2. By Tool Type

            17.9.2.3. By Enterprise Size

            17.9.2.4. By End-use Industry

    17.10. Poland

        17.10.1. Pricing Analysis

        17.10.2. Market Share Analysis, 2022

            17.10.2.1. By Content Format

            17.10.2.2. By Tool Type

            17.10.2.3. By Enterprise Size

            17.10.2.4. By End-use Industry

    17.11. Russia

        17.11.1. Pricing Analysis

        17.11.2. Market Share Analysis, 2022

            17.11.2.1. By Content Format

            17.11.2.2. By Tool Type

            17.11.2.3. By Enterprise Size

            17.11.2.4. By End-use Industry

    17.12. Czech Republic

        17.12.1. Pricing Analysis

        17.12.2. Market Share Analysis, 2022

            17.12.2.1. By Content Format

            17.12.2.2. By Tool Type

            17.12.2.3. By Enterprise Size

            17.12.2.4. By End-use Industry

    17.13. Romania

        17.13.1. Pricing Analysis

        17.13.2. Market Share Analysis, 2022

            17.13.2.1. By Content Format

            17.13.2.2. By Tool Type

            17.13.2.3. By Enterprise Size

            17.13.2.4. By End-use Industry

    17.14. India

        17.14.1. Pricing Analysis

        17.14.2. Market Share Analysis, 2022

            17.14.2.1. By Content Format

            17.14.2.2. By Tool Type

            17.14.2.3. By Enterprise Size

            17.14.2.4. By End-use Industry

    17.15. Bangladesh

        17.15.1. Pricing Analysis

        17.15.2. Market Share Analysis, 2022

            17.15.2.1. By Content Format

            17.15.2.2. By Tool Type

            17.15.2.3. By Enterprise Size

            17.15.2.4. By End-use Industry

    17.16. Australia

        17.16.1. Pricing Analysis

        17.16.2. Market Share Analysis, 2022

            17.16.2.1. By Content Format

            17.16.2.2. By Tool Type

            17.16.2.3. By Enterprise Size

            17.16.2.4. By End-use Industry

    17.17. New Zealand

        17.17.1. Pricing Analysis

        17.17.2. Market Share Analysis, 2022

            17.17.2.1. By Content Format

            17.17.2.2. By Tool Type

            17.17.2.3. By Enterprise Size

            17.17.2.4. By End-use Industry

    17.18. China

        17.18.1. Pricing Analysis

        17.18.2. Market Share Analysis, 2022

            17.18.2.1. By Content Format

            17.18.2.2. By Tool Type

            17.18.2.3. By Enterprise Size

            17.18.2.4. By End-use Industry

    17.19. Japan

        17.19.1. Pricing Analysis

        17.19.2. Market Share Analysis, 2022

            17.19.2.1. By Content Format

            17.19.2.2. By Tool Type

            17.19.2.3. By Enterprise Size

            17.19.2.4. By End-use Industry

    17.20. South Korea

        17.20.1. Pricing Analysis

        17.20.2. Market Share Analysis, 2022

            17.20.2.1. By Content Format

            17.20.2.2. By Tool Type

            17.20.2.3. By Enterprise Size

            17.20.2.4. By End-use Industry

    17.21. GCC Countries

        17.21.1. Pricing Analysis

        17.21.2. Market Share Analysis, 2022

            17.21.2.1. By Content Format

            17.21.2.2. By Tool Type

            17.21.2.3. By Enterprise Size

            17.21.2.4. By End-use Industry

    17.22. South Africa

        17.22.1. Pricing Analysis

        17.22.2. Market Share Analysis, 2022

            17.22.2.1. By Content Format

            17.22.2.2. By Tool Type

            17.22.2.3. By Enterprise Size

            17.22.2.4. By End-use Industry

    17.23. Israel

        17.23.1. Pricing Analysis

        17.23.2. Market Share Analysis, 2022

            17.23.2.1. By Content Format

            17.23.2.2. By Tool Type

            17.23.2.3. By Enterprise Size

            17.23.2.4. By End-use Industry

18. Market Structure Analysis

    18.1. Competition Dashboard

    18.2. Competition Benchmarking

    18.3. Market Share Analysis of Top Players

        18.3.1. By Regional

        18.3.2. By Content Format

        18.3.3. By Tool Type

        18.3.4. By Enterprise Size

        18.3.5. By End-use Industry

19. Competition Analysis

    19.1. Competition Deep Dive

        19.1.1. Adobe Systems Incorporated

            19.1.1.1. Overview

            19.1.1.2. Product Portfolio

            19.1.1.3. Profitability by Market Segments

            19.1.1.4. Sales Footprint

            19.1.1.5. Strategy Overview

                19.1.1.5.1. Marketing Strategy

        19.1.2. Aptara Inc.

            19.1.2.1. Overview

            19.1.2.2. Product Portfolio

            19.1.2.3. Profitability by Market Segments

            19.1.2.4. Sales Footprint

            19.1.2.5. Strategy Overview

                19.1.2.5.1. Marketing Strategy

        19.1.3. Acrolinx GmbH

            19.1.3.1. Overview

            19.1.3.2. Product Portfolio

            19.1.3.3. Profitability by Market Segments

            19.1.3.4. Sales Footprint

            19.1.3.5. Strategy Overview

                19.1.3.5.1. Marketing Strategy

        19.1.4. Apple, Inc.

            19.1.4.1. Overview

            19.1.4.2. Product Portfolio

            19.1.4.3. Profitability by Market Segments

            19.1.4.4. Sales Footprint

            19.1.4.5. Strategy Overview

                19.1.4.5.1. Marketing Strategy

        19.1.5. Corel Corporation

            19.1.5.1. Overview

            19.1.5.2. Product Portfolio

            19.1.5.3. Profitability by Market Segments

            19.1.5.4. Sales Footprint

            19.1.5.5. Strategy Overview

                19.1.5.5.1. Marketing Strategy

        19.1.6. Integra Software Services Pvt. Ltd.

            19.1.6.1. Overview

            19.1.6.2. Product Portfolio

            19.1.6.3. Profitability by Market Segments

            19.1.6.4. Sales Footprint

            19.1.6.5. Strategy Overview

                19.1.6.5.1. Marketing Strategy

        19.1.7. MarketMuse, Inc.

            19.1.7.1. Overview

            19.1.7.2. Product Portfolio

            19.1.7.3. Profitability by Market Segments

            19.1.7.4. Sales Footprint

            19.1.7.5. Strategy Overview

                19.1.7.5.1. Marketing Strategy

        19.1.8. Microsoft Corporation

            19.1.8.1. Overview

            19.1.8.2. Product Portfolio

            19.1.8.3. Profitability by Market Segments

            19.1.8.4. Sales Footprint

            19.1.8.5. Strategy Overview

                19.1.8.5.1. Marketing Strategy

        19.1.9. Quark Software, Inc.

            19.1.9.1. Overview

            19.1.9.2. Product Portfolio

            19.1.9.3. Profitability by Market Segments

            19.1.9.4. Sales Footprint

            19.1.9.5. Strategy Overview

                19.1.9.5.1. Marketing Strategy

        19.1.10. Trivantis

            19.1.10.1. Overview

            19.1.10.2. Product Portfolio

            19.1.10.3. Profitability by Market Segments

            19.1.10.4. Sales Footprint

            19.1.10.5. Strategy Overview

                19.1.10.5.1. Marketing Strategy

20. Assumptions & Acronyms Used

21. Research Methodology

Recommendations

Technology

Content Creation Software Market

August 2023

REP-GB-15611

324 pages

Technology

Social Media Content Creation Market

October 2022

REP-GB-14929

309 pages

Explore Technology Insights

View Reports
Future Market Insights

Content Creation Market

Schedule a Call