Compostable Plastic Packaging Material Market Size and Share Forecast Outlook 2025 to 2035

The compostable plastic packaging material market is projected to grow from USD 2.1 billion in 2025 to USD 3.5 billion by 2035, registering a CAGR of 5.2% during the forecast period. Sales in 2024 reached USD 1.9 billion, reflecting steady growth driven by increasing demand for sustainable and eco-friendly packaging solutions.

Quick Stats of Compostable Plastic Packaging Material Market

  • Market Value (2025): USD 2.1 billion
  • Forecast Value (2035): USD 3.5 billion
  • Forecast CAGR: 5.2%
  • Product Leader in 2025: Polylactic acid (PLA) (36.4% market share)
  • Top Application: Food and Beverage (48.7% share)
  • Key Growth Region: North America (USA is the fastest-growing market with 7.2% CAGR)
Metric Value
Market Size in 2025 USD 2.1 Billion
Projected Market Size in 2035 USD 3.5 Billion
CAGR (2025 to 2035) 5.2%

This growth is attributed to the rising environmental concerns, government regulations banning single-use plastics, and the surge in e-commerce and retail sectors seeking biodegradable alternatives. The market's expansion is further supported by innovations in compostable plastic packaging materials, enhancing their durability and appeal to both consumers and retailers.

In 2025, Cornwall Airport in Newquay started composting their used Vegware packaging in 2024. After understanding Cornwall Airport’s sustainability goals, Vegware’s Senior Waste Management Consultant, David Dyce advised on the composting solutions available. “For Cornwall Airport’s needs and requirements, one solution stood out - First Mile’s Return and Recycle scheme. Together with First Mile, we worked with Cornwall Airport to establish a post back service. With the system implemented across the whole site, used Vegware packaging could be collected and sent for in-vessel composting”.

The compostable plastic packaging material market is largely driven by sustainability, with producers concentrating on developing packaging from renewable and biodegradable materials. Innovations include the development of advanced compostable polymers, integration of smart features such as composability indicators, and ergonomic designs for enhanced user experience.

These advancements align with global sustainability goals and regulatory requirements, making compostable plastic packaging materials an attractive option for environmentally conscious consumers. Additionally, the development of modular and customizable packaging solutions has enhanced efficiency and convenience for users, further driving market growth.

Rapid expansion is expected in the compostable plastic packaging material market, fueled by rising demand for sustainable and environmentally friendly packaging options across the food and beverage, healthcare, and personal care sectors. Companies investing in innovative, biodegradable technologies are expected to gain a competitive edge.

The market's expansion is further supported by the growing consumer awareness and the shift towards circular economy practices. With continuous advancements in materials and manufacturing processes, the compostable plastic packaging material market is set to offer lucrative opportunities for stakeholders over the forecast period.

Analyzing Compostable Plastic Packaging Material Market by Top Investment Segment

The market is segmented on the basis of material type, end-use industry, and region. By material type, the market encompasses polylactic acid (PLA), polyhydroxyalkanoates (PHA), starch blends, cellulose-based materials, polybutylene succinate (PBS), and other bio-based polymers. In terms of end-use industry, the market is categorized into food & beverage, personal care & cosmetics, healthcare & pharmaceuticals, homecare & toiletries, agriculture & horticulture, and industrial goods.

From a regional perspective, the market is analyzed across North America, Latin America, East Asia, South Asia & Pacific, Eastern Europe, Western Europe, Oceania, and the Middle East & Africa.
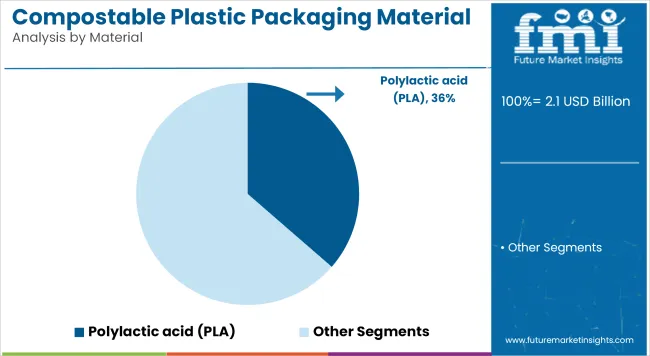
Polylactic Acid (PLA) Preferred for Food Contact Safety and Thermoform ability

Compostable Plastic Packaging Material Market Analysis By Material

Polylactic acid (PLA) has been projected to account for 36.4% of the global compostable plastic packaging material market by 2025, owing to its bio-based origin, commercial composability, and suitability for direct food contact. Derived from renewable agricultural sources such as corn starch and sugarcane, PLA has been widely adopted for rigid and semi-rigid packaging formats in foodservice and consumer goods applications. Its compatibility with conventional thermoforming, extrusion, and injection molding processes has enabled streamlined integration into existing production lines.

Transparent PLA films and clamshell containers have been used in bakery, produce, and takeaway segments, offering clarity and stiffness comparable to PET. Heat resistance and barrier performance have been enhanced through copolymerization and blending with other bio resins.

Global CPG brands and packaging converters have deployed PLA in trays, cups, blister packs, and labels to meet zero-waste targets and comply with compostable packaging mandates. Composting certification by organizations such as TÜV Austria and BPI has supported end-user acceptance across regulated markets.

Market adoption has been further driven by expanding PLA resin capacities in the USA, China, and Europe, alongside improvements in feedstock supply chain sustainability. The alignment of PLA with plastic bans, EPR frameworks, and food packaging circularity initiatives has strengthened its position as the leading material in the compostable packaging domain.
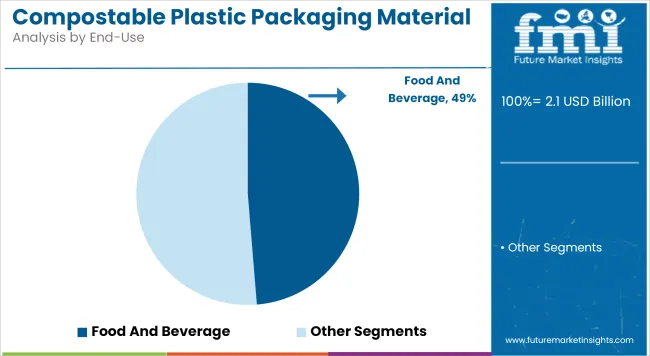
Food & Beverage Sector Leads in Compostable Packaging Deployment

Compostable Plastic Packaging Material Market Analysis By End Use

The food and beverage industry has been estimated to contribute 48.7% of the global compostable plastic packaging material market by 2025, supported by rapid demand for single-use, biodegradable alternatives to conventional plastic films and containers. Compostable pouches, cutlery, sachets, and thermoformed trays have been increasingly introduced across ready-to-eat meals, beverages, snacks, and produce segments.

Packaging functionality has been maintained through multilayer structures combining PLA, PBS, or starch blends, offering adequate moisture and oxygen barriers while ensuring industrial composability. Hot-fill compatibility, seal integrity, and grease resistance have also been improved to align with product shelf-life requirements.

Adoption has been accelerated by bans on non-recyclable plastics in food packaging, particularly across Europe and North America. Restaurant chains, organic brands, and specialty food retailers have integrated compostable solutions to align with clean-label and low-impact consumption trends.

Food safety compliance, printing compatibility, and certifications such as EN 13432 and ASTM D6400 have been central to packaging transitions in this sector. Supply chain collaborations between resin producers, converters, and retailers have enabled scalability, allowing compostable packaging materials to become embedded in high-volume food and beverage workflows.

Challenges and Opportunities

Challenges

Cost and infrastructure limitations Compostable plastics often have higher production costs compared to conventional plastics. Additionally, limited composting infrastructure and inconsistent composting standards pose challenges for widespread adoption.

Opportunities

Material innovation and policy-driven growth Advancements in next-generation biopolymers, including PHA and PLA blends, are improving the performance and cost-efficiency of compostable plastics. Government policies banning petroleum-based plastics and promoting compostable packaging are creating new market opportunities. The development of at-home compostable materials is expanding the market reach to individual consumers.
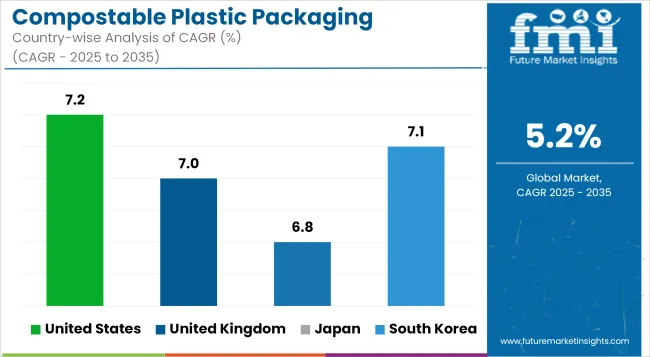
Country-wise Outlook

Compostable Plastic Packaging Material Market Cagr Analysis By Country

United States

The compostable plastic packaging material market in the United States has emerged owing to the consumer requirement for sustainable and environmentally safe alternatives to conventional plastics. The transition toward biodegradable films, plant-based polymers, and compostable resins in food and beverage, as well as e-commerce packaging, is accelerated with stricter environmental regulations and corporate sustainability initiatives.

American manufacturers have been actively working to promote the development of innovative bio-based materials such as PLA and PHA with enhanced barrier properties and shelf-life. The development of high-performance compostable laminates and advanced coatings for water-resistance are making way for durable compostable packaging solutions.

An AI-based automation system in manufacturing processes is being adopted for better production efficiency and waste reduction. Research is being conducted on compostable packaging that has properties such as oxygen barrier functionalities, which would help in sustaining product freshness for longer. Further, biodegradable smart labels are being developed to enable the consumer to receive instant disposal and sustainability information.

Country CAGR (2025 to 2035)
United States 7.2%

United Kingdom

The UK's market for compostable plastic packaging materials is rapidly witnessing a surge and a significant boom as a result of the government's strict policies to reduce plastic waste. The imposition of the UK Plastic Packaging Tax, combined with single-use plastic bans, has triggered many companies toward opting for compostable packaging for food service, retail, and personal care packaging.

Brands are now integrating home-compostable and industrially compostable films for their packaging to meet circular economy goals. UK manufacturers are now creating high-barrier compostable coatings to bolster moisture resistance and product protection, especially for food packaging applications.

Besides, AI-led quality control systems are influencing uniformity in the production of compostable materials. Research on compostable barrier films is improving the oxygen and moisture resistance for longer shelf life for products. The refillable packaging models have also encouraged brands to consider compostable alternatives for disposable elements.

Country CAGR (2025 to 2035)
United Kingdom 7.0%

Japan

The market for compostable plastic packaging material here in Japan keeps gaining momentum with an emphasis on reflecting environmental responsibility and higher advanced packaging technology. The 2050 carbon neutrality commitment in a country has prompted the increased utilization of biodegradable plastic films, compostable pouches, and laminated fiber-based materials in a growing number.

Japanese manufacturers develop heat-resistant and high-strength compostable plastics fit for food wrapping and pharmaceutical applications. Also, the studies concerning nano-enhanced biopolymers are improving the mechanical properties and barrier properties of compostable packaging materials.

The integration of smart sensors into compostable films is gaining momentum as a way to monitor the packaging surroundings in real time. Companies are also investigating plant-based antimicrobial coatings for improved shelf life. Ultra-thin compostable laminates are helping in materials savings and at the same time increasing their strength.

Country CAGR (2025 to 2035)
Japan 6.8%

South Korea

The compostable plastic packaging materials market in South Korea is growing rapidly because there are a lot of green initiatives pushed by governments and corporate sustainability pledges. Micro rise of eco-friendly consumers was affected by the demand for compostable films, biodegradable trays, and plant-based packaging solutions.

Manufacturers have come up with integrating smart composting indicators into their packaging materials to serve customers with proper disposal education. They have also come up with compostable multi-layer films, making it possible for sustainable packaging to perform better even in humid conditions like fresh produce and frozen foods.

Heat sealable compostable films have improved integrity packaging for different food applications. Researching antimicrobial biopolymers is considerable to prolong shelf life and improve food safety. AI-driven quality control systems are adopted to maintain uniformity in production compostable materials.

Country CAGR (2025 to 2035)
South Korea 7.1%

Competitive Outlook

The compostable plastic packaging material industry is expanding fast as companies are looking for environmentally friendly, biodegradable, and high-performance solutions to conventional plastics. Companies are launching plant-based resins, water-resistant biodegradable films, and compostable adhesives to enhance the material's strength and performance.

Ultra-thin compostable coatings with enhanced food preservation are being developed by companies while ensuring recyclability. Smart compostable labeling is also becoming popular, facilitating improved waste sorting and disposal. Demand for transparent compostable films is growing, enabling customers to glimpse products on packs without needing traditional plastics.

Alliances between innovative sustainable materials providers and pack firms are speeding industry uptake of compostable options.

Key Company Insights

  • NatureWorks LLC
  • BASF SE
  • Novamont S.p.A
  • TIPA Corp.
  • Biome Bioplastics

Key Segments

By Material:

  • PBAT
  • PBS
  • PLA
  • PHA
  • Starch Blends
  • Others

By Application:

  • Bags
  • Pouches
  • Boxes
  • Bottles
  • Cups
  • Trays
  • Plates & Bowls
  • Others

By End User Industry:

  • Food Service
  • Food & Beverage
  • Cosmetics & Personal Care
  • Homecare
  • Healthcare
  • Others

Region:

  • North America
  • Latin America
  • East Asia
  • South Asia & Pacific
  • Eastern Europe
  • Western Europe
  • Middle East & Africa

Table of Content

  1. Executive Summary
  2. Industry Introduction, including Taxonomy and Market Definition
  3. Market Trends and Success Factors, including Macro-economic Factors, Market Dynamics, and Recent Industry Developments
  4. Global Market Demand Analysis 2020 to 2024 and Forecast 2025 to 2035, including Historical Analysis and Future Projections
  5. Global Market Analysis 2020 to 2024 and Forecast 2025 to 2035
    • Material
    • Application
    • End User Industry
  6. Global Market Analysis 2020 to 2024 and Forecast 2025 to 2035, By Material
    • PBAT
    • PBS
    • PLA
    • PHA
    • Starch Blends
    • Others
  7. Global Market Analysis 2020 to 2024 and Forecast 2025 to 2035, By Application
    • Bags
    • Pouches
    • Boxes
    • Bottles
    • Cups
    • Trays
    • Plates & Bowls
    • Others
  8. Global Market Analysis 2020 to 2024 and Forecast 2025 to 2035, By End User Industry
    • Food Service
    • Food & Beverage
    • Cosmetics & Personal Care
    • Homecare
    • Healthcare
    • Others
  9. Global Market Analysis 2020 to 2024 and Forecast 2025 to 2035, By Region
    • North America
    • Latin America
    • East Asia
    • South Asia & Pacific
    • Eastern Europe
    • Western Europe
    • Middle East & Africa
  10. North America Sales Analysis 2020 to 2024 and Forecast 2025 to 2035, by Key Segments and Countries
  11. Latin America Sales Analysis 2020 to 2024 and Forecast 2025 to 2035, by Key Segments and Countries
  12. East Asia Sales Analysis 2020 to 2024 and Forecast 2025 to 2035, by Key Segments and Countries
  13. South Asia & Pacific Sales Analysis 2020 to 2024 and Forecast 2025 to 2035, by Key Segments and Countries
  14. Eastern Europe Sales Analysis 2020 to 2024 and Forecast 2025 to 2035, by Key Segments and Countries
  15. Western Europe Sales Analysis 2020 to 2024 and Forecast 2025 to 2035, by Key Segments and Countries
  16. Middle East & Africa Sales Analysis 2020 to 2024 and Forecast 2025 to 2035, by Key Segments and Countries
  17. Sales Forecast 2025 to 2035 by Material, Application, and End User Industry for 30 Countries
  18. Competition Outlook, including Market Structure Analysis, Company Share Analysis by Key Players, and Competition Dashboard
  19. Company Profile
    • NatureWorks LLC
    • BASF SE
    • Novamont S.p.A
    • TIPA Corp.
    • Biome Bioplastics
    • FKuR Kunststoff GmbH
    • Total Corbion PLA
    • Danimer Scientific
    • TIPPER TIE (JBT Corporation)
    • Good Natured Products Inc

List of Tables

  • Table 1: Global Market Value (USD Billion) Forecast by Region, 2020 to 2035
  • Table 2: Global Market Volume (Tons) Forecast by Region, 2020 to 2035
  • Table 3: Global Market Value (USD Billion) Forecast by Material, 2020 to 2035
  • Table 4: Global Market Volume (Tons) Forecast by Material, 2020 to 2035
  • Table 5: Global Market Value (USD Billion) Forecast by Application, 2020 to 2035
  • Table 6: Global Market Volume (Tons) Forecast by Application, 2020 to 2035
  • Table 7: Global Market Value (USD Billion) Forecast by End-user industry, 2020 to 2035
  • Table 8: Global Market Volume (Tons) Forecast by End-user industry, 2020 to 2035
  • Table 9: North America Market Value (USD Billion) Forecast by Country, 2020 to 2035
  • Table 10: North America Market Volume (Tons) Forecast by Country, 2020 to 2035
  • Table 11: North America Market Value (USD Billion) Forecast by Material, 2020 to 2035
  • Table 12: North America Market Volume (Tons) Forecast by Material, 2020 to 2035
  • Table 13: North America Market Value (USD Billion) Forecast by Application, 2020 to 2035
  • Table 14: North America Market Volume (Tons) Forecast by Application, 2020 to 2035
  • Table 15: North America Market Value (USD Billion) Forecast by End-user industry, 2020 to 2035
  • Table 16: North America Market Volume (Tons) Forecast by End-user industry, 2020 to 2035
  • Table 17: Latin America Market Value (USD Billion) Forecast by Country, 2020 to 2035
  • Table 18: Latin America Market Volume (Tons) Forecast by Country, 2020 to 2035
  • Table 19: Latin America Market Value (USD Billion) Forecast by Material, 2020 to 2035
  • Table 20: Latin America Market Volume (Tons) Forecast by Material, 2020 to 2035
  • Table 21: Latin America Market Value (USD Billion) Forecast by Application, 2020 to 2035
  • Table 22: Latin America Market Volume (Tons) Forecast by Application, 2020 to 2035
  • Table 23: Latin America Market Value (USD Billion) Forecast by End-user industry, 2020 to 2035
  • Table 24: Latin America Market Volume (Tons) Forecast by End-user industry, 2020 to 2035
  • Table 25: Western Europe Market Value (USD Billion) Forecast by Country, 2020 to 2035
  • Table 26: Western Europe Market Volume (Tons) Forecast by Country, 2020 to 2035
  • Table 27: Western Europe Market Value (USD Billion) Forecast by Material, 2020 to 2035
  • Table 28: Western Europe Market Volume (Tons) Forecast by Material, 2020 to 2035
  • Table 29: Western Europe Market Value (USD Billion) Forecast by Application, 2020 to 2035
  • Table 30: Western Europe Market Volume (Tons) Forecast by Application, 2020 to 2035
  • Table 31: Western Europe Market Value (USD Billion) Forecast by End-user industry, 2020 to 2035
  • Table 32: Western Europe Market Volume (Tons) Forecast by End-user industry, 2020 to 2035
  • Table 33: Eastern Europe Market Value (USD Billion) Forecast by Country, 2020 to 2035
  • Table 34: Eastern Europe Market Volume (Tons) Forecast by Country, 2020 to 2035
  • Table 35: Eastern Europe Market Value (USD Billion) Forecast by Material, 2020 to 2035
  • Table 36: Eastern Europe Market Volume (Tons) Forecast by Material, 2020 to 2035
  • Table 37: Eastern Europe Market Value (USD Billion) Forecast by Application, 2020 to 2035
  • Table 38: Eastern Europe Market Volume (Tons) Forecast by Application, 2020 to 2035
  • Table 39: Eastern Europe Market Value (USD Billion) Forecast by End-user industry, 2020 to 2035
  • Table 40: Eastern Europe Market Volume (Tons) Forecast by End-user industry, 2020 to 2035
  • Table 41: South Asia and Pacific Market Value (USD Billion) Forecast by Country, 2020 to 2035
  • Table 42: South Asia and Pacific Market Volume (Tons) Forecast by Country, 2020 to 2035
  • Table 43: South Asia and Pacific Market Value (USD Billion) Forecast by Material, 2020 to 2035
  • Table 44: South Asia and Pacific Market Volume (Tons) Forecast by Material, 2020 to 2035
  • Table 45: South Asia and Pacific Market Value (USD Billion) Forecast by Application, 2020 to 2035
  • Table 46: South Asia and Pacific Market Volume (Tons) Forecast by Application, 2020 to 2035
  • Table 47: South Asia and Pacific Market Value (USD Billion) Forecast by End-user industry, 2020 to 2035
  • Table 48: South Asia and Pacific Market Volume (Tons) Forecast by End-user industry, 2020 to 2035
  • Table 49: East Asia Market Value (USD Billion) Forecast by Country, 2020 to 2035
  • Table 50: East Asia Market Volume (Tons) Forecast by Country, 2020 to 2035
  • Table 51: East Asia Market Value (USD Billion) Forecast by Material, 2020 to 2035
  • Table 52: East Asia Market Volume (Tons) Forecast by Material, 2020 to 2035
  • Table 53: East Asia Market Value (USD Billion) Forecast by Application, 2020 to 2035
  • Table 54: East Asia Market Volume (Tons) Forecast by Application, 2020 to 2035
  • Table 55: East Asia Market Value (USD Billion) Forecast by End-user industry, 2020 to 2035
  • Table 56: East Asia Market Volume (Tons) Forecast by End-user industry, 2020 to 2035
  • Table 57: Middle East and Africa Market Value (USD Billion) Forecast by Country, 2020 to 2035
  • Table 58: Middle East and Africa Market Volume (Tons) Forecast by Country, 2020 to 2035
  • Table 59: Middle East and Africa Market Value (USD Billion) Forecast by Material, 2020 to 2035
  • Table 60: Middle East and Africa Market Volume (Tons) Forecast by Material, 2020 to 2035
  • Table 61: Middle East and Africa Market Value (USD Billion) Forecast by Application, 2020 to 2035
  • Table 62: Middle East and Africa Market Volume (Tons) Forecast by Application, 2020 to 2035
  • Table 63: Middle East and Africa Market Value (USD Billion) Forecast by End-user industry, 2020 to 2035
  • Table 64: Middle East and Africa Market Volume (Tons) Forecast by End-user industry, 2020 to 2035

List of Figures

  • Figure 1: Global Market Value (USD Billion) by Material, 2025 to 2035
  • Figure 2: Global Market Value (USD Billion) by Application, 2025 to 2035
  • Figure 3: Global Market Value (USD Billion) by End-user industry, 2025 to 2035
  • Figure 4: Global Market Value (USD Billion) by Region, 2025 to 2035
  • Figure 5: Global Market Value (USD Billion) Analysis by Region, 2020 to 2035
  • Figure 6: Global Market Volume (Tons) Analysis by Region, 2020 to 2035
  • Figure 7: Global Market Value Share (%) and BPS Analysis by Region, 2025 to 2035
  • Figure 8: Global Market Y-o-Y Growth (%) Projections by Region, 2025 to 2035
  • Figure 9: Global Market Value (USD Billion) Analysis by Material, 2020 to 2035
  • Figure 10: Global Market Volume (Tons) Analysis by Material, 2020 to 2035
  • Figure 11: Global Market Value Share (%) and BPS Analysis by Material, 2025 to 2035
  • Figure 12: Global Market Y-o-Y Growth (%) Projections by Material, 2025 to 2035
  • Figure 13: Global Market Value (USD Billion) Analysis by Application, 2020 to 2035
  • Figure 14: Global Market Volume (Tons) Analysis by Application, 2020 to 2035
  • Figure 15: Global Market Value Share (%) and BPS Analysis by Application, 2025 to 2035
  • Figure 16: Global Market Y-o-Y Growth (%) Projections by Application, 2025 to 2035
  • Figure 17: Global Market Value (USD Billion) Analysis by End-user industry, 2020 to 2035
  • Figure 18: Global Market Volume (Tons) Analysis by End-user industry, 2020 to 2035
  • Figure 19: Global Market Value Share (%) and BPS Analysis by End-user industry, 2025 to 2035
  • Figure 20: Global Market Y-o-Y Growth (%) Projections by End-user industry, 2025 to 2035
  • Figure 21: Global Market Attractiveness by Material, 2025 to 2035
  • Figure 22: Global Market Attractiveness by Application, 2025 to 2035
  • Figure 23: Global Market Attractiveness by End-user industry, 2025 to 2035
  • Figure 24: Global Market Attractiveness by Region, 2025 to 2035
  • Figure 25: North America Market Value (USD Billion) by Material, 2025 to 2035
  • Figure 26: North America Market Value (USD Billion) by Application, 2025 to 2035
  • Figure 27: North America Market Value (USD Billion) by End-user industry, 2025 to 2035
  • Figure 28: North America Market Value (USD Billion) by Country, 2025 to 2035
  • Figure 29: North America Market Value (USD Billion) Analysis by Country, 2020 to 2035
  • Figure 30: North America Market Volume (Tons) Analysis by Country, 2020 to 2035
  • Figure 31: North America Market Value Share (%) and BPS Analysis by Country, 2025 to 2035
  • Figure 32: North America Market Y-o-Y Growth (%) Projections by Country, 2025 to 2035
  • Figure 33: North America Market Value (USD Billion) Analysis by Material, 2020 to 2035
  • Figure 34: North America Market Volume (Tons) Analysis by Material, 2020 to 2035
  • Figure 35: North America Market Value Share (%) and BPS Analysis by Material, 2025 to 2035
  • Figure 36: North America Market Y-o-Y Growth (%) Projections by Material, 2025 to 2035
  • Figure 37: North America Market Value (USD Billion) Analysis by Application, 2020 to 2035
  • Figure 38: North America Market Volume (Tons) Analysis by Application, 2020 to 2035
  • Figure 39: North America Market Value Share (%) and BPS Analysis by Application, 2025 to 2035
  • Figure 40: North America Market Y-o-Y Growth (%) Projections by Application, 2025 to 2035
  • Figure 41: North America Market Value (USD Billion) Analysis by End-user industry, 2020 to 2035
  • Figure 42: North America Market Volume (Tons) Analysis by End-user industry, 2020 to 2035
  • Figure 43: North America Market Value Share (%) and BPS Analysis by End-user industry, 2025 to 2035
  • Figure 44: North America Market Y-o-Y Growth (%) Projections by End-user industry, 2025 to 2035
  • Figure 45: North America Market Attractiveness by Material, 2025 to 2035
  • Figure 46: North America Market Attractiveness by Application, 2025 to 2035
  • Figure 47: North America Market Attractiveness by End-user industry, 2025 to 2035
  • Figure 48: North America Market Attractiveness by Country, 2025 to 2035
  • Figure 49: Latin America Market Value (USD Billion) by Material, 2025 to 2035
  • Figure 50: Latin America Market Value (USD Billion) by Application, 2025 to 2035
  • Figure 51: Latin America Market Value (USD Billion) by End-user industry, 2025 to 2035
  • Figure 52: Latin America Market Value (USD Billion) by Country, 2025 to 2035
  • Figure 53: Latin America Market Value (USD Billion) Analysis by Country, 2020 to 2035
  • Figure 54: Latin America Market Volume (Tons) Analysis by Country, 2020 to 2035
  • Figure 55: Latin America Market Value Share (%) and BPS Analysis by Country, 2025 to 2035
  • Figure 56: Latin America Market Y-o-Y Growth (%) Projections by Country, 2025 to 2035
  • Figure 57: Latin America Market Value (USD Billion) Analysis by Material, 2020 to 2035
  • Figure 58: Latin America Market Volume (Tons) Analysis by Material, 2020 to 2035
  • Figure 59: Latin America Market Value Share (%) and BPS Analysis by Material, 2025 to 2035
  • Figure 60: Latin America Market Y-o-Y Growth (%) Projections by Material, 2025 to 2035
  • Figure 61: Latin America Market Value (USD Billion) Analysis by Application, 2020 to 2035
  • Figure 62: Latin America Market Volume (Tons) Analysis by Application, 2020 to 2035
  • Figure 63: Latin America Market Value Share (%) and BPS Analysis by Application, 2025 to 2035
  • Figure 64: Latin America Market Y-o-Y Growth (%) Projections by Application, 2025 to 2035
  • Figure 65: Latin America Market Value (USD Billion) Analysis by End-user industry, 2020 to 2035
  • Figure 66: Latin America Market Volume (Tons) Analysis by End-user industry, 2020 to 2035
  • Figure 67: Latin America Market Value Share (%) and BPS Analysis by End-user industry, 2025 to 2035
  • Figure 68: Latin America Market Y-o-Y Growth (%) Projections by End-user industry, 2025 to 2035
  • Figure 69: Latin America Market Attractiveness by Material, 2025 to 2035
  • Figure 70: Latin America Market Attractiveness by Application, 2025 to 2035
  • Figure 71: Latin America Market Attractiveness by End-user industry, 2025 to 2035
  • Figure 72: Latin America Market Attractiveness by Country, 2025 to 2035
  • Figure 73: Western Europe Market Value (USD Billion) by Material, 2025 to 2035
  • Figure 74: Western Europe Market Value (USD Billion) by Application, 2025 to 2035
  • Figure 75: Western Europe Market Value (USD Billion) by End-user industry, 2025 to 2035
  • Figure 76: Western Europe Market Value (USD Billion) by Country, 2025 to 2035
  • Figure 77: Western Europe Market Value (USD Billion) Analysis by Country, 2020 to 2035
  • Figure 78: Western Europe Market Volume (Tons) Analysis by Country, 2020 to 2035
  • Figure 79: Western Europe Market Value Share (%) and BPS Analysis by Country, 2025 to 2035
  • Figure 80: Western Europe Market Y-o-Y Growth (%) Projections by Country, 2025 to 2035
  • Figure 81: Western Europe Market Value (USD Billion) Analysis by Material, 2020 to 2035
  • Figure 82: Western Europe Market Volume (Tons) Analysis by Material, 2020 to 2035
  • Figure 83: Western Europe Market Value Share (%) and BPS Analysis by Material, 2025 to 2035
  • Figure 84: Western Europe Market Y-o-Y Growth (%) Projections by Material, 2025 to 2035
  • Figure 85: Western Europe Market Value (USD Billion) Analysis by Application, 2020 to 2035
  • Figure 86: Western Europe Market Volume (Tons) Analysis by Application, 2020 to 2035
  • Figure 87: Western Europe Market Value Share (%) and BPS Analysis by Application, 2025 to 2035
  • Figure 88: Western Europe Market Y-o-Y Growth (%) Projections by Application, 2025 to 2035
  • Figure 89: Western Europe Market Value (USD Billion) Analysis by End-user industry, 2020 to 2035
  • Figure 90: Western Europe Market Volume (Tons) Analysis by End-user industry, 2020 to 2035
  • Figure 91: Western Europe Market Value Share (%) and BPS Analysis by End-user industry, 2025 to 2035
  • Figure 92: Western Europe Market Y-o-Y Growth (%) Projections by End-user industry, 2025 to 2035
  • Figure 93: Western Europe Market Attractiveness by Material, 2025 to 2035
  • Figure 94: Western Europe Market Attractiveness by Application, 2025 to 2035
  • Figure 95: Western Europe Market Attractiveness by End-user industry, 2025 to 2035
  • Figure 96: Western Europe Market Attractiveness by Country, 2025 to 2035
  • Figure 97: Eastern Europe Market Value (USD Billion) by Material, 2025 to 2035
  • Figure 98: Eastern Europe Market Value (USD Billion) by Application, 2025 to 2035
  • Figure 99: Eastern Europe Market Value (USD Billion) by End-user industry, 2025 to 2035
  • Figure 100: Eastern Europe Market Value (USD Billion) by Country, 2025 to 2035
  • Figure 101: Eastern Europe Market Value (USD Billion) Analysis by Country, 2020 to 2035
  • Figure 102: Eastern Europe Market Volume (Tons) Analysis by Country, 2020 to 2035
  • Figure 103: Eastern Europe Market Value Share (%) and BPS Analysis by Country, 2025 to 2035
  • Figure 104: Eastern Europe Market Y-o-Y Growth (%) Projections by Country, 2025 to 2035
  • Figure 105: Eastern Europe Market Value (USD Billion) Analysis by Material, 2020 to 2035
  • Figure 106: Eastern Europe Market Volume (Tons) Analysis by Material, 2020 to 2035
  • Figure 107: Eastern Europe Market Value Share (%) and BPS Analysis by Material, 2025 to 2035
  • Figure 108: Eastern Europe Market Y-o-Y Growth (%) Projections by Material, 2025 to 2035
  • Figure 109: Eastern Europe Market Value (USD Billion) Analysis by Application, 2020 to 2035
  • Figure 110: Eastern Europe Market Volume (Tons) Analysis by Application, 2020 to 2035
  • Figure 111: Eastern Europe Market Value Share (%) and BPS Analysis by Application, 2025 to 2035
  • Figure 112: Eastern Europe Market Y-o-Y Growth (%) Projections by Application, 2025 to 2035
  • Figure 113: Eastern Europe Market Value (USD Billion) Analysis by End-user industry, 2020 to 2035
  • Figure 114: Eastern Europe Market Volume (Tons) Analysis by End-user industry, 2020 to 2035
  • Figure 115: Eastern Europe Market Value Share (%) and BPS Analysis by End-user industry, 2025 to 2035
  • Figure 116: Eastern Europe Market Y-o-Y Growth (%) Projections by End-user industry, 2025 to 2035
  • Figure 117: Eastern Europe Market Attractiveness by Material, 2025 to 2035
  • Figure 118: Eastern Europe Market Attractiveness by Application, 2025 to 2035
  • Figure 119: Eastern Europe Market Attractiveness by End-user industry, 2025 to 2035
  • Figure 120: Eastern Europe Market Attractiveness by Country, 2025 to 2035
  • Figure 121: South Asia and Pacific Market Value (USD Billion) by Material, 2025 to 2035
  • Figure 122: South Asia and Pacific Market Value (USD Billion) by Application, 2025 to 2035
  • Figure 123: South Asia and Pacific Market Value (USD Billion) by End-user industry, 2025 to 2035
  • Figure 124: South Asia and Pacific Market Value (USD Billion) by Country, 2025 to 2035
  • Figure 125: South Asia and Pacific Market Value (USD Billion) Analysis by Country, 2020 to 2035
  • Figure 126: South Asia and Pacific Market Volume (Tons) Analysis by Country, 2020 to 2035
  • Figure 127: South Asia and Pacific Market Value Share (%) and BPS Analysis by Country, 2025 to 2035
  • Figure 128: South Asia and Pacific Market Y-o-Y Growth (%) Projections by Country, 2025 to 2035
  • Figure 129: South Asia and Pacific Market Value (USD Billion) Analysis by Material, 2020 to 2035
  • Figure 130: South Asia and Pacific Market Volume (Tons) Analysis by Material, 2020 to 2035
  • Figure 131: South Asia and Pacific Market Value Share (%) and BPS Analysis by Material, 2025 to 2035
  • Figure 132: South Asia and Pacific Market Y-o-Y Growth (%) Projections by Material, 2025 to 2035
  • Figure 133: South Asia and Pacific Market Value (USD Billion) Analysis by Application, 2020 to 2035
  • Figure 134: South Asia and Pacific Market Volume (Tons) Analysis by Application, 2020 to 2035
  • Figure 135: South Asia and Pacific Market Value Share (%) and BPS Analysis by Application, 2025 to 2035
  • Figure 136: South Asia and Pacific Market Y-o-Y Growth (%) Projections by Application, 2025 to 2035
  • Figure 137: South Asia and Pacific Market Value (USD Billion) Analysis by End-user industry, 2020 to 2035
  • Figure 138: South Asia and Pacific Market Volume (Tons) Analysis by End-user industry, 2020 to 2035
  • Figure 139: South Asia and Pacific Market Value Share (%) and BPS Analysis by End-user industry, 2025 to 2035
  • Figure 140: South Asia and Pacific Market Y-o-Y Growth (%) Projections by End-user industry, 2025 to 2035
  • Figure 141: South Asia and Pacific Market Attractiveness by Material, 2025 to 2035
  • Figure 142: South Asia and Pacific Market Attractiveness by Application, 2025 to 2035
  • Figure 143: South Asia and Pacific Market Attractiveness by End-user industry, 2025 to 2035
  • Figure 144: South Asia and Pacific Market Attractiveness by Country, 2025 to 2035
  • Figure 145: East Asia Market Value (USD Billion) by Material, 2025 to 2035
  • Figure 146: East Asia Market Value (USD Billion) by Application, 2025 to 2035
  • Figure 147: East Asia Market Value (USD Billion) by End-user industry, 2025 to 2035
  • Figure 148: East Asia Market Value (USD Billion) by Country, 2025 to 2035
  • Figure 149: East Asia Market Value (USD Billion) Analysis by Country, 2020 to 2035
  • Figure 150: East Asia Market Volume (Tons) Analysis by Country, 2020 to 2035
  • Figure 151: East Asia Market Value Share (%) and BPS Analysis by Country, 2025 to 2035
  • Figure 152: East Asia Market Y-o-Y Growth (%) Projections by Country, 2025 to 2035
  • Figure 153: East Asia Market Value (USD Billion) Analysis by Material, 2020 to 2035
  • Figure 154: East Asia Market Volume (Tons) Analysis by Material, 2020 to 2035
  • Figure 155: East Asia Market Value Share (%) and BPS Analysis by Material, 2025 to 2035
  • Figure 156: East Asia Market Y-o-Y Growth (%) Projections by Material, 2025 to 2035
  • Figure 157: East Asia Market Value (USD Billion) Analysis by Application, 2020 to 2035
  • Figure 158: East Asia Market Volume (Tons) Analysis by Application, 2020 to 2035
  • Figure 159: East Asia Market Value Share (%) and BPS Analysis by Application, 2025 to 2035
  • Figure 160: East Asia Market Y-o-Y Growth (%) Projections by Application, 2025 to 2035
  • Figure 161: East Asia Market Value (USD Billion) Analysis by End-user industry, 2020 to 2035
  • Figure 162: East Asia Market Volume (Tons) Analysis by End-user industry, 2020 to 2035
  • Figure 163: East Asia Market Value Share (%) and BPS Analysis by End-user industry, 2025 to 2035
  • Figure 164: East Asia Market Y-o-Y Growth (%) Projections by End-user industry, 2025 to 2035
  • Figure 165: East Asia Market Attractiveness by Material, 2025 to 2035
  • Figure 166: East Asia Market Attractiveness by Application, 2025 to 2035
  • Figure 167: East Asia Market Attractiveness by End-user industry, 2025 to 2035
  • Figure 168: East Asia Market Attractiveness by Country, 2025 to 2035
  • Figure 169: Middle East and Africa Market Value (USD Billion) by Material, 2025 to 2035
  • Figure 170: Middle East and Africa Market Value (USD Billion) by Application, 2025 to 2035
  • Figure 171: Middle East and Africa Market Value (USD Billion) by End-user industry, 2025 to 2035
  • Figure 172: Middle East and Africa Market Value (USD Billion) by Country, 2025 to 2035
  • Figure 173: Middle East and Africa Market Value (USD Billion) Analysis by Country, 2020 to 2035
  • Figure 174: Middle East and Africa Market Volume (Tons) Analysis by Country, 2020 to 2035
  • Figure 175: Middle East and Africa Market Value Share (%) and BPS Analysis by Country, 2025 to 2035
  • Figure 176: Middle East and Africa Market Y-o-Y Growth (%) Projections by Country, 2025 to 2035
  • Figure 177: Middle East and Africa Market Value (USD Billion) Analysis by Material, 2020 to 2035
  • Figure 178: Middle East and Africa Market Volume (Tons) Analysis by Material, 2020 to 2035
  • Figure 179: Middle East and Africa Market Value Share (%) and BPS Analysis by Material, 2025 to 2035
  • Figure 180: Middle East and Africa Market Y-o-Y Growth (%) Projections by Material, 2025 to 2035
  • Figure 181: Middle East and Africa Market Value (USD Billion) Analysis by Application, 2020 to 2035
  • Figure 182: Middle East and Africa Market Volume (Tons) Analysis by Application, 2020 to 2035
  • Figure 183: Middle East and Africa Market Value Share (%) and BPS Analysis by Application, 2025 to 2035
  • Figure 184: Middle East and Africa Market Y-o-Y Growth (%) Projections by Application, 2025 to 2035
  • Figure 185: Middle East and Africa Market Value (USD Billion) Analysis by End-user industry, 2020 to 2035
  • Figure 186: Middle East and Africa Market Volume (Tons) Analysis by End-user industry, 2020 to 2035
  • Figure 187: Middle East and Africa Market Value Share (%) and BPS Analysis by End-user industry, 2025 to 2035
  • Figure 188: Middle East and Africa Market Y-o-Y Growth (%) Projections by End-user industry, 2025 to 2035
  • Figure 189: Middle East and Africa Market Attractiveness by Material, 2025 to 2035
  • Figure 190: Middle East and Africa Market Attractiveness by Application, 2025 to 2035
  • Figure 191: Middle East and Africa Market Attractiveness by End-user industry, 2025 to 2035
  • Figure 192: Middle East and Africa Market Attractiveness by Country, 2025 to 2035

Frequently Asked Questions

What was the overall size of the Compostable Plastic Packaging Material Market in 2025?

The overall market size for the Compostable Plastic Packaging Material Market was USD 2.1 Billion in 2025.

How big is the Compostable Plastic Packaging Material Market expected to be in 2035?

The Compostable Plastic Packaging Material Market is expected to reach USD 3.5 Billion in 2035.

What will drive the demand for the Compostable Plastic Packaging Material Market during the forecast period?

The Compostable Plastic Packaging Material Market will be driven by increasing regulatory pressures, consumer demand for eco-friendly packaging, and advancements in bio-based packaging technologies.

List the top 5 countries contributing to the Compostable Plastic Packaging Material Market?

The top 5 countries driving the development of the Compostable Plastic Packaging Material Market are the USA, Germany, China, France, and Japan.

Explore Similar Insights

Future Market Insights

Compostable Plastic Packaging Material Market