The Competent Cells Market is estimated to be valued at USD 2.9 billion in 2025 and is projected to reach USD 8.3 billion by 2035, registering a compound annual growth rate (CAGR) of 11.1% over the forecast period.
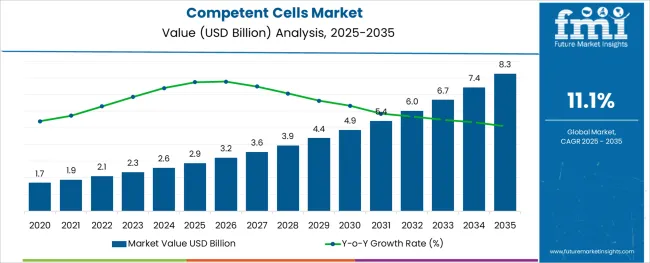
The competent cells market is expanding steadily, supported by the increasing demand for advanced molecular biology tools in biotechnology, genetic engineering, and academic research. Rising investments in synthetic biology, gene therapy, and biologics manufacturing have created favorable conditions for the adoption of high-efficiency cell transformation systems.
The surge in research activities involving plasmid propagation, gene expression, and recombinant protein production has driven the need for reliable and efficient competent cells. Further, advancements in transformation protocols and optimized media formulations are reducing process variability and improving yield consistency.
Regulatory emphasis on reproducibility and standardization in research, particularly in academic and government-funded laboratories, is also enhancing market uptake. As the focus intensifies on personalized medicine and CRISPR-based technologies, the demand for specialized competent cell lines tailored for high-throughput and precise cloning applications is projected to ris.
The market is segmented by Product Type, Application Type, and End User and region. By Product Type, the market is divided into Chemically Competent Cells and Electrocompetent Cells. In terms of Application Type, the market is classified into Cloning, Protein Expression, and Other Applications. Based on End User, the market is segmented into Academic Research Institutes, Pharmaceutical & Biotechnology Companies, and Contract Research Organizations. Regionally, the market is classified into North America, Latin America, Western Europe, Eastern Europe, Balkan & Baltic Countries, Russia & Belarus, Central Asia, East Asia, South Asia & Pacific, and the Middle East & Africa.
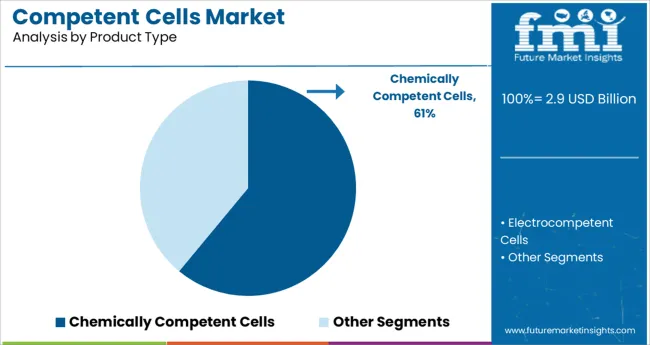
Chemically competent cells are projected to account for 61.0% of total market revenue in 2025, establishing them as the leading product type segment. Their dominance is attributed to ease of preparation, cost-effectiveness, and compatibility with standard transformation techniques such as heat shock.
These cells are widely adopted in both basic and applied research due to their ability to deliver consistent transformation efficiencies for plasmid uptake in bacterial systems. The broad availability of chemically competent cell strains optimized for various applications-such as high-copy plasmids or blue-white screening—has strengthened their position in molecular biology workflows.
Additionally, their extended shelf life, simple storage requirements, and rapid scalability make them the preferred choice in academic labs and small-scale production environments.
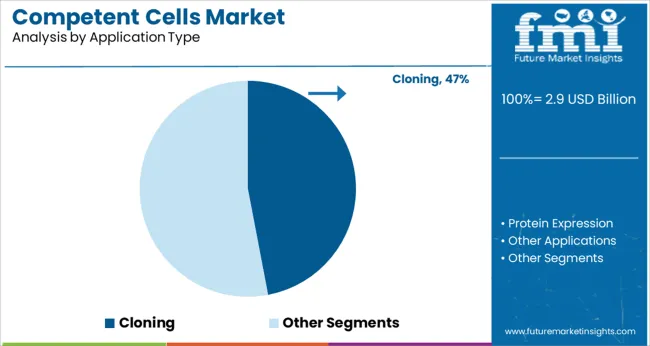
Cloning is expected to account for 47.0% of the market share by 2025, making it the dominant application segment within the competent cells market. This segment’s growth is being driven by the increasing use of recombinant DNA technologies, gene synthesis, and vector construction in drug discovery, diagnostics, and functional genomics.
Competent cells optimized for cloning provide high transformation efficiency, minimizing the need for repeated experiments and reducing time-to-results. Their widespread use in protocols involving PCR product insertion, site-directed mutagenesis, and subcloning has solidified their essential role in molecular workflows.
Furthermore, academic and commercial research institutions continue to prioritize high-quality, validated cell lines to ensure reproducibility and accuracy in gene function studies, further reinforcing the segment’s lead.
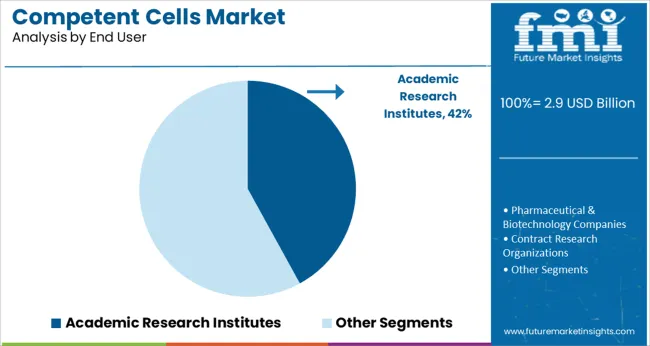
Academic research institutes are projected to contribute 42.0% of the overall market revenue in 2025, ranking as the top end-user segment. This position is supported by sustained funding in life sciences education, basic research, and genomic studies across universities and public research organizations.
The demand for competent cells in these institutions is closely linked to curriculum-driven laboratory work, student-led research projects, and faculty-led innovation programs. Institutions often favor chemically competent cells due to their affordability, reliability, and adaptability across a broad spectrum of cloning and expression applications.
Additionally, the rise of interdisciplinary research initiatives and bio-entrepreneurship programs within universities has accelerated the procurement of competent cell kits for proof-of-concept and early-phase molecular biology work.
Cloning is expected to expand significantly in the application area due to the growing demand for molecularly cloned items. The cloning sector has benefited from COVID-19 as a result of corporations investing more money in research and development. Furthermore, it is anticipated that the segment would develop faster because of increased cloning research and financial assistance from a number of organizations.
Techniques for cell engineering, such as somatic cell nuclear transfer (SCNT), have demonstrated a variety of uses, including the creation of transgenic animals, the preservation of endangered species, and therapeutic cloning. Since competent cells may be employed in therapeutic cloning research, these fields are anticipated to experience renewed attention, which will lead to an increase in demand for these cells.
Due to rising Research and Development expenditures and the commercialization of proteomics and genomics-based goods, the biotechnology sector is also anticipated to see a significant growth rate. The need for cutting-edge product advancements in the treatment of different ailments is also anticipated to support the segment's expansion. Additionally, it is projected that increased investment in research into DNA cloning methods at academic research facilities and the usage of these products in therapies will accelerate market growth in the near future.
During the projected period, it is predicted that the Asia-Pacific market would account for a large portion of the worldwide competent cells market. Extensive research on DNA cloning methods in the area and the existence of significant market participants are credited with the expansion.
For instance, Takara Bio Inc. stated in January 2024 that its new facility, the Center for Gene and Cell Processing II, for manufacturing and research purposes, had been completed in Shiga, Japan.
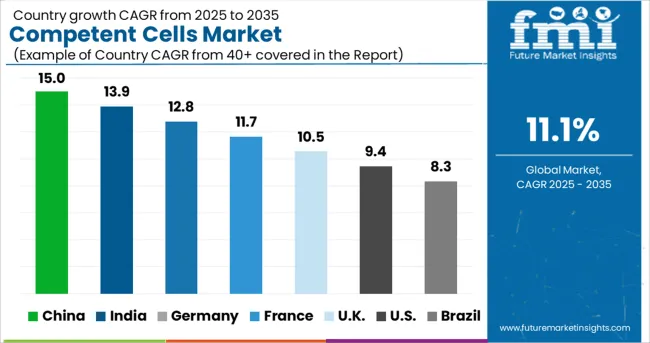
China is expected to develop at a profitable CAGR of 10.1% throughout the projected period and will hold a market share of around 54.2% in East Asia in 2024. The competent cells market will grow as research funding and activity increase.
For instance, the State Key Laboratory of Microbial Application, the Natural Science Foundation of China, and SDU's Qilu Youth Scholar Start-up Funding all provided funding for a research study on Escherichia coli BW25113 competent cells made using a straightforward chemical method that has unparalleled transformation and cloning efficiencies in 2025.
Another regional company, HiMedia Solutions, is situated in India and produces a wide range of goods for the market for competent cells. The HiPurA BL21(DE3) Competent Cells, Bacterial Transformation Kit, HiPurA XL1-Blue Competent Cells, and HiPurA Competent Cells are its four main items for this market. The business is India's top producer of trustworthy cells. Its goods made cloning experiments simpler, such as the HiPurA Competent Cells, which were the first competent DH5a cells marketed on the Indian market. The existence of such businesses is probably going to benefit market growth.
Competent cells are bacterial cells, which can utilize foreign DNA from their surroundings through a process known as transformation. Griffith described it initially in Streptococcus pneumoniae. If the cell walls of E.coli are changed, the cells have a greater tendency to absorb the DNA.
Calcium chloride and temperature shock therapy can make the cells competent. Rapidly growing cells can be rendered more competent than cells at other phases of development. Following transformation, the cells may express the acquired genetic information.
As per Future Market Insights (FMI), the competent cells market was approximately 12.8% of the overall USD 2.6 Billion global cell expansion market in 2024. Overall sales of competent cells expanded at a CAGR of 9.9% from 2020 to 2024, on the back of the rising expansion of the healthcare industry.
Increasing adoption of molecular cloned products, recombinant proteins, advancement in molecular cloning research and development with the emergence of new technologies, and numerous government initiatives and government grants available for life science research are the key factors driving industry growth during the forecast period.
Gene therapy can potentially treat a wide range of ailments. The increasing prevalence of cancer, cardiovascular diseases, cystic fibrosis, blood disorders, and immunocompromised cases is rising, which will boost the market in the forecast period. Gene therapy attempts to cure an ailment or enhance your body's capacity to fight disease by replacing a malfunctioning gene or introducing a new gene.
According to World Health Organization (WHO) 2025, cancer is the largest cause of mortality around the globe, accounting for over 2.6 million deaths in 2024, or roughly one in every six. Colon, lung, breast, rectum, and prostate cancers are the most prevalent. Tobacco use, obesity, alcohol consumption, a lack of consumption of fruits and vegetables, and an insufficient level of physical activity account for almost one-third of cancer fatalities.
In addition, cystic fibrosis is a widespread hereditary condition throughout the white population in the USA. The condition affects one in every 2,500 to 3,500 white babies. Cystic fibrosis affects around one in every 17,000 African Americans and 31,000 Asian Americans, as stated by MedlinePlus in 2024. These conditions require gene therapy, which will positively impact the competent cells market. Backed by these aforementioned factors, the global competent cells market is expected to grow at a CAGR of 11.1% during the forecast period.
Favorable Government Initiatives for Gene Therapy Products to Push the Sales
Growth in the market is predicted to surge on the back of favourable initiatives by governments in emerging countries, increasing FDA approval for gene therapy products, and advancements in research and developmental activities. These factors will boost the demand for better technologies, creating a conducive environment in the competent cells market.
Recombinant DNA technology is one of the most commonly used techniques in introducing a specific gene or a healthy gene into a vector. These vectors can be plasmodial, viral, or nanostructured; the latter is the most commonly used because of its efficacy in colonizing cells and incorporating their genetic material.
Recent advances in recombinant DNA synthesis have enabled the effective production of recombinant proteins at industrial sizes with higher yields and lower production costs. This has enabled the development of new treatments, vaccines, and diagnostic reagents.
Certain nutrients are allowed to clone human genes, which reduces the likelihood of unfavourable immune system reactions in patients, allows for the creation of highly specialized, functional, and active proteins, increases productivity and cost-effectiveness, and reduces the possibility of unknown pathogen transmission from animals or humans.
The rising costs of research and developmental activities and stringent regulations in the field might hamper the growth in the forecast period. Competent cells are utilized in molecular cloning procedures, protein expression, and various plasmid DNA-based applications.
However, depending on the transformation method, for instance, developing the E. coli competent cells can be time-consuming, needing exceptionally pure water, high-grade reagents, specified autoclaved glassware, and or even specialized equipment (electroporators).
Numerous protocols available describe the technique and buffers needed to produce competent cells. There are even kits available that include pre-made buffers to expedite this process. Furthermore, it is more expensive to use electroporation.
A specialized apparatus is required to implement the charge, in addition to cuvettes to transport the charge to the cell solution. Excess salt in the cuvette can cause electroporation to fail and result in the loss of valuable samples. The most widely mentioned disadvantage of chemical transformation is its reduced efficiency.
Growing Investment in Gene Cell Therapy Products to Boost the Demand
The USA dominated the North American competent cells market and accounted for nearly 84.8% in 2024. Demand in the market is anticipated to surge on the back of rising investment in gene therapy products. Further, increasing research and development by government bodies, grants, and clinical trials for disease treatment and others, will improve the growth of the competent cells market.
China Competent Cells Market to Benefit from Rising Research & Development for Cloning Efficiency
China held approximately 54.2% share in the East Asia competent cells market in 2024. Demand for competent cells in China will rise at a CAGR of 10.1% during the forecast period. Increasing research activities and grants will propel the competent cells market.
For instance, the Natural Science Foundation of China, the funding by the State Key Laboratory of Microbial Application, and the Qilu Youth Scholar Start-up Funding of SDU, funded a research study on Escherichia coli BW25113 competent cells prepared using a simple chemical method having unmatched transformation and cloning efficiencies, in 2025.
Introduction of Different Strains for Gene Transformation to Propel Sales
As per FMI, the overall sales in the German competent cells market are projected to expand at 9.3% CAGR in the Europe competent cells market during the forecast period. Increasing production activities by manufacturers to develop different types of strains, which allows easy gene transformation, will propel the market. For instance, New England Biolabs GmbH has products specific to cloning & subcloning and strains for protein expression, with each type having quality specifications.
Nearly 7 out of 10 Sales to be Contributed by Chemically Competent Cells
Chemically competent cells are expected to present high growth at a CAGR of 15.3% between 2025 and 2035, with a share of about 67.8% in 2024. Cloning, DNA sequencing, and the creation of DNA libraries are just a few of the many molecular biology techniques that frequently include transformation. Competent cells must be used to perform the transformation. Chemically competent cells hold a bigger market share because chemical transformation is quicker and less error-prone than electroporation.
Cloning Segment to Account for Around 3/5th of Competent Cells Sales
In terms of application, the cloning segment held a revenue share of 57.8% in 2024 and is expected to display steady growth over the forecast period. Competent cells are frequently employed in molecular cloning to increase and preserve cloned DNA in plasmids because they are engineered to absorb foreign DNA from the environment more efficiently. With growing investments in cell and gene therapy, the cloning segment holds a higher market share in terms of application within the overall competent cells market, globally.
Based on end users, the academic research institutes held the highest market share value of 51.2% in 2024. Increasing research and development activities in life sciences are propelling sales of the overall competent cells market.
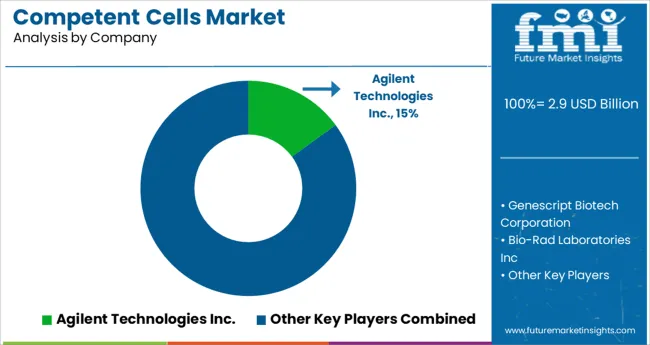
With several competitors in the competent cells market, the overall market is fragmented. To expand their customer base, leading companies are implementing methods such as mergers and acquisitions, partnerships and collaborations, and new product launches.
For instance:
| Attribute | Details |
|---|---|
| Estimated Market Size 2025 | USD 2.9 billion |
| Projected Market Value 2035 | USD 8.3 billion |
| CAGR 2025 to 2035 | 11.1% |
| Forecast Period | 2020 to 2024 |
| Historical Data Available for | 2025 to 2035 |
| Market Analysis | million for Value |
| Key Regions Covered | North America; Latin America; Europe; South Asia; East Asia; Oceania; and Middle East & Africa |
| Key Countries Covered | USA, Canada, Brazil, Mexico, Argentina, UK, Germany, Italy, Russia, Spain, France, BENELUX, India, Thailand, Indonesia, Malaysia, Japan, China, South Korea, Australia, New Zealand, Turkey, GCC Countries, South Africa, and North Africa |
| Key Market Segments Covered | Product, Application, End User, and Region |
| Key Companies Profiled | Agilent Technologies Inc.; Genescript Biotech Corporation; Bio-Rad Laboratories Inc; Merck & Co Inc; OriGene Technologies, Inc; New England Biolabs Inc; Illumina, Inc.; Thermo Fisher Scientific, Inc.,; QIAGEN N.V.,; Zymo Research Corporation; Promega Corporation; HiMedia Laboratories; Avantor, Inc.; Scarab Genomics, LLC; Lucigen; bluebird bio, Inc.; Tonbo Biosciences; TransGen Biotech; Codex DNA, Inc. |
The global competent cells market is estimated to be valued at USD 2.9 billion in 2025.
It is projected to reach USD 8.3 billion by 2035.
The market is expected to grow at a 11.1% CAGR between 2025 and 2035.
The key product types are chemically competent cells and electrocompetent cells.
cloning segment is expected to dominate with a 47.0% industry share in 2025.


Our Research Products

The "Full Research Suite" delivers actionable market intel, deep dives on markets or technologies, so clients act faster, cut risk, and unlock growth.

The Leaderboard benchmarks and ranks top vendors, classifying them as Established Leaders, Leading Challengers, or Disruptors & Challengers.

Locates where complements amplify value and substitutes erode it, forecasting net impact by horizon

We deliver granular, decision-grade intel: market sizing, 5-year forecasts, pricing, adoption, usage, revenue, and operational KPIs—plus competitor tracking, regulation, and value chains—across 60 countries broadly.

Spot the shifts before they hit your P&L. We track inflection points, adoption curves, pricing moves, and ecosystem plays to show where demand is heading, why it is changing, and what to do next across high-growth markets and disruptive tech

Real-time reads of user behavior. We track shifting priorities, perceptions of today’s and next-gen services, and provider experience, then pace how fast tech moves from trial to adoption, blending buyer, consumer, and channel inputs with social signals (#WhySwitch, #UX).

Partner with our analyst team to build a custom report designed around your business priorities. From analysing market trends to assessing competitors or crafting bespoke datasets, we tailor insights to your needs.
Supplier Intelligence
Discovery & Profiling
Capacity & Footprint
Performance & Risk
Compliance & Governance
Commercial Readiness
Who Supplies Whom
Scorecards & Shortlists
Playbooks & Docs
Category Intelligence
Definition & Scope
Demand & Use Cases
Cost Drivers
Market Structure
Supply Chain Map
Trade & Policy
Operating Norms
Deliverables
Buyer Intelligence
Account Basics
Spend & Scope
Procurement Model
Vendor Requirements
Terms & Policies
Entry Strategy
Pain Points & Triggers
Outputs
Pricing Analysis
Benchmarks
Trends
Should-Cost
Indexation
Landed Cost
Commercial Terms
Deliverables
Brand Analysis
Positioning & Value Prop
Share & Presence
Customer Evidence
Go-to-Market
Digital & Reputation
Compliance & Trust
KPIs & Gaps
Outputs
Full Research Suite comprises of:
Market outlook & trends analysis
Interviews & case studies
Strategic recommendations
Vendor profiles & capabilities analysis
5-year forecasts
8 regions and 60+ country-level data splits
Market segment data splits
12 months of continuous data updates
DELIVERED AS:
PDF EXCEL ONLINE
Geocells Market Size and Share Forecast Outlook 2025 to 2035
Pulp Cells Market
Solar Cells and Module Market Report - Trends & Forecast 2025 to 2035
Portable Fuel Cells Market
Polymer Solar Cells Market Growth – Trends & Forecast 2022-2032
Thin Film Solar Cells Market Size and Share Forecast Outlook 2025 to 2035
Modular Palletizer Cells Market Analysis - Size and Share Forecast Outlook 2025 to 2035
Induced Pluripotent Stem Cells Production Market Size and Share Forecast Outlook 2025 to 2035

Thank you!
You will receive an email from our Business Development Manager. Please be sure to check your SPAM/JUNK folder too.
Chat With
MaRIA