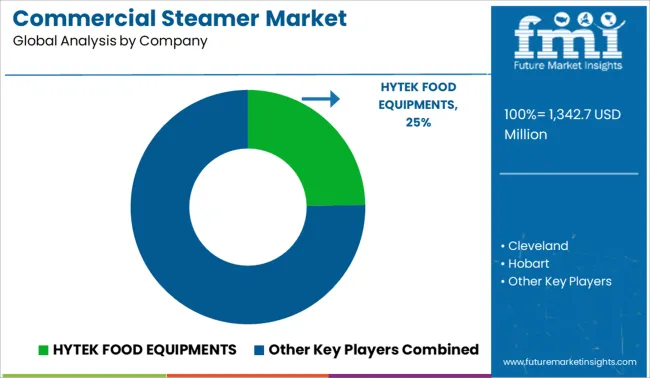
The Commercial Steamer Market is estimated to be valued at USD 1342.7 million in 2025 and is projected to reach USD 1968.5 million by 2035, registering a compound annual growth rate (CAGR) of 3.9% over the forecast period.
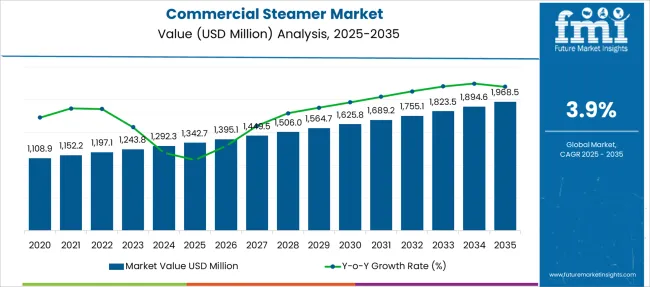
| Metric | Value |
|---|---|
| Commercial Steamer Market Estimated Value in (2025 E) | USD 1342.7 million |
| Commercial Steamer Market Forecast Value in (2035 F) | USD 1968.5 million |
| Forecast CAGR (2025 to 2035) | 3.9% |
The commercial steamer market is expanding steadily due to increasing demand for energy efficient and high volume cooking equipment in the foodservice industry. Rising consumer preference for healthy meals prepared through low fat and nutrient retaining methods has prompted restaurants, institutional kitchens, and catering services to adopt steam cooking solutions.
Regulatory push for environmentally friendly kitchen equipment and the need to optimize kitchen workflows are also contributing to the shift toward commercial steamers. Technological enhancements in temperature control, insulation, and multi mode operations are supporting market adoption across diverse end users.
With commercial kitchens focusing on productivity, consistency, and energy conservation, the future outlook for commercial steamers remains positive as businesses aim to align operations with evolving consumer expectations and sustainability goals.
The market is segmented by Operation Mode, Door Type, Capacity, End User, and Sales Channel and region. By Operation Mode, the market is divided into Gas operated and Electrically operated. In terms of Door Type, the market is classified into Single Door and Double Door. Based on Capacity, the market is segmented into 4 Trays, 6 Trays, 8 Trays, 12 Trays, 24 Trays, and Other Combinations. By End User, the market is divided into Food Service Sector, Food Processors, Institutions, Schools & Universities, Hospitals, Office Spaces, and Others. By Sales Channel, the market is segmented into Offline and Online. Regionally, the market is classified into North America, Latin America, Western Europe, Eastern Europe, Balkan & Baltic Countries, Russia & Belarus, Central Asia, East Asia, South Asia & Pacific, and the Middle East & Africa.
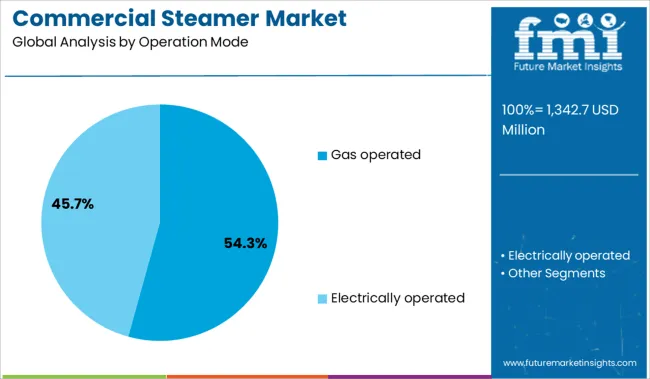
The gas operated segment is expected to contribute 54.30% of total market revenue by 2025 under the operation mode category, making it the dominant segment. This leadership is attributed to its cost efficiency, high heat output, and widespread compatibility with commercial kitchen infrastructure.
Gas operated steamers offer faster cooking cycles and precise temperature control, allowing for consistent food quality in high demand service environments. Their operational cost advantage compared to electric units is particularly valued in regions with lower gas prices.
Furthermore, gas models are favored in establishments where large batch cooking is routine and where operational uptime is critical. These performance and cost benefits have driven their widespread preference in commercial foodservice operations.
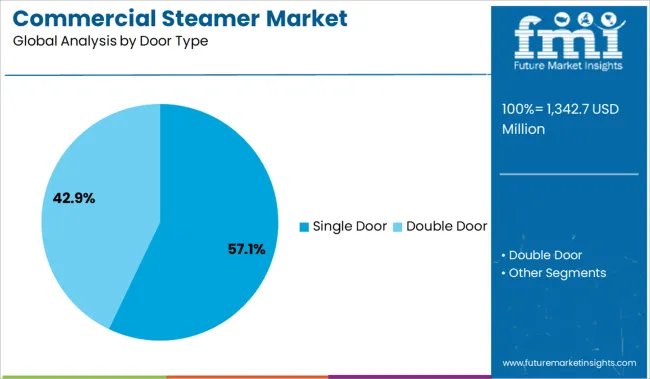
The single door segment is projected to account for 57.10% of total revenue by 2025 within the door type category, positioning it as the leading format. This is due to its compact design, ease of use, and suitability for small to medium volume operations.
Single door steamers are preferred in fast paced kitchens where space efficiency and workflow simplicity are essential. Their accessibility, faster loading and unloading cycles, and energy conservation features make them practical for quick service restaurants and institutional kitchens.
The segment’s prominence is further reinforced by its compatibility with both countertop and floor standing models, enabling flexible deployment across diverse kitchen layouts.
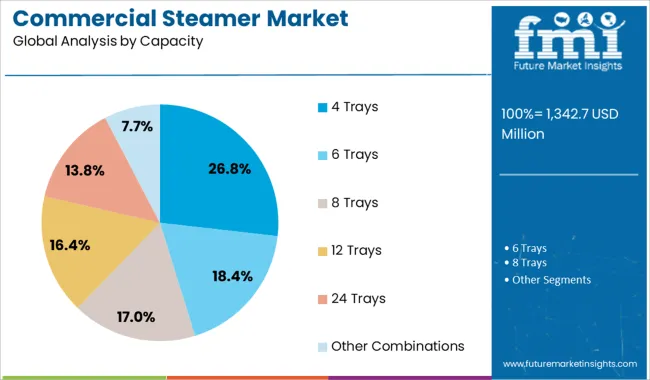
The 4 trays segment is anticipated to hold 26.80% of the overall market revenue by 2025 in the capacity category. Its appeal lies in the balance it offers between cooking volume and equipment footprint, making it ideal for medium throughput kitchens.
This capacity format supports efficient batch cooking while optimizing energy usage and space allocation. It is particularly favored in operations that require consistent output without overinvesting in high capacity models.
The configuration also allows for better portion control and quicker turnaround during peak hours. These operational efficiencies have supported the continued adoption of 4 tray steamers across restaurants, cafes, and catering establishments.
The demand for commercial steamers is growing due to advances in water-saving technologies. Furthermore, commercial steamers are in high demand worldwide due to their ability to produce steam while using less water. Customers are increasingly favoring commercial food steamers since steaming food has health advantages.
The commercial steamer market share is mostly driven by people's growing health consciousness.
Steamed food products are seen to be advantageous as opposed to fried and roasted food items, which raise the risk of ailments, particularly those connected to the heart.
As steamed food items are linked to several health benefits, including improved digestion, the retention of vitamins and minerals that act as antioxidants for the skin, and a reduction in cholesterol production, demand for steamed food products has gradually grown. Food that has been steamed keeps its original taste and nutrients.
Commercial steamers that may quicken the cooking process in kitchens are continuously in demand from food service organizations. This will allow manufacturers to create commercial steamers with new features and enhanced technology that will enable operators to provide steamed food products to clients more quickly.
Electric steamers are more popular than gas steamers because they are more effective, need less upkeep, ventilation, and portability, and they also bring in the most revenue for their producers.
The adoption of cutting-edge goods and systems, such as connectionless food steamers with water-efficient technology, is opening up new market potential for the product. While conventional boiler-based steamers often consume 40 gallons of water per hour, connectionless food steamers typically utilize only one to two gallons per hour.
These devices often consume less energy than conventional steamers since they operate as closed systems and utilize less steam. Additionally, by doing away with the requirement to descale a specific boiler, connectionless steamers can lower maintenance expenses.
Condensation is produced while steaming food in large commercial steamers. A person's negligence might cause the moisture to fall to the floor and provide a sliding risk. Spills should be cleaned up, and the steamer door should be firmly closed.
It is recommended to wait until the steamer is completely cooled before attempting to clean it because the steamer is designed to reach a high temperature. Otherwise, it might result in terrible accidents. Using a steamer improperly might have detrimental effects on your health, including burns and scalds. These constraints limit market expansion.
The electric food steamers market is anticipated to grow at a CAGR of 4.2% during the forecast period. Electric food steamers may be used to prepare a range of oil-free dishes. When it comes to tiny kitchen appliances like electric food steamers, there is a significant market demand for both traditional and electronic food steamers.
For small homes with limited space in the kitchen and affordability due to tight budgets, there are a variety of electric food steamers on the market. Using high-capacity electric food steamers, users may quickly and conveniently prepare various kinds of food (chicken, fish, potatoes, veggies, etc.).
The extensive use of commercial steamers in small family restaurants and hotels for a variety of cooking tasks is due to their powerful electric appliances' ability to ensure even steam distribution from top to bottom.
This results in a significant reduction in the amount of time needed to prepare food while using relatively little electricity. Additionally, the steamers have many cooking settings and two to three steaming pots that may all be used simultaneously for different steamed foods such as momos, veggies, fish, and eggs.
Commercial steamers are becoming more and more popular in both the commercial and household markets due to the idea of reduced fuel usage for small eateries like cafes and restaurants, as well as quick cooking with the convenience of a compact design.
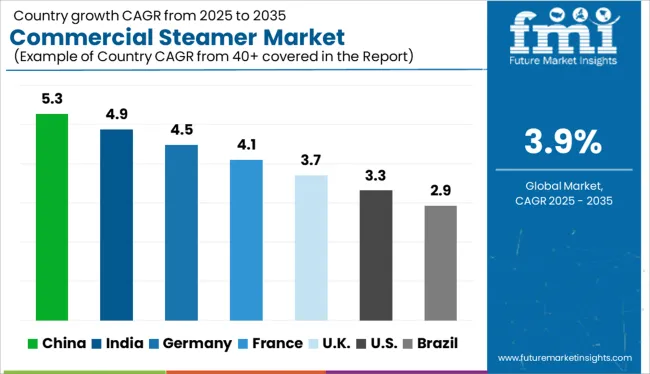
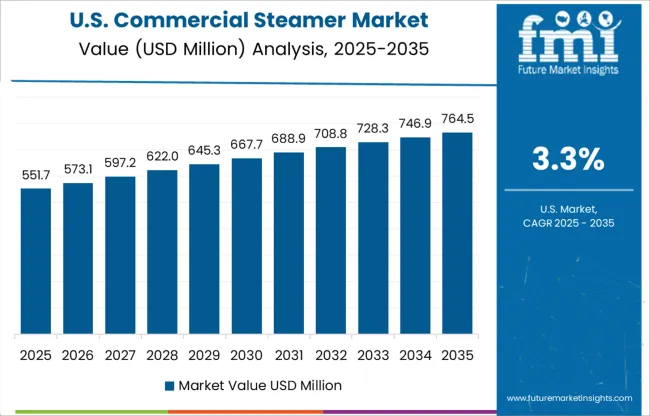
With almost 49% of the market share in terms of sales in 2025, the United States is predicted to dominate the commercial steamers market. The USA is anticipated to hold USD 1968.5 million by 2035, rising at a CAGR of 4.3% from 2025 to 2035. In 2025, North America accounted for a sizable portion of the global commercial steamers market.
Due to the increase in technologically advanced products, strong manufacturing base, adoption of quick and easy cooking methods, and preference by youngsters due to busy schedules in nations like the USA, Canada, Mexico, etc. As a result of these factors, the USA commercial steamers market is expected to grow at a rapid rate, which is likely to drive up sales of commercial steamers shortly.
Due to the region's high net disposable income and rising standards of living in nations like the United Kingdom, France, and Germany, the Europe commercial steamers market is anticipated to develop at a substantial rate throughout the projected period.
Commercial steamers are in high demand in the United Kingdom due to the small household size-driven desire for tiny kitchen appliances. As a result, the United Kingdom commercial steamers market is anticipated to be valued at USD 127.6 million by 2035 and grow at a CAGR of 5.5% during the forecast period. In other European nations, where cooking takes quite a lot of time, electric food steamers are becoming more and more popular.
The Korean commercial steamers market is anticipated to rise at a CAGR of 2.4%, reaching a valuation of USD 45.6 million by 2035. Korean society and economy have undergone significant change as a result of the country's tremendous increases in industrial capacity and expanding consumer spending. Korea is one of the manufacturers of both industrial and consumer goods worldwide.
South Korea is a moderately-growing market for the consumption of goods and services, outperforming other economies by a wide margin. The Korean economy continues to expand at a fast rate, which has been fueled by long-term improvements in industrial output, imports and exports, consumer spending, and capital investment.
Japan's commercial steamer market is anticipated to be valued at USD 114.9 million by 2035, rising at a CAGR of 4.1% throughout the projected period. Since the Japanese government has been pushing industry consolidation to control the sector and boost competitiveness in the global market, rapid consolidation between medium and big businesses is expected.
Japan has benefited from a growing market for manufacturing and distribution, but the sector is suffering from a lack of innovation and investment in Research and Development (R&D) and the creation of new products. Scale economies in the sector have not yet been attained. Most domestic producers lack the autonomous intellectual property and financial means to create items under their namesake brands.
Startups currently face intense rivalry since their clientele and product portfolios are so similar. The expansion of food outlets and restaurant operations is likely to positively impact demand for commercial steamers throughout the forecasted year.
Startups are collaborating with distributors worldwide to provide the largest possible product distribution. This helps them expand the reach of their products as well as their consumer base. The sector is also predicted to gain from growing internet usage in developed and developing countries.
The National Restaurant Show in Chicago, May 21-24, featured the latest customer-driven advancements in kitchen equipment, and the ITW Food Equipment Group is glad to invite experts from the food and hospitality industries to attend.
At the McCormick Center, booths 4031, 4238, and 4242 featured high-performance, energy-efficient commercial kitchen goods and smart technology from manufacturers including Hobart, Traulsen, Baxter, Vulcan, Wolf, Berkel, IBEX, Stero, and Somat. In booth 4238, Vulcan displayed equipment and prepared live meals.
The Hobart HC24EA Series Steamers offer quicker cooking with outstanding outcomes and uptime, taking just eight minutes from first fill to ready. The uptime of the steamers is increased by a new mineral-tolerant steam-generator design. Scale development is further lessened by the generator bottom's 5o slope and the auto-drain JetDrain system.
More than 50% of the world's population now uses the internet, which has increased e-commerce and online sales platforms internationally. On online marketplaces like Walmart and Amazon, as well as business-owned websites, companies are selling technologically advanced commercial steamers, such as commercial steamers with food dehydration technology.
Additionally, consumers are drawn to the numerous deals, specials, discounts, and price points that are offered online. Commercial steamers with advanced features, including an LCD control screen with start/stop, pause, and reheat buttons, as well as pre-programmed meal settings to make cooking simple, have seen an increase in sales.
With its solid encased tubular components (8 kW and 12 kW) embedded in 1-inch-thick cast aluminum for uniform heat distribution, the HC24EO Electric Counter Boilerless/Connectionless Steamer provides your kitchen with extremely efficient steam-generating cooking equipment without any water hookups.
As commercial steamers are used often throughout the day for extended periods, putting additional strain on the machine, commercial steaming demands steamers with great performance and longevity.
Additionally, since the food steamer they employ also cooks sauces, there have been cases where restaurant owners and management distribute free little bottles of ketchup and sauce to patrons. This boosts client contentment while also boosting their reliance on a certain brand, which boosts sales.
During the projected period, major players in the electric food steamer market are anticipated to confront fierce rivalry. Companies with an emphasis on cutting-edge technology include Cuisinart, Hamilton Beach Brands, Inc., Newell Brands, and Nutrite Kitchen, LLC. Additionally, businesses build brand recognition using a variety of marketing techniques, including banners, hoardings, and commercials.
| Attribute | Details |
|---|---|
| Growth Rate | CAGR of 3.9% from 2025 to 2035 |
| Base Year of Estimation | 2025 |
| Historical Data | 2020 to 2025 |
| Forecast Period | 2025 to 2035 |
| Quantitative Units | Revenue in USD million and Volume in Units and F-CAGR from 2025 to 2035 |
| Report Coverage | Revenue Forecast, Volume Forecast, Company Ranking, Competitive Landscape, growth factors, Trends, and Pricing Analysis |
| Key Segments Covered | Operation Mode, Door Type, Capacity, End User, Sales Channel |
| Regions Covered | North America; Latin America; Europe; East Asia; South Asia; Middle East & Africa; Oceania |
| Key Countries Profiled | The USA, Canada, Brazil, Mexico, Germany, Italy, France, The United Kingdom, Spain, Russia, China, Japan, India, GCC Countries, Australia |
| Key Companies Profiled | Vulcan; Cleveland; Hobart; Global Kitchen Equipments Company; Middleby; Blodgett; Southbend; Dover; Falcon Foodservice Equipment; Rational AG |
| Customization & Pricing | Available upon Request |
The global commercial steamer market is estimated to be valued at USD 1,342.7 million in 2025.
The market size for the commercial steamer market is projected to reach USD 1,968.5 million by 2035.
The commercial steamer market is expected to grow at a 3.9% CAGR between 2025 and 2035.
The key product types in commercial steamer market are gas operated and electrically operated.
In terms of door type, single door segment to command 57.1% share in the commercial steamer market in 2025.


Full Research Suite comprises of:
Market outlook & trends analysis
Interviews & case studies
Strategic recommendations
Vendor profiles & capabilities analysis
5-year forecasts
8 regions and 60+ country-level data splits
Market segment data splits
12 months of continuous data updates
DELIVERED AS:
PDF EXCEL ONLINE
Commercial Blast Freezer Market Size and Share Forecast Outlook 2025 to 2035
Commercial Water Heater Market Size and Share Forecast Outlook 2025 to 2035
Commercial High-Speed Oven Market Size and Share Forecast Outlook 2025 to 2035
Commercial Turboprop Aircrafts Market Size and Share Forecast Outlook 2025 to 2035
Commercial Vehicle Foundation Brakes Market Size and Share Forecast Outlook 2025 to 2035
Commercial Vehicle Brake Chambers Market Size and Share Forecast Outlook 2025 to 2035
Commercial Vehicles LED Bar Lights Market Size and Share Forecast Outlook 2025 to 2035
Commercial Vehicle AMT Transmission Market Size and Share Forecast Outlook 2025 to 2035
Commercial Greenhouse Market Size and Share Forecast Outlook 2025 to 2035
Commercial Vessel Market Size and Share Forecast Outlook 2025 to 2035
Commercial Slush Machine Market Size and Share Forecast Outlook 2025 to 2035
Commercial Medium Voltage Distribution Panel Market Size and Share Forecast Outlook 2025 to 2035
Commercial Earth Observation (CEO) Market Size and Share Forecast Outlook 2025 to 2035
Commercial Ozone Generator Market Size and Share Forecast Outlook 2025 to 2035
Commercial Gas-Fired Boiler Market Size and Share Forecast Outlook 2025 to 2035
Commercial Deep Fryer Parts & Accessories Market Size and Share Forecast Outlook 2025 to 2035
Commercial Gas Restaurant Ranges Market Size and Share Forecast Outlook 2025 to 2035
Commercial Heat Pump Market Size and Share Forecast Outlook 2025 to 2035
Commercial Countertop Ranges Market Size and Share Forecast Outlook 2025 to 2035
Commercial Electric Restaurant Ranges Market Size and Share Forecast Outlook 2025 to 2035

Thank you!
You will receive an email from our Business Development Manager. Please be sure to check your SPAM/JUNK folder too.
Chat With
MaRIA