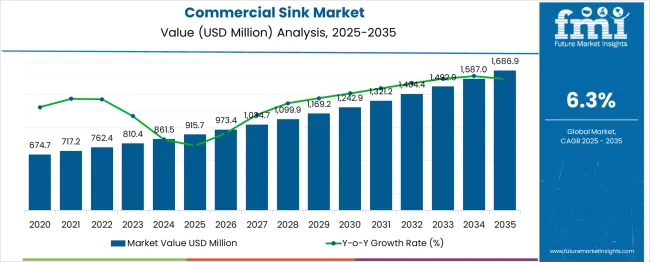
The commercial sink market is anticipated to expand with a healthy CAGR of 6.3% between 2023 and 2033. The market holds a value of US$ 810.4 Million in 2023 while it is expected to cross a value of US$ 1409.2 Million by 2033.
Attributes | Details |
---|---|
Commercial Sink Market Size (2023E) | US$ 810.4 Million |
Commercial Sink Market Projected Size (2033F) | US$ 1409.2 Million |
Value CAGR (2023 to 2033) | 6.3% |
Historic CAGR % (2018 to 2022) | 3.7% |
Stainless commercial sinks are majorly used in restaurants and food outlets to organize the dishwashing process along with getting utilized. The hotels and restaurants include enhanced kitchenware such as advanced commercial sinks. Other than that, the rising number of food outlets that help during the renovation, equipping the kitchen with advanced gear. The innovative sinks come with multi compartments for different dishes and utensils.
Commercial kitchen sinks are also majorly used in the flourishing meat business for washing the meat. The preference depends on whether the sink is destined for home or commercial use, as well as the available space and budget. The source of plumbing for the taps and removal may play a major role.
The sink’s addition adds a cohesive look to the whole kitchen while IoT-enabled kitchen gears shift the dishes directly to the sink while being the bridge between the smart sinks and the other kitchenware. Vendors try to make their sink the best while they work on certain factors that can be discussed further:
The right set of prices with new companies launching their economical commercial sinks to expand their market space and fuel the sales of commercial sinks. This includes discounts on installation charges and on multiple variants of the sink helping it keep an affordable outlet for the end users. The influx of IoT-enabled or smart sinks is also acting as a significant contributor to the industry’s progression. However, the high installation cost of the products may restrict their adoption to some extent.
The versatile and strong base of the new commercial sinks has made it possible for them to carry a huge number of dishes with different compartments to carry various other utensils such as cups, spoons, and various bowls. The stainless steels make it tougher while the unique designs given to the sinks provide it versatility. Businesses are encouraged to use commercial sinks as a result of the integration of new and cutting-edge materials with this problem-solving design.
The restoration of the hotel and restaurant industry along with the automation of most of the business verticals including the kitchen has taken place. New brands also take care of hygiene by providing different tools such as small vipers that clean the sink’s surface and provide it the shine that makes it look new. As a result, the surface is clean, and the large area is surrounded by a sturdy structure and a stand that fits properly.
Don't pay for what you don't need
Customize your report by selecting specific countries or regions and save 30%!
The market during the previous forecast period slowed due to COVID-19. FMCG along with the hospitality sector such as hotels, eateries, and outlets was shut down and the market flourished at a much lower CAGR of 3.7%. This occurred as a result of the lockdown, which was followed by individuals refraining from eating risky outside food to stop the spread of the virus. The high fall in CAGR value results from the complete shutting down of a business to temporarily going out of the funds to renovate or rebuild their business. Though, now with the government support and subsidies along with the high spike in the demand for outside fast food along with the increasing online food demand has finally put the business back on track for the commercial sink vendors.
The major drivers for the commercial sink market are the long list of applications and the rising demand from bars, cafes, restaurants, and hotels. Furthermore, social gatherings such as parties, concerts, and movie shows keep these sinks for serving different kinds of drinks to the end users. The other small-range suppliers who work with medium-scale enterprises in customizing the sink in accordance with their needs can be seen and defined while these verticals can be viewed and understood. The integrated sink holds the fryer and other kitchen equipment for the ease of the chef. Other than this, new and advanced lighting systems with utensil-specific compartments are pushing restaurants to adopt the latest technology including commercial sinks.
Restraints
The biggest factor that hinders the sale of commercial sink systems is the high cost associated with it along with the introduction of cloud kitchen that takes away the whole dining experience with its fast delivery systems. Therefore, not only COVID-19 but new eatery experiences have also hampered the sales of commercial sinks. The application of sustainable disposables is also hindering the demand for commercial sinks.
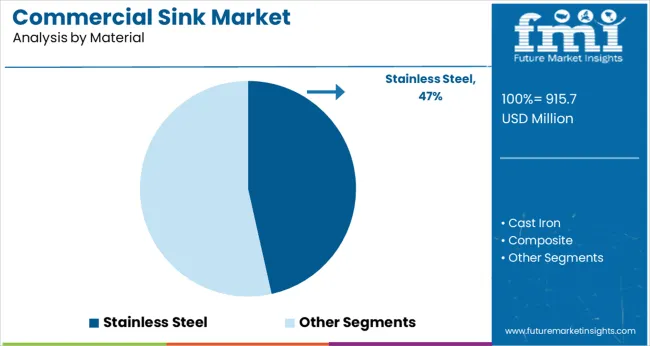
In 2023, the demand for stainless steel sinks is expected to hold the biggest share of 72.6%. The growth is attributed to its durability and easy supply chain. Other than this, Stainless steel makes the sink steady and easily cleanable due to its smooth surface along with its affordable price and easy moldability. The constant flow of water doesn’t let the rust stick in due to the stainless quality of the sink.
The hotel sector consumes most of the commercial sink market as it demands different types of sinks including kitchen sinks and small-scaled restaurants. It holds a share of 37.4% of the global market. The hotels have multiple operation working that requires a huge number of these sinks as every sink from the global market . The hotels have multiple operation working that requires a huge number of these sinks as every sink is used in a different manner.
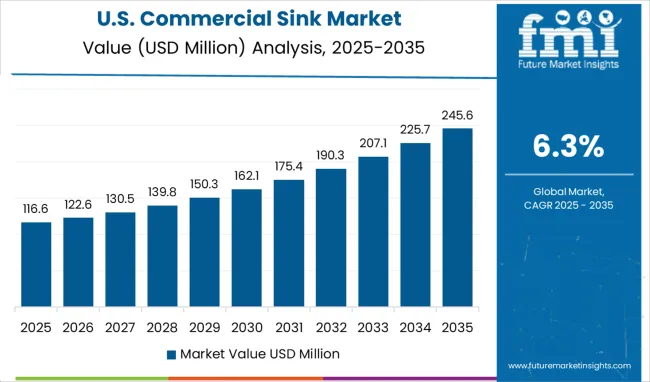
The United States of America holds the largest share of 32.6% in the global market attributed to the higher number of hotels and eateries. The penetration of automated technologies and smart kitchen ideas in the US have fueled the demand for these commercial sinks. The sinks are generally considered one of the important parts of the kitchen as it fastens up the cooking procedures.
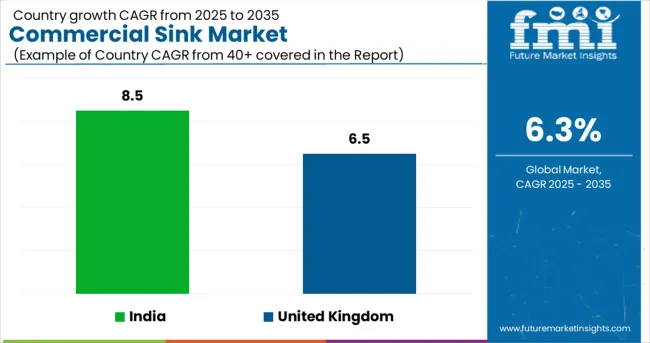
While the United Kingdom is expected to register at a CAGR of 6.5% between 2023 and 2033. The increased number of small-scale eateries and restaurants has fueled the growth of the commercial sink market in the adoption of multi-purpose sinks with customization available, expanding the commercial sink market size.
India becomes the fastest-growing region in the global commercial sink market with an anticipated CAGR of 8.5% between 2023 and 2033. Nation building its healthcare systems and hospitals along with the rising number of hotels and restaurants due to the rising population and tourism has led India to become the fastest growing market in the Asia-Pacific
The UK is expected a healthy CAGR of 6.5% between 2023 and 2033. Setting up more restaurants offering food from every cuisine in the world. These places serve all kinds of international cuisines. As a result, having a commercial sink is essential for doing the dishes and saving effort.
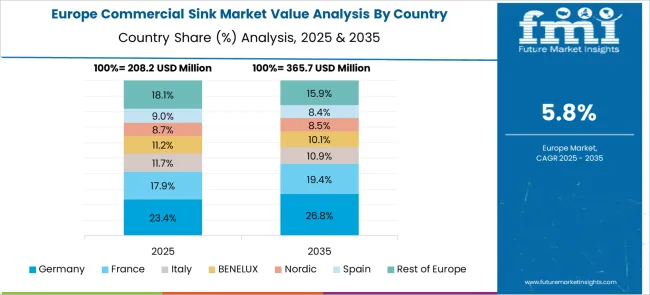
Germany is anticipated to hold a share of 7.1% of the global market. This is attributed to its increasing hotel industry that demands the best kitchenware including multi-purpose sinks, making it one of the prominent markets in the European region. This ultimately fuels the sales of commercial sinks.
Get the data you need at a Fraction of the cost
Personalize your report by choosing insights you need
and save 40%!
Food enthusiasts around the world invest in creating a sustainable solution for hotel and restaurant workers to create a solution for a better dishwashing experience. The use of IoT in smart kitchen ideas is gaining traction in the start-up landscape of the commercial sink market.
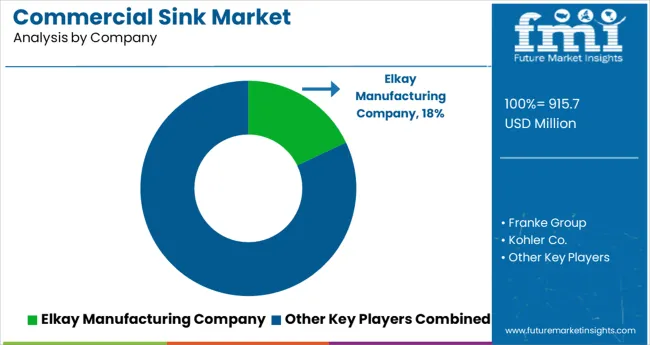
The market includes both international and domestic participants. Key market players focus on strategies such as innovation and new product launches in retail to enhance their portfolios and positioning in the market.
Recent Market Developments:
Swanstone sink co. has come up with a long range of single and double bowl configurations, drop-in and undermount style sinks that fuels the sales of commercial sinks in the global market.
Report Attributes | Details |
---|---|
Commercial Sink Market Size (2023) | US$ 810 Million |
Projected Market Value (2033) | US$ 1409.3 Million |
Global Market Growth Rate (2022 to 2032) | 6.3% CAGR |
USA Market Share (2033) | US$ 32.6% |
UK Market CAGR (2022 to 2033) | 6.5% |
Key Companies Profiled |
|
The global commercial sink market is valued at US$ 810.2 Million in 2023.
Global demand for Commercial sinks is projected to reach US$ 1409 Million by 2033.
The application of commercial sinks is expected to increase at a CAGR of 6.3% through 2032.
The United States of America market for a commercial sink is anticipated to hold a share of 32.6% by 2023.
1. Executive Summary | Commercial Sink Market
1.1. Global Market Outlook
1.2. Demand Side Trends
1.3. Supply Side Trends
1.4. Technology Roadmap
1.5. Analysis and Recommendations
2. Market Overview
2.1. Market Coverage / Taxonomy
2.2. Market Definition / Scope / Limitations
3. Key Market Trends
3.1. Key Trends Impacting the Market
3.2. Product Innovation / Development Trends
4. Key Success Factors
4.1. Product Adoption / Usage Analysis
4.2. Product USPs / Features
4.3. Strategic Promotional Strategies
5. Global Market Demand Analysis 2018 to 2022 and Forecast, 2023 to 2033
5.1. Historical Market Volume (‘000 Units) Analysis, 2018 to 2022
5.2. Current and Future Market Volume (‘000 Units) Projections, 2023 to 2033
5.3. Y-o-Y Growth Trend Analysis
6. Global Market - Pricing Analysis
6.1. Regional Pricing Analysis by Material
6.2. Global Average Pricing Analysis Benchmark
7. Global Market Demand (in Value or Size in US$ Million) Analysis 2018 to 2022 and Forecast, 2023 to 2033
7.1. Historical Market Value (US$ Million) Analysis, 2018 to 2022
7.2. Current and Future Market Value (US$ Million) Projections, 2023 to 2033
7.2.1. Y-o-Y Growth Trend Analysis
7.2.2. Absolute $ Opportunity Analysis
8. Market Background
8.1. Macro-Economic Factors
8.1.1. Global GDP Growth Outlook
8.1.2. Global Economic Outlook
8.1.3. Global Urbanization Growth Outlook
8.1.4. Global Healthcare Industry Outlook
8.1.5. Global HoReCa Industry Growth Outlook
8.1.6. Global Cloud Kitchen Industry Outlook
8.1.7. Commercial Construction Outlook by Region
8.1.8. Other Macro-Economic Factors
8.2. Forecast Factors - Relevance & Impact
8.2.1. GDP Forecast
8.2.2. Key Companies Historical Growth Overview
8.2.3. Impact of regulations
8.2.4. Growth of the Hotel and Restaurant Industry
8.2.5. Product advancements and Innovations
8.2.6. Other Forecast Factors.
8.3. Value Chain
8.3.1. List of Manufacturers
8.3.2. List of Physical Distributors
8.3.3. Trade Margins/Profit Margins
8.4. COVID-19 Crisis - Impact Assessment
8.4.1. Current Statistics
8.4.2. Short-Mid-Long Term Outlook
8.4.3. Likely Rebound
8.5. Market Dynamics
8.5.1. Drivers
8.5.2. Restraints
8.5.3. Opportunity Analysis
9. Global Market Analysis 2018 to 2022 and Forecast 2023 to 2033, By Material
9.1. Introduction / Key Findings
9.2. Historical Market Size (US$ Million) and Volume Analysis By Material, 2018 to 2022
9.3. Current and Future Market Size (US$ Million) and Volume Analysis and Forecast By Material, 2023 to 2033
9.3.1. Stainless Steel
9.3.2. Cast Iron
9.3.3. Composite
9.3.4. Granite/Quartz
9.3.5. Others
9.4. Market Attractiveness Analysis By Material
10. Global Market Analysis 2018 to 2022 and Forecast 2023 to 2033, By Sink Type
10.1. Introduction / Key Findings
10.2. Historical Market Size (US$ Million) and Volume Analysis By Sink Type, 2018 to 2022
10.3. Current and Future Market Size (US$ Million) and Volume Analysis and Forecast By Sink Type, 2023 to 2033
10.3.1. Top Mount
10.3.2. Under Mount
10.3.3. Wall Mount
10.3.4. Flush Mount
10.3.5. Others
10.4. Market Attractiveness Analysis By Sink Type
11. Global Market Analysis 2018 to 2022 and Forecast 2023 to 2033, By Bowl Type
11.1. Introduction / Key Findings
11.2. Historical Market Size (US$ Million) and Volume Analysis by Bowl Type, 2018 to 2022
11.3. Current and Future Market Size (US$ Million) and Volume Analysis and Forecast By Bowl Type, 2023 to 2033
11.3.1. Single
11.3.2. Double
11.3.3. Triple
11.4. Market Attractiveness Analysis By Bowl Type
12. Global Market Analysis 2018 to 2022 and Forecast 2023 to 2033, By End Use
12.1. Introduction / Key Findings
12.2. Historical Market Size (US$ Million) and Volume Analysis By End Use, 2018 to 2022
12.3. Current and Future Market Size (US$ Million) and Volume Analysis and Forecast By End Use, 2023 to 2033
12.3.1. Hotels
12.3.2. Restaurants
12.3.3. Hospitals
12.3.4. Others
12.4. Market Attractiveness Analysis By End Use
13. Global Market Analysis 2018 to 2022 and Forecast 2023 to 2033, by Region
13.1. Introduction
13.2. Historical Market Size (US$ Million) and Volume Analysis by Region, 2018 to 2022
13.3. Current Market Size (US$ Million) and Volume Analysis and Forecast by Region, 2023 to 2033
13.3.1. North America
13.3.2. Latin America
13.3.3. Europe
13.3.4. East Asia
13.3.5. South Asia and Pacific
13.3.6. Middle East and Africa (MEA)
13.4. Market Attractiveness Analysis by Region
14. North America Market Analysis 2018 to 2022 and Forecast 2023 to 2033
14.1. Introduction
14.2. Pricing Analysis
14.3. Historical Market Size (US$ Million) and Volume Trend Analysis by Market Taxonomy, 2018 to 2022
14.4. Market Size (US$ Million) and Volume Forecast by Market Taxonomy, 2023 to 2033
14.4.1. By Country
14.4.1.1. United States of America
14.4.1.2. Canada
14.4.2. By Material
14.4.3. By Sink Type
14.4.4. By Bowl Type
14.4.5. By End Use
14.5. Market Attractiveness Analysis
14.5.1. By Country
14.5.2. By Material
14.5.3. By Sink Type
14.5.4. By Bowl Type
14.5.5. By End Use
14.6. Key Market Participants - Intensity Mapping
14.7. Drivers and Restraints - Impact Analysis
15. Latin America Market Analysis 2018 to 2022 and Forecast 2023 to 2033
15.1. Introduction
15.2. Pricing Analysis
15.3. Historical Market Size (US$ Million) and Volume Trend Analysis by Market Taxonomy, 2018 to 2022
15.4. Market Size (US$ Million) and Volume Forecast by Market Taxonomy, 2023 to 2033
15.4.1. By Country
15.4.1.1. Brazil
15.4.1.2. Mexico
15.4.1.3. Rest of Latin America
15.4.2. By Material
15.4.3. By Sink Type
15.4.4. By Bowl Type
15.4.5. By End Use
15.5. Market Attractiveness Analysis
15.5.1. By Country
15.5.2. By Material
15.5.3. By Sink Type
15.5.4. By Bowl Type
15.5.5. By End Use
15.6. Key Market Participants - Intensity Mapping
15.7. Drivers and Restraints - Impact Analysis
16. Europe Market Analysis 2018 to 2022 and Forecast 2023 to 2033
16.1. Introduction
16.2. Pricing Analysis
16.3. Historical Market Size (US$ Million) and Volume Trend Analysis by Market Taxonomy, 2018 to 2022
16.4. Market Size (US$ Million) and Volume Forecast by Market Taxonomy, 2023 to 2033
16.4.1. By Country
16.4.1.1. Germany
16.4.1.2. Italy
16.4.1.3. France
16.4.1.4. United Kingdom
16.4.1.5. Spain
16.4.1.6. BENELUX
16.4.1.7. Russia
16.4.1.8. Rest of Europe
16.4.2. By Material
16.4.3. By Sink Type
16.4.4. By Bowl Type
16.4.5. By End Use
16.5. Market Attractiveness Analysis
16.5.1. By Country
16.5.2. By Material
16.5.3. By Sink Type
16.5.4. By Bowl Type
16.5.5. By End Use
16.6. Key Market Participants - Intensity Mapping
16.7. Drivers and Restraints - Impact Analysis
17. South Asia and Pacific Market Analysis 2018 to 2022 and Forecast 2023 to 2033
17.1. Introduction
17.2. Pricing Analysis
17.3. Historical Market Size (US$ Million) and Volume Trend Analysis by Market Taxonomy, 2018 to 2022
17.4. Market Size (US$ Million) and Volume Forecast by Market Taxonomy, 2023 to 2033
17.4.1. By Country
17.4.1.1. India
17.4.1.2. ASEAN
17.4.1.3. Australia and New Zealand
17.4.1.4. Rest of South Asia & Pacific
17.4.2. By Material
17.4.3. By Sink Type
17.4.4. By Bowl Type
17.4.5. By End Use
17.5. Market Attractiveness Analysis
17.5.1. By Country
17.5.2. By Material
17.5.3. By Sink Type
17.5.4. By Bowl Type
17.5.5. By End Use
17.6. Key Market Participants - Intensity Mapping
17.7. Drivers and Restraints - Impact Analysis
18. East Asia Market Analysis 2018 to 2022 and Forecast 2023 to 2033
18.1. Introduction
18.2. Pricing Analysis
18.3. Historical Market Size (US$ Million) and Volume Trend Analysis by Market Taxonomy, 2018 to 2022
18.4. Market Size (US$ Million) and Volume Forecast by Market Taxonomy, 2023 to 2033
18.4.1. By Country
18.4.1.1. China
18.4.1.2. Japan
18.4.1.3. South Korea
18.4.2. By Material
18.4.3. By Sink Type
18.4.4. By Bowl Type
18.4.5. By End Use
18.5. Market Attractiveness Analysis
18.5.1. By Country
18.5.2. By Material
18.5.3. By Sink Type
18.5.4. By Bowl Type
18.5.5. By End Use
18.6. Key Market Participants - Intensity Mapping
18.7. Drivers and Restraints - Impact Analysis
19. Middle East and Africa Market Analysis 2018 to 2022 and Forecast 2023 to 2033
19.1. Introduction
19.2. Pricing Analysis
19.3. Historical Market Size (US$ Million) and Volume Trend Analysis by Market Taxonomy, 2018 to 2022
19.4. Market Size (US$ Million) and Volume Forecast by Market Taxonomy, 2023 to 2033
19.4.1. By Country
19.4.1.1. GCC Countries
19.4.1.2. Turkey
19.4.1.3. Northern Africa
19.4.1.4. South Africa
19.4.1.5. Rest of Middle East and Africa
19.4.2. By Material
19.4.3. By Sink Type
19.4.4. By Bowl Type
19.4.5. By End Use
19.5. Market Attractiveness Analysis
19.5.1. By Country
19.5.2. By Material
19.5.3. By Sink Type
19.5.4. By Bowl Type
19.5.5. By End Use
19.6. Key Market Participants - Intensity Mapping
19.7. Drivers and Restraints - Impact Analysis
20. Country-Wise Market Analysis
20.1. Introduction
20.1.1. Market Value Proportion Analysis, By Key Countries
20.1.2. Global Vs. Country Growth Comparison
20.2. USA Market Analysis
20.2.1. By Material
20.2.2. By Sink Type
20.2.3. By Bowl Type
20.2.4. By End Use
20.3. Canada Market Analysis
20.3.1. By Material
20.3.2. By Sink Type
20.3.3. By Bowl Type
20.3.4. By End Use
20.4. Mexico Market Analysis
20.4.1. By Material
20.4.2. By Sink Type
20.4.3. By Bowl Type
20.4.4. By End Use
20.5. Brazil Market Analysis
20.5.1. By Material
20.5.2. By Sink Type
20.5.3. By Bowl Type
20.5.4. By End Use
20.6. Germany Market Analysis
20.6.1. By Material
20.6.2. By Sink Type
20.6.3. By Bowl Type
20.6.4. By End Use
20.7. Italy Market Analysis
20.7.1. By Material
20.7.2. By Sink Type
20.7.3. By Bowl Type
20.7.4. By End Use
20.8. France Market Analysis
20.8.1. By Material
20.8.2. By Sink Type
20.8.3. By Bowl Type
20.8.4. By End Use
20.9.United Kingdom Market Analysis
20.9.1. By Material
20.9.2. By Sink Type
20.9.3. By Bowl Type
20.9.4. By End Use
20.10. Spain Market Analysis
20.10.1. By Material
20.10.2. By Sink Type
20.10.3. By Bowl Type
20.10.4. By End Use
20.11. BENELUX Market Analysis
20.11.1. By Material
20.11.2. By Sink Type
20.11.3. By Bowl Type
20.11.4. By End Use
20.12. Russia Market Analysis
20.12.1. By Material
20.12.2. By Sink Type
20.12.3. By Bowl Type
20.12.4. By End Use
20.13. China Market Analysis
20.13.1. By Material
20.13.2. By Sink Type
20.13.3. By Bowl Type
20.13.4. By End Use
20.14. Japan Market Analysis
20.14.1. By Material
20.14.2. By Sink Type
20.14.3. By Bowl Type
20.14.4. By End Use
20.15. S. Korea Market Analysis
20.15.1. By Material
20.15.2. By Sink Type
20.15.3. By Bowl Type
20.15.4. By End Use
20.16. India Market Analysis
20.16.1. By Material
20.16.2. By Sink Type
20.16.3. By Bowl Type
20.16.4. By End Use
20.17. ASEAN Market Analysis
20.17.1. By Material
20.17.2. By Sink Type
20.17.3. By Bowl Type
20.17.4. By End Use
20.18. Australia and New Zealand Market Analysis
20.18.1. By Material
20.18.2. By Sink Type
20.18.3. By Bowl Type
20.18.4. By End Use
20.19. GCC Countries Market Analysis
20.19.1. By Material
20.19.2. By Sink Type
20.19.3. By Bowl Type
20.19.4. By End Use
20.20. Turkey Market Analysis
20.20.1. By Material
20.20.2. By Sink Type
20.20.3. By Bowl Type
20.20.4. By End Use
20.21. South Africa Market Analysis
20.21.1. By Material
20.21.2. By Sink Type
20.21.3. By Bowl Type
20.21.4. By End Use
20.22. Northern Africa Market Analysis
20.22.1. By Material
20.22.2. By Sink Type
20.22.3. By Bowl Type
20.22.4. By End Use
21. Market Structure Analysis
21.1. Market Analysis by Tier of Companies
21.2. Market Share Analysis of Top Players
21.3. Market Presence Analysis
22. Competition Analysis
22.1. Competition Dashboard
22.2. Competition Benchmarking
22.3. Competition Deep Dive
22.3.1. Elkay Manufacturing Company
22.3.1.1. Overview
22.3.1.2. Product Portfolio
22.3.1.3. Profitability by Market Segments (Product/Channel/Region)
22.3.1.4. Sales Footprint
22.3.1.5. Strategy Overview
22.3.2. Franke Group
22.3.2.1. Overview
22.3.2.2. Product Portfolio
22.3.2.3. Profitability by Market Segments (Product/Channel/Region)
22.3.2.4. Sales Footprint
22.3.2.5. Strategy Overview
22.3.3. Kohler Co.
22.3.3.1. Overview
22.3.3.2. Product Portfolio
22.3.3.3. Profitability by Market Segments (Product/Channel/Region)
22.3.3.4. Sales Footprint
22.3.3.5. Strategy Overview
22.3.4. Blanco GmbH + Co Kg
22.3.4.1. Overview
22.3.4.2. Product Portfolio
22.3.4.3. Profitability by Market Segments (Product/Channel/Region)
22.3.4.4. Sales Footprint
22.3.4.5. Strategy Overview
22.3.5. Swan
22.3.5.1. Overview
22.3.5.2. Product Portfolio
22.3.5.3. Profitability by Market Segments (Product/Channel/Region)
22.3.5.4. Sales Footprint
22.3.5.5. Strategy Overview
22.3.6. Basterfield
22.3.6.1. Overview
22.3.6.2. Product Portfolio
22.3.6.3. Profitability by Market Segments (Product/Channel/Region)
22.3.6.4. Sales Footprint
22.3.6.5. Strategy Overview
22.3.7. Just Manufacturing
22.3.7.1. Overview
22.3.7.2. Product Portfolio
22.3.7.3. Profitability by Market Segments (Product/Channel/Region)
22.3.7.4. Sales Footprint
22.3.7.5. Strategy Overview
22.3.8. Limited
22.3.8.1. Overview
22.3.8.2. Product Portfolio
22.3.8.3. Profitability by Market Segments (Product/Channel/Region)
22.3.8.4. Sales Footprint
22.3.8.5. Strategy Overview
22.3.9. CAM Africa
22.3.9.1. Overview
22.3.9.2. Product Portfolio
22.3.9.3. Profitability by Market Segments (Product/Channel/Region)
22.3.9.4. Sales Footprint
22.3.9.5. Strategy Overview
22.3.10. Ruvati USA
22.3.10.1. Overview
22.3.10.2. Product Portfolio
22.3.10.3. Profitability by Market Segments (Product/Channel/Region)
22.3.10.4. Sales Footprint
22.3.10.5. Strategy Overview
22.3.11. Acrysil Ltd.
22.3.11.1. Overview
22.3.11.2. Product Portfolio
22.3.11.3. Profitability by Market Segments (Product/Channel/Region)
22.3.11.4. Sales Footprint
22.3.11.5. Strategy Overview
22.3.12. Houzer Inc.
22.3.12.1. Overview
22.3.12.2. Product Portfolio
22.3.12.3. Profitability by Market Segments (Product/Channel/Region)
22.3.12.4. Sales Footprint
22.3.12.5. Strategy Overview
22.3.13. MR Direct
22.3.13.1. Overview
22.3.13.2. Product Portfolio
22.3.13.3. Profitability by Market Segments (Product/Channel/Region)
22.3.13.4. Sales Footprint
22.3.13.5. Strategy Overview
22.3.14. Kraus USA
22.3.14.1. Overview
22.3.14.2. Product Portfolio
22.3.14.3. Profitability by Market Segments (Product/Channel/Region)
22.3.14.4. Sales Footprint
22.3.14.5. Strategy Overview
22.3.15. Tasman Sinkware Pty Ltd.
22.3.15.1. Overview
22.3.15.2. Product Portfolio
22.3.15.3. Profitability by Market Segments (Product/Channel/Region)
22.3.15.4. Sales Footprint
22.3.15.5. Strategy Overview
22.3.16. Roca Sanitario, S.A.
22.3.16.1. Overview
22.3.16.2. Product Portfolio
22.3.16.3. Profitability by Market Segments (Product/Channel/Region)
22.3.16.4. Sales Footprint
22.3.16.5. Strategy Overview
22.3.17. Stern-Williams Co. Inc.
22.3.17.1. Overview
22.3.17.2. Product Portfolio
22.3.17.3. Profitability by Market Segments (Product/Channel/Region)
22.3.17.4. Sales Footprint
22.3.17.5. Strategy Overview
22.3.18. Whitehaus Collection
22.3.18.1. Overview
22.3.18.2. Product Portfolio
22.3.18.3. Profitability by Market Segments (Product/Channel/Region)
22.3.18.4. Sales Footprint
22.3.18.5. Strategy Overview
23. Assumptions and Acronyms Used
24. Research Methodology
Explore Process Automation Insights
View Reports