The Commercial Rotisserie Oven Market is estimated to be valued at USD 21.2 billion in 2025 and is projected to reach USD 36.6 billion by 2035, registering a compound annual growth rate (CAGR) of 5.6% over the forecast period.
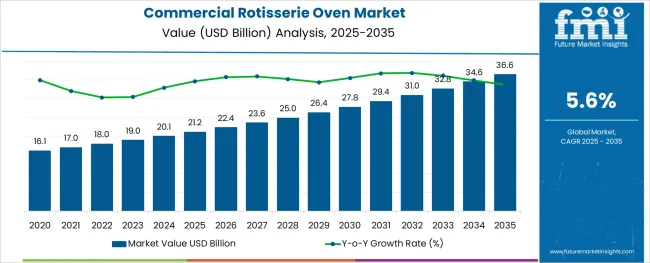
The commercial rotisserie oven market is experiencing sustained growth, shaped by rising consumer demand for freshly prepared roasted foods, evolving dining trends, and advancements in cooking technology. Foodservice operators are increasingly adopting energy-efficient and high-capacity equipment to enhance productivity and improve culinary offerings.
The market is being propelled by the preference for appliances that combine speed, consistency, and visual appeal, which align with customer expectations for quality and transparency in food preparation. Future growth is anticipated to benefit from innovations in temperature control, energy-saving features, and ease of maintenance, which are fostering wider acceptance in varied foodservice formats.
Expanding investments in hospitality infrastructure, coupled with operational efficiencies delivered by modern rotisserie ovens, are creating significant opportunities for manufacturers to address both premium and mid-market segments with differentiated solutions.
The market is segmented by Type and Application and region. By Type, the market is divided into Gas Rotisserie and Coal Rotisserie. In terms of Application, the market is classified into Restaurants, Supermarket, and Others. Regionally, the market is classified into North America, Latin America, Western Europe, Eastern Europe, Balkan & Baltic Countries, Russia & Belarus, Central Asia, East Asia, South Asia & Pacific, and the Middle East & Africa.
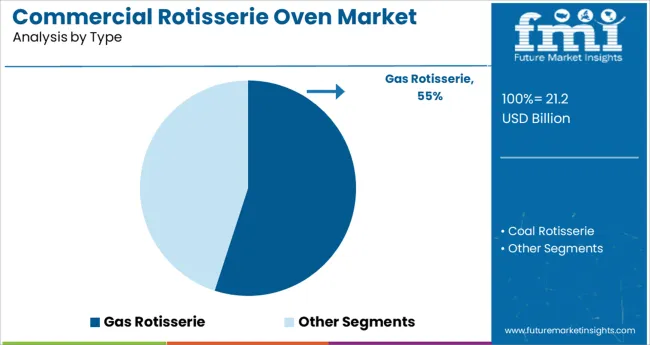
When segmented by type, the gas rotisserie segment is projected to hold 55.0% of the total market revenue in 2025, securing its position as the leading type segment. This leadership is attributed to the segment’s ability to deliver higher cooking efficiency, superior heat distribution, and consistent results, which are essential in high-volume commercial kitchens.
Gas rotisseries have been widely preferred for their faster cooking times and precise control over temperature, enabling operators to meet peak demand periods effectively. The segment’s growth has also been reinforced by the lower operational costs associated with gas usage compared to electricity, alongside the reliability and durability of gas-powered equipment in demanding environments.
Additionally, the capacity to achieve even browning and maintain product moisture while showcasing the cooking process to customers has further enhanced the segment’s desirability among foodservice operators.
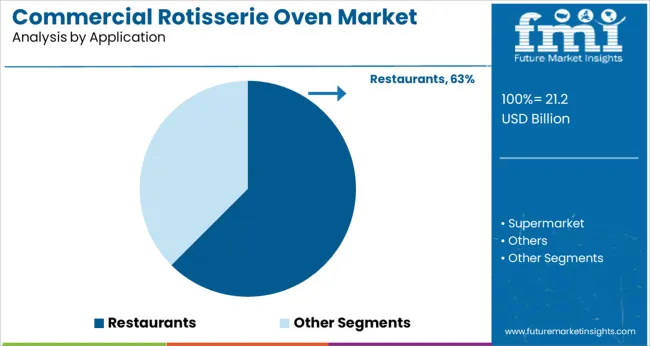
In terms of application, the restaurants segment is expected to command 62.5% of the market revenue in 2025, making it the dominant application segment. This prominence has been driven by restaurants’ emphasis on offering visually appealing and flavorful roasted dishes that enhance customer experience and drive repeat patronage.
The ability of rotisserie ovens to cook large quantities of meat evenly and quickly has aligned well with the operational needs of restaurants managing high customer turnover and maintaining consistent food quality. Furthermore, the open and theatrical cooking display provided by rotisserie ovens has been leveraged by restaurants as a marketing and customer engagement tool, reinforcing their appeal.
Growing consumer preference for freshly cooked, healthier options and the ability of restaurants to customize offerings have further cemented the adoption of commercial rotisserie ovens in this segment, underscoring its leadership in the market.
Between 2020 and 2025, the commercial rotisserie oven market grew steadily. During this time, the market had expanded at a CAGR of 4.7%. Since the market is projected to reach USD 21.2.0 million in 2025, there are likely to be a lot more opportunities during the projection period.
Earlier, the USA commercial rotisserie oven market was growing at 3.8%. With the technology improvement, the region is expected to develop significantly, with a CAGR of 4.9% between 2025 to 2035. However, the future of the business is anticipated to be hampered by rising vegetarian food demand in the USA.
Marketing Strategy of Rotisserie Chicken
The most typical trait of a rotisserie chicken sale is that it is an impulse buy, with the consumer's primary driver being the time and energy saved by not having to spend it preparing.
The simplest explanation for this marketing tactic is that the expected rise in sales of other products especially complements like coleslaw or potato salad included in a bundle package, make up for the negative profit margin for rotisserie chicken sales.
For instance, Costco willfully loses money on rotisserie chickens to boost sales of other goods. These extra goods offer the chance to earn, as their prices are at or above the retail level.
High-profit Margins
One of the main market drivers is the large profit margins associated with the selling of rotisserie chicken, as well as the rising demand for open kitchens in restaurants. A complete rotisserie chicken can bring in an average gross profit of up to USD 3 million for food service operations.
Rising Trend for Vegetarian Meal
As the younger generations become more and more health aware every day, the growing trend of choosing vegetarian meals, which is driven by rising health concerns, is a significant restraint on the growth of the commercial rotisserie oven market.
With a CAGR of 4.9% over the projection period, the gas rotisserie oven category dominates the market. This is because the gas rotisserie oven is widely utilized for commercial reasons since it has a higher capacity and speed for roasting meat than other ovens. However, the coal rotisserie oven segment is anticipated to grow significantly due to the rising demand for barbecue (BBQ) restaurants.
Restaurants have grown rapidly, with a CAGR of 5.9% from 2020 to 2025 and 6.6% from 2025 to 2035. Rotisserie ovens are used in restaurants to roast large amounts of meat at once. Due to the fact that these foods are more nutrient-dense and less greasy than traditional deep-fried dishes, the demand for grilled, roasted, and BBQ food is rising.
Additionally, utilizing a rotisserie oven to cook food saves time and effort, as they are efficient and require no physical labor.
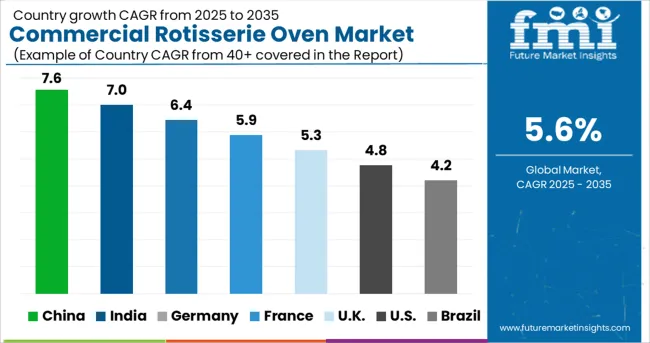
During the forecast period, Asia Pacific, the Middle East, and Africa are likely to experience rapid growth in the commercial rotisserie oven market. Asia-Pacific nations like China and Japan are seeing rapid expansion in the food sector, with a CAGR of 8.1% and 9.9% by 2035.
The USA commercial rotisserie oven market is expected to develop at a CAGR of 4.9% from 2025 to 2035, from a value of USD 21.2 million in 2025 to USD 36.6 million in 2035. The USA economy and increased disposable income are driving up demand for commercial rotisserie ovens.
The adoption of rotisserie ovens is being fueled by the growing number of food enterprises in commercial buildings, including malls, supermarkets, and fast-food restaurants. End users are expanding their meal menu by adding more and more rotisserie alternatives.
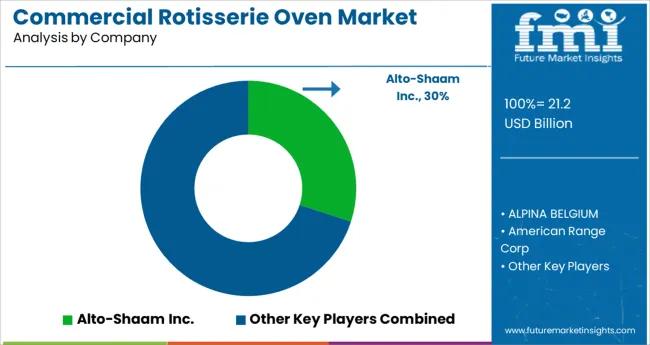
Between 2025 and 2035, this is anticipated to increase demand for commercial rotisserie ovens in North America due to some major key players in the market. Hickory Industries, Alto-Shaam, Henny Penny, and The Vollrath Company are significant players in the USA rotisserie oven market.
Manufacturers like ALTO-Shaam, Rotisol, and Hobart have a long history of innovations to keep their brands competitive in the marketplace.
Commercial rotisserie oven market participants have an established customer base due to their advanced and updated products.
The 21-28 chicken capacity AR-7E Electric Countertop Rotisserie was introduced by Alto-Shaam. Rotisseries draw a lot of customers due to their striking aesthetic appeal. The AR-7E electric rotisserie oven combines high-velocity convection and radiant heating and offers a choice of single or dual-stage cooking to improve cooking efficiency and product finish.
They also unveiled the brand-new self-cleaning rotisserie oven. The primary features include simplified safety and labor savings. Performance is on display in Alto-new Shaam's self-cleaning automatic grease collection rotisserie oven. Reducing labor expenses and increasing return on investment, while turning more output and profit, is the main focus of the company.
Moreover, the newest rotisserie oven from Alto-Shaam, which has features including an automatic grease collecting system, self-cleaning cycle, touchscreen, and programmable controls, is anticipated to be released in 2020. These functions are simple to utilize and assist deli and restaurant workers to save time and labor.
Companies like Rotisol continue to find solutions to make the competition active in the commercial rotisserie oven market. From its cutting-edge production facilities in Chelles, France, Rotisol S.A. has been creating the most stunning and effective rotisseries and catering equipment in the world since 1954. a stand-alone business that has been owned and operated by the same family for over 65 years.
The gas rotisserie is one of the professional cooking tools they provide. It has the benefit of being portable and suitable for market sales. Electric rotisserie is another option; they focus on providing cost-effective models for their functionality.
Commercial rotisserie oven with infrared burners also achieves the necessary temperature with less gas supply, enabling food service operations to save on both fuel and expenses.
For instance, the ML-104858 model commercial rotisserie equipment is available from Hobart and includes two infrared cooking burners, in addition to completely automatic cooking cycles to preserve constant food quality. The introduction of such items is likely to boost market expansion in the upcoming years.
By producing portable items that come in different sizes depending on the needs, commercial rotisserie oven market participants hope to offer top-quality services to the clients.
The global commercial rotisserie oven market is estimated to be valued at USD 21.2 billion in 2025.
It is projected to reach USD 36.6 billion by 2035.
The market is expected to grow at a 5.6% CAGR between 2025 and 2035.
The key product types are gas rotisserie and coal rotisserie.
restaurants segment is expected to dominate with a 62.5% industry share in 2025.


Our Research Products

The "Full Research Suite" delivers actionable market intel, deep dives on markets or technologies, so clients act faster, cut risk, and unlock growth.

The Leaderboard benchmarks and ranks top vendors, classifying them as Established Leaders, Leading Challengers, or Disruptors & Challengers.

Locates where complements amplify value and substitutes erode it, forecasting net impact by horizon

We deliver granular, decision-grade intel: market sizing, 5-year forecasts, pricing, adoption, usage, revenue, and operational KPIs—plus competitor tracking, regulation, and value chains—across 60 countries broadly.

Spot the shifts before they hit your P&L. We track inflection points, adoption curves, pricing moves, and ecosystem plays to show where demand is heading, why it is changing, and what to do next across high-growth markets and disruptive tech

Real-time reads of user behavior. We track shifting priorities, perceptions of today’s and next-gen services, and provider experience, then pace how fast tech moves from trial to adoption, blending buyer, consumer, and channel inputs with social signals (#WhySwitch, #UX).

Partner with our analyst team to build a custom report designed around your business priorities. From analysing market trends to assessing competitors or crafting bespoke datasets, we tailor insights to your needs.
Supplier Intelligence
Discovery & Profiling
Capacity & Footprint
Performance & Risk
Compliance & Governance
Commercial Readiness
Who Supplies Whom
Scorecards & Shortlists
Playbooks & Docs
Category Intelligence
Definition & Scope
Demand & Use Cases
Cost Drivers
Market Structure
Supply Chain Map
Trade & Policy
Operating Norms
Deliverables
Buyer Intelligence
Account Basics
Spend & Scope
Procurement Model
Vendor Requirements
Terms & Policies
Entry Strategy
Pain Points & Triggers
Outputs
Pricing Analysis
Benchmarks
Trends
Should-Cost
Indexation
Landed Cost
Commercial Terms
Deliverables
Brand Analysis
Positioning & Value Prop
Share & Presence
Customer Evidence
Go-to-Market
Digital & Reputation
Compliance & Trust
KPIs & Gaps
Outputs
Full Research Suite comprises of:
Market outlook & trends analysis
Interviews & case studies
Strategic recommendations
Vendor profiles & capabilities analysis
5-year forecasts
8 regions and 60+ country-level data splits
Market segment data splits
12 months of continuous data updates
DELIVERED AS:
PDF EXCEL ONLINE
Commercial Oven Market Size and Share Forecast Outlook 2025 to 2035
Commercial Oven for Bakery Market Size and Share Forecast Outlook 2025 to 2035
Commercial Pizza Oven Market Size and Share Forecast Outlook 2025 to 2035
Commercial Combi Oven Market – Versatile Cooking Innovation 2025-2035
Commercial Tandoor Oven Market Size and Share Forecast Outlook 2025 to 2035
Commercial Air Fryer Oven Market Size and Share Forecast Outlook 2025 to 2035
Commercial Microwave Ovens Market Analysis – Size, Share, and Forecast 2025 to 2035
Commercial High-Speed Oven Market Size and Share Forecast Outlook 2025 to 2035
Commercial Convection Ovens Market Size and Share Forecast Outlook 2025 to 2035
Commercial Baking Rack Oven Market Size and Share Forecast Outlook 2025 to 2035
Commercial and Industrial Rotating Rack Oven Market Size and Share Forecast Outlook 2025 to 2035
Commercial Blast Freezer Market Size and Share Forecast Outlook 2025 to 2035
Commercial Water Heater Market Size and Share Forecast Outlook 2025 to 2035
Oven Bag Market Forecast and Outlook 2025 to 2035
Commercial Turboprop Aircrafts Market Size and Share Forecast Outlook 2025 to 2035
Commercial Vehicle Foundation Brakes Market Size and Share Forecast Outlook 2025 to 2035
Commercial Vehicle Brake Chambers Market Size and Share Forecast Outlook 2025 to 2035
Commercial Vehicles LED Bar Lights Market Size and Share Forecast Outlook 2025 to 2035
Commercial Vehicle AMT Transmission Market Size and Share Forecast Outlook 2025 to 2035
Commercial Greenhouse Market Size and Share Forecast Outlook 2025 to 2035

Thank you!
You will receive an email from our Business Development Manager. Please be sure to check your SPAM/JUNK folder too.
Chat With
MaRIA