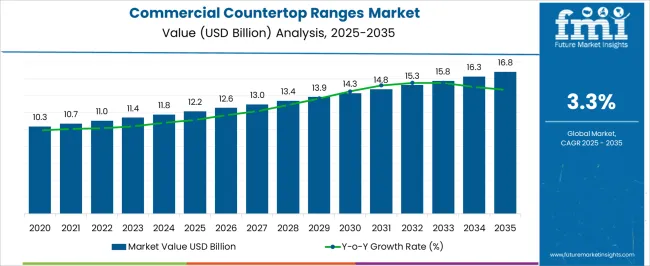
The Commercial Countertop Ranges Market is estimated to be valued at USD 12.2 billion in 2025 and is projected to reach USD 16.8 billion by 2035, registering a compound annual growth rate (CAGR) of 3.3% over the forecast period.
| Metric | Value |
|---|---|
| Commercial Countertop Ranges Market Estimated Value in (2025 E) | USD 12.2 billion |
| Commercial Countertop Ranges Market Forecast Value in (2035 F) | USD 16.8 billion |
| Forecast CAGR (2025 to 2035) | 3.3% |
The commercial countertop ranges market is expanding steadily as foodservice establishments seek compact, efficient, and high performing cooking solutions. Rising demand for modular kitchen equipment in quick service restaurants, cafes, and catering services is driving adoption of countertop ranges.
Increasing urbanization and the growth of small scale commercial kitchens are further strengthening market demand. Manufacturers are focusing on energy efficiency, durability, and compliance with stringent safety standards, which has improved product reliability and operational performance.
Technological enhancements such as precise temperature controls and multifunctional designs are also contributing to wider acceptance. With the ongoing expansion of the hospitality and foodservice industries, the market outlook remains positive as businesses prioritize flexibility, productivity, and space optimization in kitchen operations.
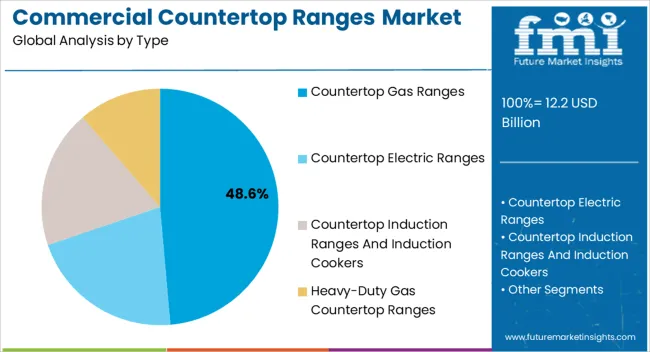
The countertop gas ranges segment is expected to represent 48.60% of market revenue by 2025 within the type category, positioning it as the leading segment. Its growth is driven by the superior heat control and rapid temperature adjustment that gas ranges provide, making them highly preferred in professional kitchens.
Their cost efficiency and compatibility with various cookware types have further supported adoption. In addition, the availability of robust infrastructure for gas supply in commercial establishments has reinforced their dominance.
As operators seek reliable and efficient cooking solutions, countertop gas ranges continue to be the preferred option in foodservice settings.
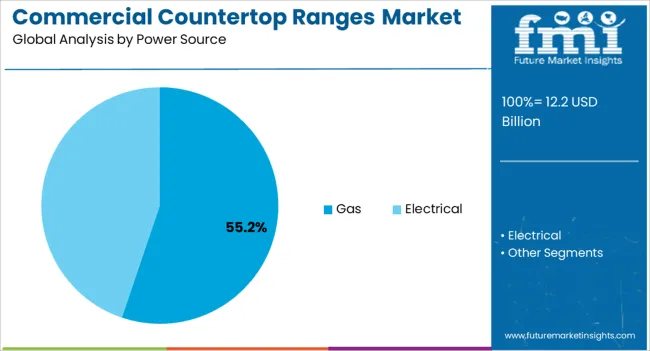
The gas power source segment is projected to hold 55.20% of overall revenue by 2025, making it the most prominent segment under power source. This is largely due to the widespread availability of natural gas and propane in commercial kitchens, as well as the perception of gas powered appliances offering superior cooking performance.
Their ability to deliver immediate heat response and high thermal efficiency has strengthened their role in fast paced foodservice operations.
With lower operating costs compared to some electric alternatives, gas powered ranges remain a cost effective and reliable choice for restaurants and catering services.
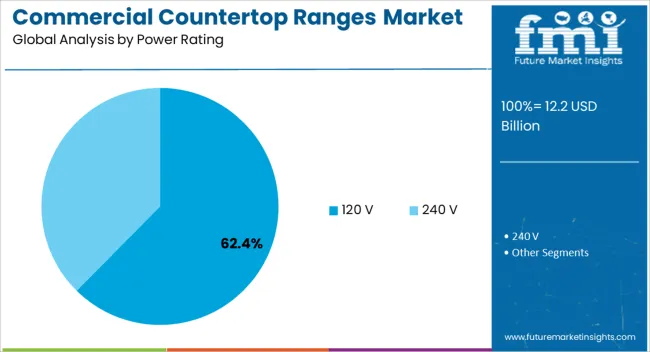
The 120 V power rating segment is forecasted to contribute 62.40% of total revenue by 2025, emerging as the dominant power rating. This growth is supported by its compatibility with standard commercial electrical outlets, allowing for easy installation without the need for additional wiring.
It provides sufficient power output for a wide range of cooking applications while ensuring energy efficiency and safety. The convenience of plug and play installation and suitability for small to mid sized kitchen operations have made this rating the most widely adopted.
As commercial kitchens continue to demand flexible and efficient equipment, the 120 V segment is set to maintain its leading position.
The global demand for Commercial Countertop Ranges is projected to increase at a CAGR of 3.3% during the forecast period between 2025 and 2035, reaching a total of USD 16.8 Billion in 2035, according to a report from Future Market Insights (FMI). From 2020 to 2025, the demand witnessed significant growth, registering a CAGR of 2.4%. According to Future Market Insights, a market research and competitive intelligence provider, the commercial countertop ranges market was valued at USD 12.2.0 Billion in 2025.
The regulations on greenhouse gas emissions, is a major factor that is projected to escalate the market growth in the forthcoming years. Governments have implemented regulations aimed at reducing greenhouse gas emissions in the commercial kitchen equipment market. For instance, in the European Union, the Ecodesign Directive sets requirements for the energy efficiency and environmental performance of commercial kitchen equipment, including countertop ranges.
Moreover, the governments offer financial incentives, such as tax credits or grants, for businesses that purchase energy-efficient commercial kitchen equipment, including countertop ranges. For instance, in the United States, the federal government offers tax credits for businesses that purchase energy-efficient commercial kitchen equipment.
In addition, the governments have also implemented energy efficiency standards for commercial kitchen equipment, including countertop ranges. In the United States, the Department of Energy has established minimum efficiency standards for commercial cooking equipment, including countertop ranges, which must meet certain energy efficiency levels to be sold in the USA market.
Increasing Demand for Energy-Efficient Equipment to Fuel the Market Growth
Energy efficiency has become a significant concern in the commercial kitchen equipment industry. Commercial kitchen equipment is one of the largest consumers of energy in the foodservice industry, and energy costs are a significant expense for restaurants and other foodservice providers. In addition to being costly, energy consumption contributes to greenhouse gas emissions, which can harm the environment. This has led to an increasing demand for energy-efficient commercial kitchen equipment, including commercial countertop ranges.
Energy-efficient commercial countertop ranges can help foodservice providers save money on utility bills while also reducing their environmental impact. Manufacturers are investing in the development of energy-efficient commercial countertop ranges to meet this growing demand from consumers.
These ranges use advanced technologies such as induction heating, infrared heating, and precision temperature control to provide fast and efficient cooking while using less energy than traditional ranges. Additionally, some manufacturers are incorporating smart features into their commercial countertop ranges, allowing operators to monitor energy usage and adjust settings to optimize energy efficiency.
Surging Foodservice Industry to Accelerate the Market Growth
The foodservice industry is experiencing steady growth globally, driven by several factors such as changing lifestyles, increasing disposable income, and the rise of the gig economy. The busy lifestyles of modern consumers have led to an increase in the number of people who eat out or order food for delivery, creating a demand for commercial kitchens and foodservice equipment. As a result, the demand for commercial countertop ranges is expected to increase as well, as these ranges are a critical piece of equipment in any commercial kitchen.
The expansion of the foodservice industry in emerging markets is creating new opportunities for manufacturers of commercial countertop ranges. As more people in these regions adopt Western-style diets and lifestyles, the demand for commercial kitchens and equipment is likely to increase. Additionally, the trend of eating out or ordering food for delivery is catching up in these markets, further increasing the demand for commercial kitchen equipment.
High Cost of Commercial Countertop Ranges to Restrain the Market
The high cost of commercial countertop ranges is one of the significant factors limiting the growth of the market. Commercial countertop ranges are designed for professional use and are built to withstand the rigors of a busy commercial kitchen. As a result, they are made from high-quality materials and are designed to be durable and long-lasting.
However, the use of premium materials and advanced technology increases the cost of manufacturing commercial countertop ranges. This translates to higher prices for end-users, which may deter some customers from purchasing commercial countertop ranges.
In addition, the installation and maintenance costs of commercial countertop ranges can be high, especially if they require specialized electrical or gas connections. As a result, some businesses may opt for cheaper alternatives, such as residential ranges, which may not be as durable or efficient as commercial countertop ranges.
Availability of Alternative Cooking Equipment to Limit the Market Growth
Another factor limiting the growth of the commercial countertop ranges market is competition from alternative cooking equipment. There are several types of cooking equipment available in the market, including convection ovens, griddles, and fryers, which can perform similar functions to commercial countertop ranges. These alternatives may be cheaper, more versatile, or easier to operate than commercial countertop ranges, making them attractive to some foodservice providers.
Additionally, advances in technology have led to the development of innovative cooking equipment, such as sous-vide machines and combi ovens, which can provide more precise temperature control and improve cooking consistency. These alternatives are gaining popularity in the foodservice industry and may further hamper the demand for commercial countertop ranges.
Technological Advancements in North America to Fuel the Market Growth
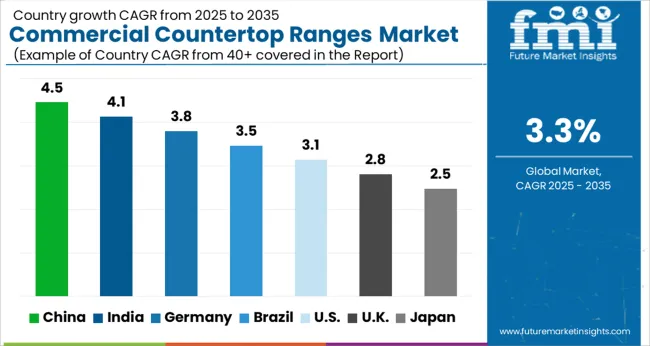
The commercial countertop ranges market in North America is expected to accumulate the highest market share of 43% in 2025. The regional market is highly competitive, and manufacturers are continuously innovating to improve their products' efficiency and functionality. North American manufacturers have been at the forefront of technological advancements in commercial kitchen equipment, including commercial countertop ranges.
For instance, manufacturers in the region are investing in research and development to create energy-efficient countertop ranges that help foodservice establishments save on energy costs. Additionally, manufacturers are incorporating smart features into their products, such as remote monitoring and control, to make them more user-friendly. These technological advancements are likely to sustain North America's dominance in the commercial countertop ranges market.
Furthermore, the demand for energy-efficient commercial kitchen equipment, including commercial countertop ranges, is growing globally. This demand is driven by concerns about environmental sustainability and the need to reduce operating costs.
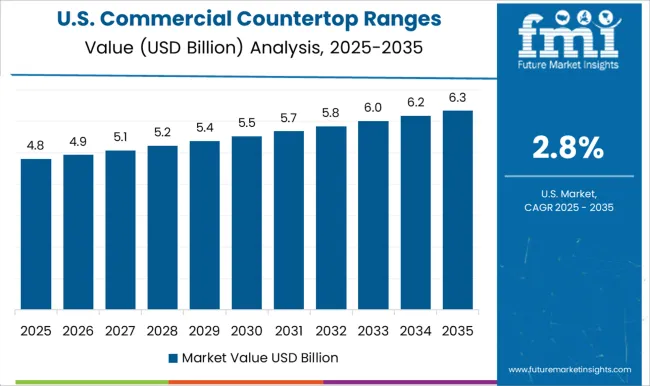
North American manufacturers have been quick to respond to this trend, developing energy-efficient commercial countertop ranges that are compliant with energy efficiency regulations. This focus on energy efficiency is likely to sustain North America's dominance in the commercial countertop ranges market. The United States is expected to hold the highest share of 31.0% during the forecast period.
Rising Awareness Regarding Food Safety & Hygiene in the Region to Fuel the Market Growth
The commercial countertop ranges market in Asia Pacific is expected to accumulate the highest market share of 42% in 2025. Urbanization is a major factor that is driving the regional market. As more people move to cities and urban areas, the demand for foodservice establishments such as restaurants, cafes, and hotels is increasing. This trend is particularly evident in countries such as India and China, where rapid urbanization is fueling the growth of the foodservice industry. As the demand for foodservice establishments grows, there is an increasing need for modern commercial kitchen equipment such as commercial countertop ranges.
Moreover, the awareness of food safety and hygiene is growing in Asia Pacific, driven by factors such as increasing incidences of foodborne illnesses and a growing concern about food quality. As a result, foodservice establishments are investing in modern commercial kitchen equipment to ensure food safety and hygiene.
Commercial countertop ranges are designed to meet the highest standards of food safety and hygiene, making them an attractive option for foodservice establishments that prioritize food safety and hygiene. This trend is expected to drive the growth of the commercial countertop ranges market in Asia Pacific. China held the largest market share of 6.2% in the region.
Countertop Electric Ranges with Standard Oven Segment to beat Competition in Untiring Market
On the basis of type, the global Commercial Countertop Ranges market is dominated by countertop electric ranges segment, which is expected to hold a CAGR of 3.2% over the analysis period. The segment is growing as these ranges offer many benefits over other types of countertop ranges, such as gas or induction. For instance, electric countertop ranges are generally more energy-efficient, easier to install and use, and require less maintenance. Additionally, electric ranges are often preferred in environments where there are restrictions on the use of gas.
Additionally, the increasing adoption of energy-efficient kitchen equipment and the growing demand for convenient and easy-to-use cooking appliances are expected to drive the segmental growth in the near future. Moreover, the increasing number of small and medium-sized food service establishments, particularly in emerging economies, is expected to further boost the demand for commercial countertop ranges, including electric countertop ranges. These factors are likely to contribute to the growth of the commercial countertop ranges market in the forthcoming years.
Restaurants Segment to Drive the Commercial Countertop Ranges Market
Based on the end-user, the restaurants segment is expected to expand at rapid rate of 3.1% CAGR over the analysis period. The segment is growing as the restaurants, particularly small and medium-sized establishments, are one of the major end-users of commercial countertop ranges. Countertop ranges are ideal for restaurants as they take up less space and are more cost-effective compared to larger commercial ranges. Additionally, countertop ranges offer flexibility in terms of placement and usage, allowing restaurants to use them for a variety of cooking tasks.
Furthermore, the increasing number of small and medium-sized restaurants, particularly in emerging economies, is expected to drive the demand for commercial countertop ranges during the forecast period. Moreover, the growing trend of "fast casual" dining, which combines the convenience of fast food with the quality and experience of casual dining, is expected to further fuel the demand for commercial countertop ranges in restaurants. These factors are likely to contribute to the growth of the commercial countertop ranges market in the near future.
Who are the Leading Players in the Commercial Countertop Ranges Market?
Prominent players in the commercial countertop ranges market are Garland/US Range, Vulcan, Wolf, Bakers Pride, Star Manufacturing International, Turbo Air, Globe Food Equipment Company, Southbend, Atosa, Avantco Equipment, Toastmaster, Imperial Commercial Cooking Equipment, American Range, Montague Company, Nemco Food Equipment, Lang Manufacturing, Pitco Frialator, Vollrath Company, Globe Chefmate, and CookTek among others.
| Report Attribute | Details |
|---|---|
| Growth Rate | CAGR of 3.3% from 2025 to 2035 |
| Market Value in 2025 | USD 12.2 billion |
| Market Value in 2035 | USD 16.8 billion |
| Base Year for Estimation | 2025 |
| Historical Data | 2020 to 2025 |
| Forecast Period | 2025 to 2035 |
| Quantitative Units | Revenue in USD Billion and CAGR from 2025 to 2035 |
| Report Coverage | Revenue Forecast, Company Ranking, Competitive Landscape, Growth Factors, Trends, and Pricing Analysis |
| Segments Covered | Type, Power Source, Power Rating, End User, Region |
| Regions Covered | North America; Europe; Asia Pacific; Latin America; Middle East & Africa |
| Key Countries Profiled | United States, Canada, Brazil, Germany, United Kingdom, France, Spain, Italy, China, Japan, South Korea, Thailand, Indonesia, Singapore, Australia, New Zealand, GCC Countries, South Africa, Israel |
| Key Companies Profiled | CookTek; Panasonic Holdings Corporation; The Vollrath Company; Garland Group; Elecpro; APW Wyott; Equipex; True Induction Cookware; Globe Food Equipment Co.; Lincat Limited; Buffalo Cookware; Fisher & Paykel Appliances Limited |
| Report Customization | Available upon Request |
The global commercial countertop ranges market is estimated to be valued at USD 12.2 billion in 2025.
The market size for the commercial countertop ranges market is projected to reach USD 16.8 billion by 2035.
The commercial countertop ranges market is expected to grow at a 3.3% CAGR between 2025 and 2035.
The key product types in commercial countertop ranges market are countertop gas ranges, countertop electric ranges, countertop induction ranges and induction cookers and heavy-duty gas countertop ranges.
In terms of power source, gas segment to command 55.2% share in the commercial countertop ranges market in 2025.


Our Research Products

The "Full Research Suite" delivers actionable market intel, deep dives on markets or technologies, so clients act faster, cut risk, and unlock growth.

The Leaderboard benchmarks and ranks top vendors, classifying them as Established Leaders, Leading Challengers, or Disruptors & Challengers.

Locates where complements amplify value and substitutes erode it, forecasting net impact by horizon

We deliver granular, decision-grade intel: market sizing, 5-year forecasts, pricing, adoption, usage, revenue, and operational KPIs—plus competitor tracking, regulation, and value chains—across 60 countries broadly.

Spot the shifts before they hit your P&L. We track inflection points, adoption curves, pricing moves, and ecosystem plays to show where demand is heading, why it is changing, and what to do next across high-growth markets and disruptive tech

Real-time reads of user behavior. We track shifting priorities, perceptions of today’s and next-gen services, and provider experience, then pace how fast tech moves from trial to adoption, blending buyer, consumer, and channel inputs with social signals (#WhySwitch, #UX).

Partner with our analyst team to build a custom report designed around your business priorities. From analysing market trends to assessing competitors or crafting bespoke datasets, we tailor insights to your needs.
Supplier Intelligence
Discovery & Profiling
Capacity & Footprint
Performance & Risk
Compliance & Governance
Commercial Readiness
Who Supplies Whom
Scorecards & Shortlists
Playbooks & Docs
Category Intelligence
Definition & Scope
Demand & Use Cases
Cost Drivers
Market Structure
Supply Chain Map
Trade & Policy
Operating Norms
Deliverables
Buyer Intelligence
Account Basics
Spend & Scope
Procurement Model
Vendor Requirements
Terms & Policies
Entry Strategy
Pain Points & Triggers
Outputs
Pricing Analysis
Benchmarks
Trends
Should-Cost
Indexation
Landed Cost
Commercial Terms
Deliverables
Brand Analysis
Positioning & Value Prop
Share & Presence
Customer Evidence
Go-to-Market
Digital & Reputation
Compliance & Trust
KPIs & Gaps
Outputs
Full Research Suite comprises of:
Market outlook & trends analysis
Interviews & case studies
Strategic recommendations
Vendor profiles & capabilities analysis
5-year forecasts
8 regions and 60+ country-level data splits
Market segment data splits
12 months of continuous data updates
DELIVERED AS:
PDF EXCEL ONLINE
Commercial Gas Restaurant Ranges Market Size and Share Forecast Outlook 2025 to 2035
Commercial Electric Restaurant Ranges Market Size and Share Forecast Outlook 2025 to 2035
Commercial and Industrial Rotating Rack Oven Market Size and Share Forecast Outlook 2025 to 2035
Commercial Baking Rack Oven Market Size and Share Forecast Outlook 2025 to 2035
Commercial Blast Freezer Market Size and Share Forecast Outlook 2025 to 2035
Commercial Water Heater Market Size and Share Forecast Outlook 2025 to 2035
Commercial High-Speed Oven Market Size and Share Forecast Outlook 2025 to 2035
Commercial Turboprop Aircrafts Market Size and Share Forecast Outlook 2025 to 2035
Commercial Vehicle Foundation Brakes Market Size and Share Forecast Outlook 2025 to 2035
Commercial Vehicle Brake Chambers Market Size and Share Forecast Outlook 2025 to 2035
Commercial Vehicles LED Bar Lights Market Size and Share Forecast Outlook 2025 to 2035
Commercial Vehicle AMT Transmission Market Size and Share Forecast Outlook 2025 to 2035
Commercial Greenhouse Market Size and Share Forecast Outlook 2025 to 2035
Commercial Vessel Market Size and Share Forecast Outlook 2025 to 2035
Commercial Slush Machine Market Size and Share Forecast Outlook 2025 to 2035
Commercial Medium Voltage Distribution Panel Market Size and Share Forecast Outlook 2025 to 2035
Commercial Earth Observation (CEO) Market Size and Share Forecast Outlook 2025 to 2035
Commercial Ozone Generator Market Size and Share Forecast Outlook 2025 to 2035
Commercial Gas-Fired Boiler Market Size and Share Forecast Outlook 2025 to 2035
Commercial Deep Fryer Parts & Accessories Market Size and Share Forecast Outlook 2025 to 2035

Thank you!
You will receive an email from our Business Development Manager. Please be sure to check your SPAM/JUNK folder too.
Chat With
MaRIA