The Commercial Beverage Dispenser Market is estimated to be valued at USD 1029.2 million in 2025 and is projected to reach USD 1860.7 million by 2035, registering a compound annual growth rate (CAGR) of 6.1% over the forecast period.
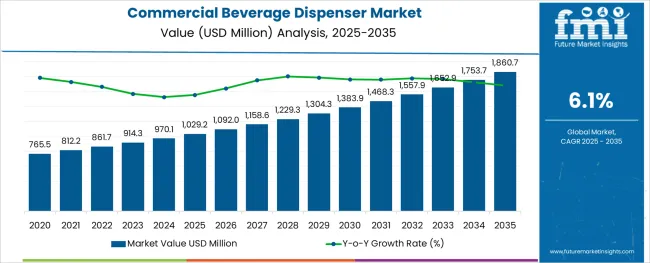
The commercial beverage dispenser market is witnessing sustained growth as foodservice operators, hospitality chains, and institutional buyers prioritize efficiency, hygiene, and customer experience in beverage service. Rising demand for self-service solutions and premium beverage offerings has been observed as a key driver of adoption across quick service restaurants, cafes, and event venues.
Industry trends indicate a shift towards durable, easy-to-clean materials and energy-efficient designs, which are enabling longer equipment lifecycles and reduced operational costs. Future expansion of the market is expected to be supported by evolving consumer expectations for variety and speed of service, combined with technological innovations in cooling mechanisms and portion control.
The integration of modern aesthetics with functional reliability is paving the way for further penetration of advanced dispensers, creating opportunities for manufacturers to address both high-volume and niche applications.
The market is segmented by Base Material, Dispenser Style, Type, Beverage Type, and End-user and region. By Base Material, the market is divided into Metallic, Glass and Acrylic, Polycarbonate, and Other Base Materials. In terms of Dispenser Style, the market is classified into Push Button and Lever. Based on Type, the market is segmented into Countertop and Drop-in. By Beverage Type, the market is divided into Non-alcoholic and Alcoholic. By End-user, the market is segmented into Hotels & Restaurants, Home, Cafes & Bars, and Others. Regionally, the market is classified into North America, Latin America, Western Europe, Eastern Europe, Balkan & Baltic Countries, Russia & Belarus, Central Asia, East Asia, South Asia & Pacific, and the Middle East & Africa.
The market is segmented by Base Material, Dispenser Style, Type, Beverage Type, and End-user and region. By Base Material, the market is divided into Metallic, Glass and Acrylic, Polycarbonate, and Other Base Materials. In terms of Dispenser Style, the market is classified into Push Button and Lever. Based on Type, the market is segmented into Countertop and Drop-in. By Beverage Type, the market is divided into Non-alcoholic and Alcoholic. By End-user, the market is segmented into Hotels & Restaurants, Home, Cafes & Bars, and Others. Regionally, the market is classified into North America, Latin America, Western Europe, Eastern Europe, Balkan & Baltic Countries, Russia & Belarus, Central Asia, East Asia, South Asia & Pacific, and the Middle East & Africa.
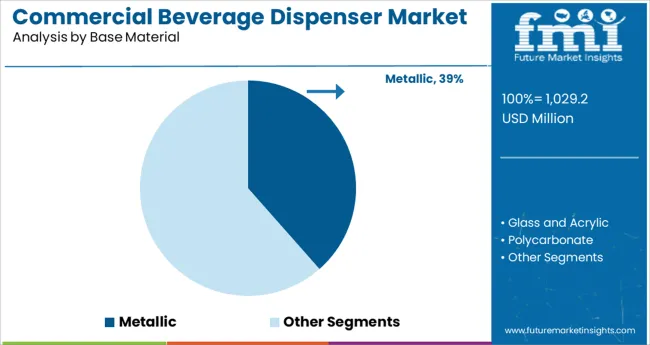
When segmented by base material, the metallic segment is projected to hold 38.5% of the total market revenue in 2025, maintaining a strong presence within the market. This position has been supported by the durability, robustness, and premium appearance of metallic dispensers, which align with the operational needs of high-traffic foodservice environments.
Metallic materials have been favored for their resistance to corrosion, ease of sanitization, and ability to withstand frequent use, making them particularly suitable for institutional and commercial settings where reliability is critical. The perception of metallic units as a long-term investment due to their extended lifespan and lower maintenance requirements has further reinforced their preference among buyers.
Additionally, manufacturers have enhanced the design appeal of metallic dispensers through finishes and ergonomic features, contributing to their continued demand.
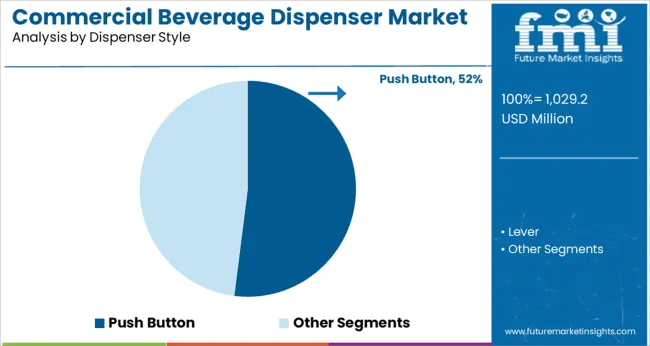
In terms of dispenser style, the push button segment is expected to account for 52.0% of market revenue in 2025, emerging as the leading style. This segment’s leadership has been reinforced by its ease of use, hygienic operation, and ability to regulate portion control effectively in self-service scenarios.
Push button mechanisms have been widely adopted in fast-paced environments where minimizing spillage and ensuring consistency are operational priorities. The design simplicity of this style has allowed for seamless integration with modern aesthetics while offering a user-friendly interface that accommodates a wide range of consumers.
Additionally, the push button style has been preferred due to its compatibility with automated features, such as temperature and portion settings, further increasing its appeal to commercial operators seeking efficient and reliable solutions.
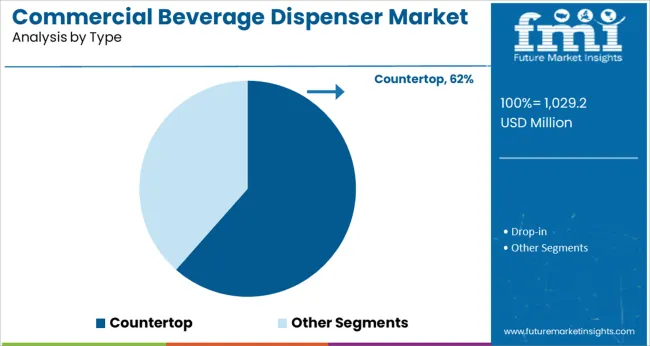
Segmenting by type reveals that the countertop segment is projected to capture 61.5% of the market revenue in 2025, establishing itself as the dominant type. This prominence has been underpinned by the space-saving design, flexibility, and ease of installation offered by countertop dispensers, which suit the layout constraints of diverse commercial spaces.
Countertop models have been particularly valued for their mobility and adaptability, allowing operators to reposition them as needed without major infrastructure changes. The ability of these units to deliver high performance in compact formats has made them a preferred choice for cafes, small restaurants, and event setups where floor space is at a premium.
Manufacturers have also enhanced the functionality of countertop dispensers by incorporating advanced cooling and dispensing technologies, further solidifying their leadership in the market.
As the urban population has risen, so has the use of commercial beverage dispensers. Due to the expansion of urban regions and the evolution of the industry, more bars, hotels, restaurants, fast food joints, pizzerias, snack shops, and other businesses have arisen.
People are now spending more on meals and leisure activities as a result of their increased discretionary income. Furthermore, with the use of self-cleaning technology, some commercial beverage dispensers may now be automatically cleaned after dispensing a predetermined quantity of drinks or glasses.
Several automated gadgets that enable customers to direct the machine to administer the drink on its own have been installed due to technological advancements and the aim to lessen dependence. The market for commercial beverage dispensers is changing quickly as it adopts digital techniques and tools to enhance elements like food and worker safety.
To do this, however, highly qualified personnel must be readily available to utilize the equipment that is already in place. Additionally, automatic commercial beverage dispensers are more expensive to install and maintain than traditional ones, resulting in a longer payback time that may slow market expansion in the forecast period.
| Attribute | Details |
|---|---|
| Commercial Beverage Dispenser Market Estimated Size (2025) | USD 914.3 million |
| Commercial Beverage Dispenser Market CAGR (2025 to 2035) | 6.1% |
| Commercial Beverage Dispenser Market Forecasted Size (2035) | USD 1,700 million |
According to FMI, the expansion of the commercial beverage dispenser market is anticipated to be accelerated by the increase in convenience shops, shopping centers, and recreational areas. Additionally, commercial beverage dispenser equipment manufacturers are anticipated to see significant development potential due to emerging aspects like eco-friendly cooking, smart kitchens, and IoT embedment.
Market expansion is likely to be facilitated by manufacturers implementing effective tactics to boost profitability, consumer traffic, and customer relationships. The degree of device integration is more important for improving chances for in-store efficiency by pricing all-in-one solutions. Customers rely on self-service technologies to speed up the checkout process.
The large initial investment is a significant obstacle for retail operators and lowers the adoption rate of commercial beverage dispensers despite the significant benefits in terms of optimal performance, resource usage, productivity, and return on investment. This is especially felt in small and expanding enterprises, which may force suppliers to rely more on packaged and all-natural beverages than dispensed categories. Additionally, the ongoing expenditures for repair, replacement, and maintenance add to the burden of widespread installation in the retail space.
Due to its longevity, metal is by far the dominating material category in the market. Features like robust and safe interactions with the beverage have helped the market's expansion over the years. The type is especially well-liked for its adaptable design features, which provide an exquisite aesthetic and appealing appearance. The main component of its revenue-generating drop-ins and countertops is made of this material.
Only a significant number of vendors have used beverage dispensers made of glass, acrylic, polycarbonate, or polyurethane. By giving the dispenser a more expensive appearance, they frequently improve its aesthetic appeal and foster consumer confidence.
The sales of alcoholic beverages are increasing as a result of the rising demand for beer, wine, and black spirits. Additionally, it is projected that throughout the projection period, the popularity of pubs, taverns, and restaurants is likely to spur market expansion. The major driver of the sector is the rising popularity of beers' distinctive tastes as digestive aids. The market is anticipated to have an opportunity to capitalize on the rising demand for value-added hard seltzer products at competitive prices.
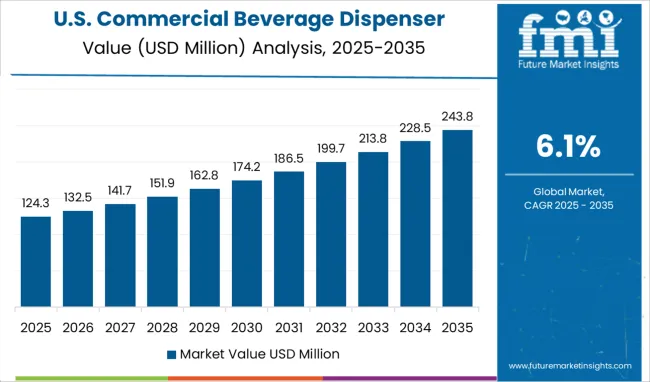
North America is one of the major markets for commercial beverage dispensers. The demand for commercial beverage dispensers in the area is anticipated to increase as a result of the need for flexibility in beverage consumption, technological advancements, and rising demand for frozen beverages. Particularly among consumers between the ages of 30-44 and 45-60, carbonated soft drinks are more prevalent among baby boomers.
Where consumers look for diverse and practical solutions, there is a significant opportunity for restaurant industry growth in Canada. In areas where demand is anticipated to increase significantly over the next several years, such as Ontario, British Columbia, and Alberta, pay increases may be more pronounced.
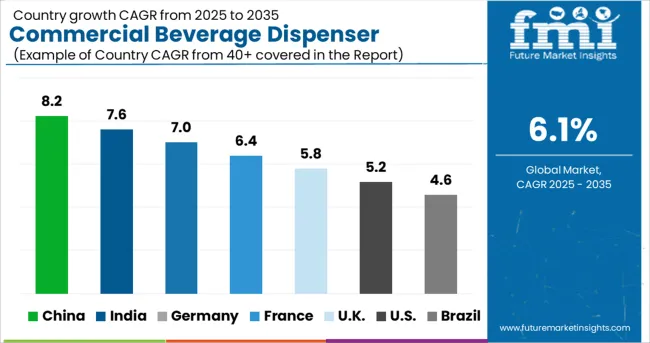
The market for commercial beverage dispensers in the United Kingdom is anticipated to see the second-fastest CAGR of 5.9% from 2025 to 2035. Due to the increased demand for drinks, including alcoholic beverages, carbonated beverages, and fruit juices throughout Europe, the United Kingdom's commercial beverage dispenser industry is predicted to be valued at USD 80.6 million during the projection period.
Improvements in the living standards of people living in Europe's growing countries, together with increased incomes among the local populace, are expected to drive the expansion of the commercial beverage dispenser market over the forecast period.
During the forecast period, the market for commercial beverage dispensers in Korea is anticipated to expand at a significant CAGR of 6.5% from 2025 to 2035. Drive-thrus are the latest sensation that is driving the commercial beverage dispenser industry in South Korea. The South Kore market is anticipated to be valued at USD 119.6 million by 2035. Even major QSR chains such as McDonald’s have more than 250 locations, meaning one in every six outlets operates through drive-thru business models.
Similarly, coffee shops are the latest trend where Starbucks has over 200 outlets accounting for 15% of its total outlets. It is also estimated that the peak hours for the coffee are between 12 pm -1 pm, where operational efficiency is more crucial. Hence, commercial beverage dispensers are highly preferred for maintaining productivity during these hours.
In terms of the global market for commercial beverage dispensers, Japan is anticipated to grow at a CAGR of 5.9% from 2025 to 2035. Strong economic growth is the main factor causing the region's expansion. As a result, Japan market is anticipated to be valued at USD 149.6 million by 2035. Rising disposable income, an increase in women workers, advantageous real estate investments, and the rise of middle-class society all foster the development of technology reliance and devices like commercial beverage dispensers.
The market for commercial beverage dispensers is changing quickly as it adopts digital techniques and tools to enhance elements like food and worker safety. To do this, startups are recruiting highly qualified personnel to utilize the equipment that is already in place. Due to their ability to reduce costs, startups in the industry are concentrating on developing energy-efficient and low-power consumption equipment.
The TIDAL forward osmosis (FO) technology was introduced in April 2020 by Koch Membrane Systems, a developer of cutting-edge membrane filtering systems. This technology is intended for use in the food, beverage, and life science industries. The cutting-edge technology allows for heat-free product concentration. Customers choose self-service devices because they save time and guarantee better, more reliable services. Dispensers prove to be lucrative and cost-effective equipment that can replace employees and save supplementary costs.
A new technology for cold-extracted vegetable and fruit juices, READYGo FVP, was introduced by JBT Corporation in June 2020. The device states that it can extract juice from up to 5 tonnes of raw stuff each hour. A new Indigo NXT model is offered by Manitowoc, the IT0300.
A deal between Celli Group and Cornelius Beverage Technologies Ltd. has been closed, according to a press release, for the acquisition of a range of beer dispensing equipment and accessories in the United Kingdom, Germany, and other European nations. Vendors are strongly advised to tailor their offers depending on demographic behavior, region, individual tastes, and foot traffic. The expansion of dispensers in the QSR market has been aided by the rise of ghost kitchens, food trucks, and online delivery services.
To increase the penetration rate, vendors are also focusing on new co-working spaces, shopping centers, and movie theatres that are undergoing renovations. Store owners' purchasing decisions may be significantly impacted by the development of clever energy-saving and expandability choices, IoT capabilities for remote help, and additional canister alternatives. The sector is anticipated to survive in the competitive market despite being gradually replaced by automated and semi-automatic versions since it provides a significant possibility for differentiation with a nostalgic approach.
Miso Robotics and Lancer Worldwide partnered in June 2024 to bring automated beverage dispensers to the quick-service restaurant sector. Some of the factors impacting the adoption rate include multiple unit installations, affordability, less environmental impact, constant beverage quality, choices for 360-degree marketing, and mobility. The market sector is projected to expand since it requires less cleaning, which means little money is spent on repairs and replacements.
To increase the penetration rate, vendors are also focusing on new co-working spaces, shopping centers, and movie theatres that are undergoing renovations. Store owners' purchasing decisions may be significantly impacted by the development of clever energy-saving and expandability choices, IoT capabilities for remote help, and additional canister alternatives.
With a sizable number of manufacturers, the commercial beverage dispenser industry is quite fragmented. The major businesses are also considering market growth plans to expand their reach internationally through mergers and acquisitions. However, suppliers need to differentiate their products more for technology, design, energy efficiency, and IoT integration to compete in the market.
Environmentally friendly disposable cups may play a significant role in the additional features as demand for sustainable and eco-friendly products increases. In a similar vein, machines with minimal power requirements and high energy efficiency are chosen for their ability to save costs.
Some of the Key Players Operating in the Commercial Beverage Dispenser Market Include:
| Attribute | Details |
|---|---|
| Growth Rate | CAGR of 6.1% from 2025 to 2035 |
| Base Year of Estimation | 2025 |
| Historical Data | 2020 to 2025 |
| Forecast Period | 2025 to 2035 |
| Quantitative Units | Revenue in million and Volume in Units and F-CAGR from 2025 to 2035 |
| Report Coverage | Revenue Forecast, Volume Forecast, Company Ranking, Competitive Landscape, growth factors, Trends, and Pricing Analysis |
| Key Segments Covered | Base Material, Dispenser Style, Type, Beverage Type, End User, Region |
| Regions Covered | North America; Latin America; Europe; East Asia; South Asia; Middle East & Africa; Oceania |
| Key Countries Profiled | The USA, Canada, Brazil, Mexico, Germany, Italy, France, The United Kingdom, Spain, Russia, China, Japan, India, GCC Countries, Australia |
| Key Companies Profiled | Santos; Bunn; Grindmaster Cecilware; Taylor; Avantco Equipment |
| Customization & Pricing | Available upon Request |
The global commercial beverage dispenser market is estimated to be valued at USD 1,029.2 million in 2025.
It is projected to reach USD 1,860.7 million by 2035.
The market is expected to grow at a 6.1% CAGR between 2025 and 2035.
The key product types are metallic, glass and acrylic, polycarbonate and other base materials.
push button segment is expected to dominate with a 52.0% industry share in 2025.


Full Research Suite comprises of:
Market outlook & trends analysis
Interviews & case studies
Strategic recommendations
Vendor profiles & capabilities analysis
5-year forecasts
8 regions and 60+ country-level data splits
Market segment data splits
12 months of continuous data updates
DELIVERED AS:
PDF EXCEL ONLINE
Commercial Blast Freezer Market Size and Share Forecast Outlook 2025 to 2035
Commercial Water Heater Market Size and Share Forecast Outlook 2025 to 2035
Commercial High-Speed Oven Market Size and Share Forecast Outlook 2025 to 2035
Commercial Turboprop Aircrafts Market Size and Share Forecast Outlook 2025 to 2035
Commercial Vehicle Foundation Brakes Market Size and Share Forecast Outlook 2025 to 2035
Commercial Vehicle Brake Chambers Market Size and Share Forecast Outlook 2025 to 2035
Commercial Vehicles LED Bar Lights Market Size and Share Forecast Outlook 2025 to 2035
Commercial Vehicle AMT Transmission Market Size and Share Forecast Outlook 2025 to 2035
Commercial Greenhouse Market Size and Share Forecast Outlook 2025 to 2035
Commercial Vessel Market Size and Share Forecast Outlook 2025 to 2035
Commercial Slush Machine Market Size and Share Forecast Outlook 2025 to 2035
Commercial Medium Voltage Distribution Panel Market Size and Share Forecast Outlook 2025 to 2035
Commercial Earth Observation (CEO) Market Size and Share Forecast Outlook 2025 to 2035
Commercial Ozone Generator Market Size and Share Forecast Outlook 2025 to 2035
Commercial Gas-Fired Boiler Market Size and Share Forecast Outlook 2025 to 2035
Commercial Deep Fryer Parts & Accessories Market Size and Share Forecast Outlook 2025 to 2035
Commercial Gas Restaurant Ranges Market Size and Share Forecast Outlook 2025 to 2035
Commercial Heat Pump Market Size and Share Forecast Outlook 2025 to 2035
Commercial Countertop Ranges Market Size and Share Forecast Outlook 2025 to 2035
Commercial Electric Restaurant Ranges Market Size and Share Forecast Outlook 2025 to 2035

Thank you!
You will receive an email from our Business Development Manager. Please be sure to check your SPAM/JUNK folder too.
Chat With
MaRIA