Commercial Air Fryer Market Outlook (2023 to 2033)

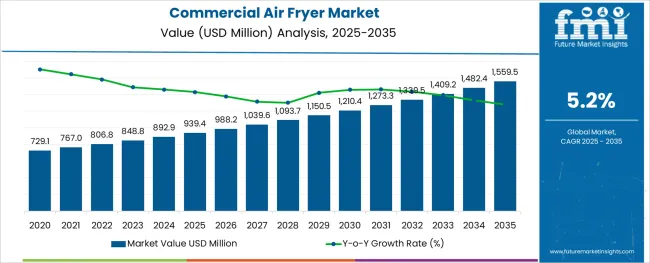
The commercial air fryer market size is anticipated to rise from US$ 848.8 Million in 2023 and it is anticipated to surpass US$ 1,409.2 Million by 2033. The demand for commercial air fryers is anticipated to expand at a CAGR of 5.2% during the forecast period due to the rising popularity of fast food and snacks prepared using healthy modes of preparation. Some of the key factors aiding the sales include:

  • The demand for commercial air fryers is rising, supported by the growing health concerns pertaining to high fat intake and cholesterol levels among the population, resulting in healthy food consumption.
  • Rising cardiac conditions, such as heart attacks, strokes, colon cancer, obesity, and diabetes as a consequence of frequent consumption of deep-fried food, are creating demand for air-fried food products.
  • Moreover, the continually expanding travel and tourism industry across the globe is giving rise to the demand for commercial air fryers across hotels and restaurant chains.
  • The market is also influenced by the changing lifestyle and evolving consumer preferences, backing the demand for food products prepared in a healthy manner.
  • The technological advancements in the market to boost efficiency and integrate new features in the final product to attract a larger consumer base are expected to help the market prosper over the forthcoming years.
  • The rising convenience of procuring the product from many sales channels, ranging from direct sales to online retailers, is predicted to push the market growth forward.
  • Further, the efficient aftersales service provided by the key companies to boost customer satisfaction is also anticipated to propel the sales of commercial air fryers in the forecast period.
  • Additionally, the food cooks faster in an air fryer than in an oven, thus saving electricity and lowering carbon emissions, making it an environment-friendly food appliance.
  • The use of commercial air fryers ensures the delectability of the fried food without much oil, keeping the taste and crispiness intact.
  • The versatility of air fryers to heat frozen food products, and cook a diverse range of fresh food, including steak, chicken, fish, pork chops, and vegetables is aiding the sales of commercial air fryers.

Don't pay for what you don't need

Customize your report by selecting specific countries or regions and save 30%!

Innovations and Opportunities in Commercial Air Fryer Market

Air fryers are synonymous with healthy food concepts. They offer convenience and help cook an extensive range of food products, including French fries, battered seafood, chicken wings, chips, etc. With surging demand for healthier meals even while dining out, several restaurant chains are adopting appliances that promote healthier ways of meal preparation. Thus, the demand for air fryers that help cook ‘fried’ food with little to no oil without compromising on crispiness, taste, and health has been gaining traction recently. Further, the availability of commercial air fryers in various sizes, capacities, and styles, as a stand-alone appliance or as well-suited for a countertop, are adding to its demand from fast-food facilities, restaurants, bars, school cafeterias, and food trucks.

Modern air fryers are now available for larger kitchens, having a basket capacity of 1 gallon, large enough for preparing several portions at once. These units have pre-programmed settings for chicken, fries, steak, and fish, etc., with a manual mode to control the temperature and cooking time. The quick cooking time of advanced air fryers aids will boost the satisfaction of final customers, thus, increasing its uptake by concession stands, cafés, food trucks, or catering businesses that serve fried foods. More technological innovations in the market include premium digital air fryers that allow crispy and evenly cooked food with greater efficiency in a matter of few seconds. Further, the development of new air fryers allowing the simultaneous meal preparation of two separate dishes has been gaining popularity as of late. The new air fryer/toaster oven units in the market, which offers the convenience of an air fryer and the versatility of an oven, offering pre-programmed settings for pizza, French fries, defrosting, barbeque, and roasting, are drawing the interest of the stakeholders.

Market players are further innovating affordable air fryer solutions for small businesses like food trucks and catering businesses. Further, several businesses are investing in this equipment to keep up with the consumer’s adoption of oil-free diets for health reasons. Additional sales propellants include new recipe developments, specific to the air fryers, and health and wellness trends surfacing on social media platforms that promote the consumption of low or no-oil-based foods due to their health benefits.

Brief Assessment of Challenges Impacting Commercial Air Fryer Market

According to World Customs Organization (WCO), more than two million counterfeit pieces were seized during WCO operations in the Balkans in March 2022. The ineptitude of procurement networks to solve this issue is posing a severe challenge to key players, thus resulting in reduced consumer confidence and sales of new appliances. This problem is more prominent in online retail due to the lack of an appropriate verification process for product authenticity during delivery. Additionally, owing to new, more sophisticated counterfeiting processes, consumers are facing more difficulty distinguishing genuine versus counterfeit products, thus adversely impacting product sales and revenue.

Air fryers have plastic coatings on cooking surfaces, which in the long-term results in the release of toxic materials. Additionally, the high price of air fryers, coupled with frequent requirements for extra accessories at an additional cost, might dissuade customers, especially small businesses like food trucks and catering businesses, from purchasing commercial air fryers. LACK OF SKILLED PEOPLE

Nandini Roy Choudhury

Principal Consultant

Talk to Analyst

Find your sweet spots for generating winning opportunities in this market.

Segmentation Analysis of the Commercial Air Fryer Market

By Device Type, Manual Segment Projected to Lead Commercial Air Fryer Market

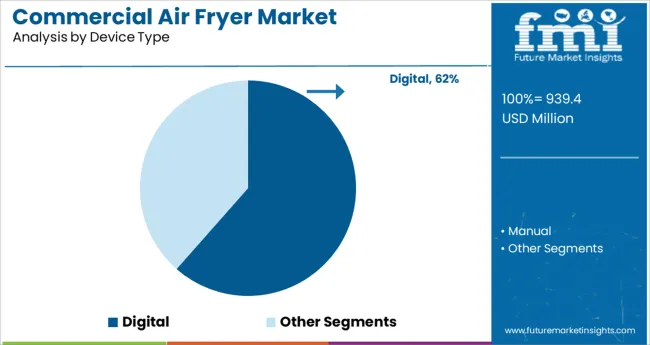
A manual air fryer, also known as an analog air fryer, is controlled by two simple dials responsive to cooking temperature and cooking time and has no other smart function. The manual air fryer holds the largest market share, accounting for 72.8% of the entire market share. This could be ascribed to the high demand for cheap air fryers to cut down the overall costs of businesses. Moreover, the congruent price range for a top manual air fryer and an entry-level digital air fryer seems to favor the demand for manual air fryers. Additionally, analog air fryers are easy to use for commercial purposes as many professionals are yet to be familiarized with the advanced, more complex digital air fryers. Also, the simple and fewer functions of manual air fryers make for the low repair cost of air fryers of this category, thus resulting in its heightened sales in the forthcoming years.

By Wattage, the 1200-1500 Watt Segment to Dominate Commercial Air Fryer Market

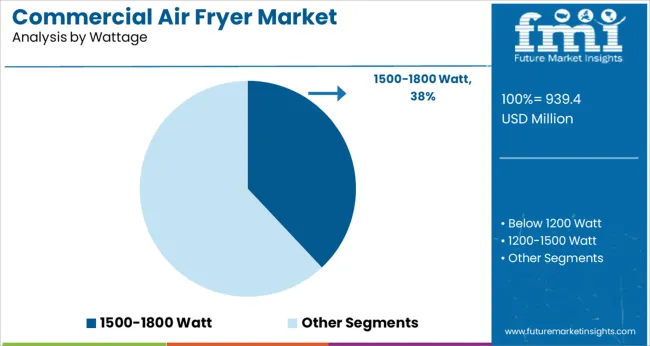
As the general wattage required by air fryers is around 1425 watts, the demand for air fryers within the range of 1200 -1500 watts is gaining huge demand. The market share held by 1200-1500 watts accounted for 27.3% of the overall market share of commercial air fryers. Moderately low power consumption of air fryers, in contrast to microwaves, deep fryers, and traditional ovens, is also boosting the product demand over the forecast period.
Regional Analysis of the Commercial Air Fryer Market

How Would the USA Maintain Dominance in the North American Commercial Air Fryer Market?

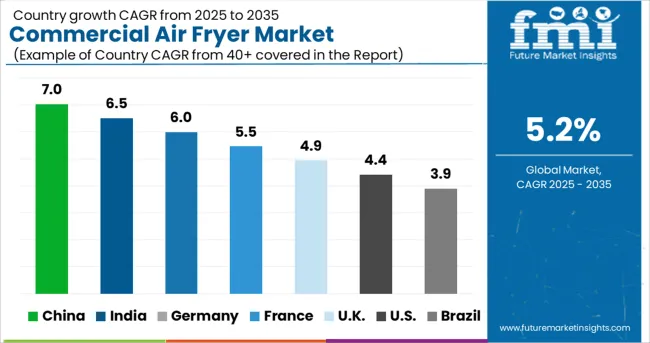
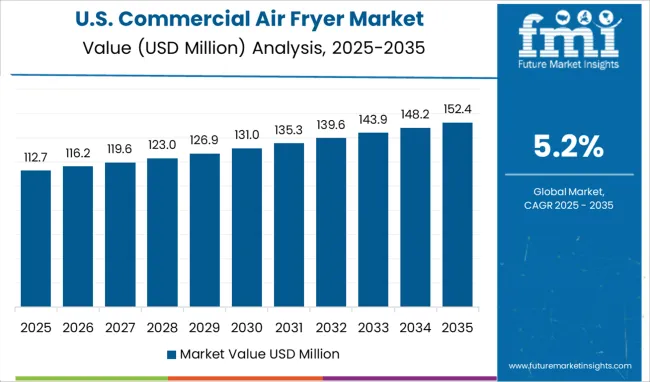
With almost 19.8% of the estimated market share in terms of sales in 2033, the USA is predicted to dominate the global market. The USA is expected to enjoy the largest market share on account of the surging adoption of air fryers for commercial purposes due to the rising awareness regarding the health benefits of food items prepared using air fryers. Further, the rising acceptance of smart kitchen equipment in the hotels, restaurants, and cafes (HORECA) sector to promote efficiency and modular aesthetics is also invigorating the market growth in the region.

The market is further driven by the high obesity rate in the USA, linked with a high incidence of cancers, thus propelling the demand for modern appliances promoted for their health benefits. Additionally, the market is supported by research and development activities in the market. In addition to this, the high density of well-established and widely-known players in the market is a significant factor contributing to the expansion of the commercial air fryer market size in the region.

  • In March 2022, Gourmia™, which is a manufacturer and designer of advanced countertop kitchen appliances, announced the addition of air fryers and toaster oven air fryers to its product portfolio at the Inspired Home Show’22 in Chicago.

Germany to Hold a Dominance in Europe Commercial Air Fryer Market

The German commercial air fryer market is expected to account for the second-largest market share of 8.4% in 2033. The market growth for commercial air fryers looks promising in Germany. Several factors contributing towards the market growth in the region include rising investments, growing health consciousness and responsiveness for consuming a healthy diet, the launch of innovative products with new features and improved designs, and rising adoption of air fryers in shops, café, fast food restaurants, and hotels. Additionally, the market is propelled by the directed shift towards multi-functional air fryers from traditional deep fryers. Moreover, the rising demand for easy-to-use and quicker-to-operate appliances is supporting the demand for air fryers for commercial purposes.
Growing Demand for Healthy Alternatives for Fried Food in Japan to Result in Market Growth

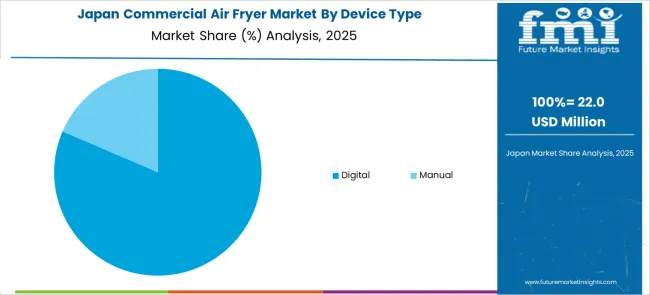
Owing to the surge in momentum for the commercial use of air fryers, the Japan commercial air fryer market is predicted to account for a market share of 5.4% in the year 2033. The rising standards of living, the emerging trend of low-fat or oil-based cooking, and growing health consciousness among consumers are collectively aiding the growth of Japan's commercial air fryer market. Further, the high health consciousness of the Japanese populace, expanding food services sector in the country, new developments in air fryers accommodating larger capacities, well-suited cafes, hotels, and restaurants (HORECA) sector, are some of the factors facilitating the market growth in the region.

Lucrative Opportunities in Australia to Attract Key Players in the Region

The Australian commercial air fryer market is estimated to represent 3.2% of the global commercial air fryer market in 2033. The market growth over the forecast period can be attributed to the new players expanding in the region due to lucrative growth opportunities in Australia. Additionally, ongoing collaborations as well as the acquisition of smaller companies are aiding the market growth of commercial air fryers in the region. The market is further influenced by the willingness of food service establishments to adopt appliances that support healthy eating practices. In addition to this, the growing sports and fitness-conscious consumers in the country are anticipated to propel the demand for air-fried food at food junctions.

Get the data you need at a Fraction of the cost

Personalize your report by choosing insights you need
and save 40%!

Start-ups Innovate to Beat Tough Competition

Due to their comparable product portfolios and clientele, start-ups are now engaged in severe competition. Over the projected period, it is anticipated that new fast-food companies seeking an enlarged customer base, encompassing health-conscious consumers, in addition to the expansion of operations would have a favorable effect on commercial air fryer demand.

Several start-ups have begun selling their goods online. To guarantee the widest possible product distribution, start-ups are partnering with distributors across the world. This assists them in growing both their customer base and the reach of their goods. Additionally, the industry is anticipated to benefit from rising internet penetration in both developed and emerging nations.

  • LightFry

LightFry, located in Sweden, offers air fryers and follows up on the installation of the product. The start-up is determined to grow awareness around this technology to expand its customer base. Additionally, the firm is taking action to ensure that the customers achieve great results in terms of improved production, financial savings, and an enhanced working environment.
New Launches of Smart Kitchen Appliances by Leading Producers of Commercial

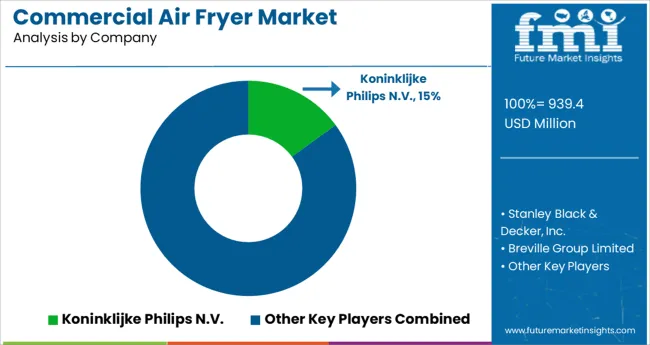
The presence of several well-known competitors, such as Koninklijke Philips N.V., Stanley Black & Decker, Inc., and Breville Group Limited, as well as numerous small and medium-sized competitors, dominate the market. Furthermore, the commercial air fryer industry is marked by intense competition since the top commercial air fryer manufacturers have such a large client base. The players are well-established, have robust and wide-ranging distribution networks, and they can satisfy the demands of the food chain industry.

  • In August 2022, Xiaomi, a technology giant, declared the launch of the Smart Air Fryer in India. The smart kitchen appliance is outfitted with a broad-temperature range accommodating multi-functional cooking, over 50+ smart new recipes, and voice command controlled by Google Assistant. The product is available on Mi Homes, Mi.com, Amazon, and retail stores.
  • In October 2020, QNC, Inc.(QNC), a Texas-based company that manufactures commercial cooking appliances, launched GF5 RAF, its newest model, which has enlarged cooking capacity, enables faster cooking and crispier products, and includes a heated catalyst system. With this launch, the company has gained an extended customer base of hospitals, military bases, school nutrition programs, sports stadiums, and other high-volume accounts.

Some of the Key Players Operating in the Commercial Air Fryer Market Include

Scope of the Report

Attribute Details
Growth Rate CAGR of 4.2% from 2023 to 2033
Base Year of Estimation 2023
Historical Data 2018 to 2022
Forecast Period 2023 to 2033
Quantitative Units Revenue in US$ Million and Volume in Units and F-CAGR from 2023 to 2033
Report Coverage Revenue Forecast, Volume Forecast, Company Ranking, Competitive Landscape, growth factors, Trends, and Pricing Analysis
Key Segments Covered By Device Type, By Wattage, By Price Range, By Sales Channel, By Region
Regions Covered North America; Latin America; Europe; East Asia; South Asia; Middle East & Africa; Oceania
Key Countries Profiled The USA, Canada, Brazil, Mexico, Germany, Italy, France, The UK, Spain, Russia, China, Japan, India, GCC Countries, Australia
Key Companies Profiled Koninklijke Philips N.V.; Stanley Black & Decker, Inc.; Breville Group Limited; Groupe SEB; SharkNinja Operating LLC (CDH Private Equity); Cuisinart Corporation (Conair Corporation); Meyer Manufacturing Company Limited; GoWISE USA (Ming’s Mark Inc); NuWave, LLC; De’ Longhi Appliances S.r.l
Customization & Pricing Available upon Request

Key Segments Covered in the Commercial Air Fryer Market Report

By Device Type:

  • Manual
  • Digital

By Wattage:

  • Below 1200 Watt
  • 1200-1500 Watt
  • 1500-1800 Watt
  • 1800-2200 Wattage
  • 2200 Wattage & Above

By Price Range:

  • Below US$ 25
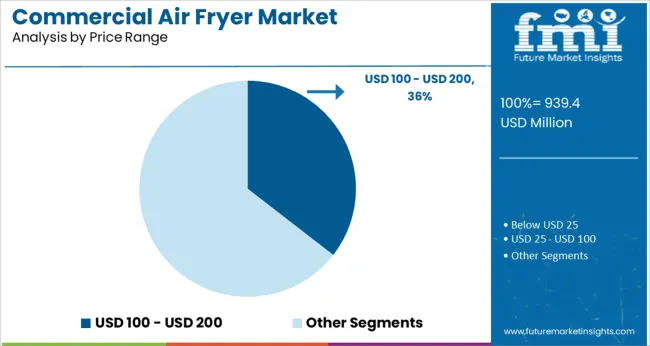
  • US$ 25 - US$ 100
  • US$ 100 - US$ 200
  • US$ 200- US$ 300
  • US$ 300 & Above

By Sales Channel:

  • Direct Sales
  • Supermarket/Hypermarket
  • Department Stores
  • Specialty Stores
  • Online Retailers
  • Other Sales Channel

By Region:

  • North America
  • Latin America
  • Western Europe
  • Eastern Europe
  • Asia Pacific excluding Japan (APEJ)
  • Japan
  • Middle East & Africa (MEA)

Frequently Asked Questions

What is the Estimated Commercial Air Fryer Market Value in 2023?

The global commercial air fryer market is estimated to be valued at US$ 746.1 Million in 2023.

What is the Growth Outlook of the Global Commercial Air Fryer Market?

The commercial air fryer market is likely to grow at a CAGR of 5.2% from 2023 to 2033.

What is the Projected Value of the Commercial Air Fryer Market by 2033?

The commercial air fryer market is projected to reach a valuation of US$ 1,409.2 Million by 2033.

Which Region Dominates the Global Commercial Air Fryer Market?

The USA is projected to lead the global commercial air fryer market by 2033.

Table of Content

1. Executive Summary | Commercial Air Fryer Market

    1.1. Global Market Outlook

    1.2. Demand Side Trends

    1.3. Supply Side Trends

    1.4. Material Roadmap

    1.5. Analysis and Recommendations

2. Market Overview

    2.1. Market Coverage / Taxonomy

    2.2. Market Definition / Scope / Limitations

3. Key Market Trends

    3.1. Key Trends Impacting the Market

    3.2. Product Innovation / Development Trends

4. Key Success Factors

    4.1. Product Adoption / Usage Analysis

    4.2. Product USPs / Features

    4.3. Strategic Promotional Strategies

5. Global Market Demand Analysis 2018 to 2022 and Forecast, 2023 to 2033

    5.1. Historical Market Volume (‘000 Units) Analysis, 2018 to 2022

    5.2. Current and Future Market Volume (‘000 Units) Projections, 2023 to 2033

    5.3. Y-o-Y Growth Trend Analysis

6. Global Market - Pricing Analysis

    6.1. Regional Pricing Analysis

    6.2. Global Average Pricing Analysis Benchmark

7. Global Market Demand (in Value or Size in US$ Million) Analysis 2018 to 2022 and Forecast, 2023 to 2033

    7.1. Historical Market Value (US$ Million) Analysis, 2018 to 2022

    7.2. Current and Future Market Value (US$ Million) Projections, 2023 to 2033

        7.2.1. Y-o-Y Growth Trend Analysis

        7.2.2. Absolute $ Opportunity Analysis

8. Market Background

    8.1. Macro-Economic Factors

        8.1.1. Global GDP Growth Outlook

        8.1.2. Global Economic Outlook

        8.1.3. Global Food Processing Outlook

        8.1.4. Global Food Industry Overview

        8.1.5. Global Hospital Facilitating Industry

        8.1.6. Other Macro-Economic Factors

    8.2. Forecast Factors - Relevance & Impact

        8.2.1. Key Companies Historical Growth Overview

        8.2.2. Restaurant Sector Overview

        8.2.3. Raising Awareness Towards low-oil based foods

        8.2.4. Other Forecast Factors.

    8.3. Value Chain

        8.3.1. List of Manufacturers

        8.3.2. List of Physical Distributors

        8.3.3. Trade Margins/Profit Margins

    8.4. COVID-19 Crisis - Impact Assessment

        8.4.1. Current Statistics

        8.4.2. Short-Mid-Long Term Outlook

        8.4.3. Likely Rebound

    8.5. Market Dynamics

        8.5.1. Drivers

        8.5.2. Restraints

        8.5.3. Opportunity Analysis

9. Global Market Analysis 2018 to 2022 and Forecast 2023 to 2033, By Device Type

    9.1. Introduction / Key Findings

    9.2. Historical Market Size (US$ Million) and Volume Analysis By Device Type, 2018 to 2022

    9.3. Current and Future Market Size (US$ Million) and Volume Analysis and Forecast By Device Type, 2023 to 2033

        9.3.1. Manual

        9.3.2. Digital

    9.4. Market Attractiveness Analysis By Device Type

10. Global Market Analysis 2018 to 2022 and Forecast 2023 to 2033, By Wattage

    10.1. Introduction / Key Findings

    10.2. Historical Market Size (US$ Million) and Volume Analysis By Wattage, 2018 to 2022

    10.3. Current and Future Market Size (US$ Million) and Volume Analysis and Forecast By Wattage, 2023 to 2033

        10.3.1. Below 1200 Watt

        10.3.2. 1200-1500 Watt

        10.3.3. 1500-1800 Watt

        10.3.4. 1800-2200 Wattage

        10.3.5. 2200 Wattage & Above

    10.4. Market Attractiveness Analysis By Wattage

11. Global Market Analysis 2018 to 2022 and Forecast 2023 to 2033, By Price Range

    11.1. Introduction / Key Findings

    11.2. Historical Market Size (US$ Million) and Volume Analysis by Price Range, 2018 to 2022

    11.3. Current and Future Market Size (US$ Million) and Volume Analysis and Forecast By Price Range, 2023 to 2033

        11.3.1. Below US$ 25

        11.3.2. US$ 25 - US$ 100

        11.3.3. US$ 100 - US$ 200

        11.3.4. US$ 200- US$ 300

        11.3.5. US$ 300 & Above

    11.4. Market Attractiveness Analysis By Price Range

12. Global Market Analysis 2018 to 2022 and Forecast 2023 to 2033, By Sales Channel

    12.1. Introduction / Key Findings

    12.2. Historical Market Size (US$ Million) and Volume Analysis By Sales Channel, 2018 to 2022

    12.3. Current and Future Market Size (US$ Million) and Volume Analysis and Forecast By Sales Channel, 2023 to 2033

        12.3.1. Direct Sales

        12.3.2. Supermarket/Hypermarket

        12.3.3. Department Stores

        12.3.4. Specialty Stores

        12.3.5. Online Retailers

        12.3.6. Other Sales Channel

    12.4. Market Attractiveness Analysis By Sales Channel

13. Global Market Analysis 2018 to 2022 and Forecast 2023 to 2033, by Region

    13.1. Introduction

    13.2. Historical Market Size (US$ Million) and Volume Analysis by Region, 2018 to 2022

    13.3. Current Market Size (US$ Million) and Volume Analysis and Forecast by Region, 2023 to 2033

        13.3.1. North America

        13.3.2. Latin America

        13.3.3. Europe

        13.3.4. East Asia

        13.3.5. South Asia and Pacific

        13.3.6. Middle East and Africa (MEA)

    13.4. Market Attractiveness Analysis by Region

14. North America Market Analysis 2018 to 2022 and Forecast 2023 to 2033

    14.1. Introduction

    14.2. Pricing Analysis

    14.3. Historical Market Size (US$ Million) and Volume Trend Analysis by Market Taxonomy, 2018 to 2022

    14.4. Market Size (US$ Million) and Volume Forecast by Market Taxonomy, 2023 to 2033

        14.4.1. By Country

            14.4.1.1. United States of America

            14.4.1.2. Canada

        14.4.2. By Device Type

        14.4.3. By Wattage

        14.4.4. By Price Range

        14.4.5. By Sales Channel

    14.5. Market Attractiveness Analysis

        14.5.1. By Country

        14.5.2. By Device Type

        14.5.3. By Wattage

        14.5.4. By Price Range

        14.5.5. By Sales Channel

    14.6. Key Market Participants - Intensity Mapping

    14.7. Drivers and Restraints - Impact Analysis

15. Latin America Market Analysis 2018 to 2022 and Forecast 2023 to 2033

    15.1. Introduction

    15.2. Pricing Analysis

    15.3. Historical Market Size (US$ Million) and Volume Trend Analysis by Market Taxonomy, 2018 to 2022

    15.4. Market Size (US$ Million) and Volume Forecast by Market Taxonomy, 2023 to 2033

        15.4.1. By Country

            15.4.1.1. Brazil

            15.4.1.2. Mexico

            15.4.1.3. Rest of Latin America

        15.4.2. By Device Type

        15.4.3. By Wattage

        15.4.4. By Price Range

        15.4.5. By Sales Channel

    15.5. Market Attractiveness Analysis

        15.5.1. By Country

        15.5.2. By Device Type

        15.5.3. By Wattage

        15.5.4. By Price Range

        15.5.5. By Sales Channel

    15.6. Key Market Participants - Intensity Mapping

    15.7. Drivers and Restraints - Impact Analysis

16. Europe Market Analysis 2018 to 2022 and Forecast 2023 to 2033

    16.1. Introduction

    16.2. Pricing Analysis

    16.3. Historical Market Size (US$ Million) and Volume Trend Analysis by Market Taxonomy, 2018 to 2022

    16.4. Market Size (US$ Million) and Volume Forecast by Market Taxonomy, 2023 to 2033

        16.4.1. By Country

            16.4.1.1. Germany

            16.4.1.2. Italy

            16.4.1.3. France

            16.4.1.4. United Kingdom

            16.4.1.5. Spain

            16.4.1.6. BENELUX

            16.4.1.7. Russia

            16.4.1.8. Rest of Europe

        16.4.2. By Device Type

        16.4.3. By Wattage

        16.4.4. By Price Range

        16.4.5. By Sales Channel

    16.5. Market Attractiveness Analysis

        16.5.1. By Country

        16.5.2. By Device Type

        16.5.3. By Wattage

        16.5.4. By Price Range

        16.5.5. By Sales Channel

    16.6. Key Market Participants - Intensity Mapping

    16.7. Drivers and Restraints - Impact Analysis

17. South Asia and Pacific Market Analysis 2018 to 2022 and Forecast 2023 to 2033

    17.1. Introduction

    17.2. Pricing Analysis

    17.3. Historical Market Size (US$ Million) and Volume Trend Analysis by Market Taxonomy, 2018 to 2022

    17.4. Market Size (US$ Million) and Volume Forecast by Market Taxonomy, 2023 to 2033

        17.4.1. By Country

            17.4.1.1. India

            17.4.1.2. ASEAN

            17.4.1.3. Australia and New Zealand

            17.4.1.4. Rest of South Asia & Pacific

        17.4.2. By Device Type

        17.4.3. By Wattage

        17.4.4. By Price Range

        17.4.5. By Sales Channel

    17.5. Market Attractiveness Analysis

        17.5.1. By Country

        17.5.2. By Device Type

        17.5.3. By Wattage

        17.5.4. By Price Range

        17.5.5. By Sales Channel

    17.6. Key Market Participants - Intensity Mapping

    17.7. Drivers and Restraints - Impact Analysis

18. East Asia Market Analysis 2018 to 2022 and Forecast 2023 to 2033

    18.1. Introduction

    18.2. Pricing Analysis

    18.3. Historical Market Size (US$ Million) and Volume Trend Analysis by Market Taxonomy, 2018 to 2022

    18.4. Market Size (US$ Million) and Volume Forecast by Market Taxonomy, 2023 to 2033

        18.4.1. By Country

            18.4.1.1. China

            18.4.1.2. Japan

            18.4.1.3. South Korea

        18.4.2. By Device Type

        18.4.3. By Wattage

        18.4.4. By Price Range

        18.4.5. By Sales Channel

    18.5. Market Attractiveness Analysis

        18.5.1. By Country

        18.5.2. By Device Type

        18.5.3. By Wattage

        18.5.4. By Price Range

        18.5.5. By Sales Channel

    18.6. Key Market Participants - Intensity Mapping

    18.7. Drivers and Restraints - Impact Analysis

19. Middle East and Africa Market Analysis 2018 to 2022 and Forecast 2023 to 2033

    19.1. Introduction

    19.2. Pricing Analysis

    19.3. Historical Market Size (US$ Million) and Volume Trend Analysis by Market Taxonomy, 2018 to 2022

    19.4. Market Size (US$ Million) and Volume Forecast by Market Taxonomy, 2023 to 2033

        19.4.1. By Country

            19.4.1.1. GCC Countries

            19.4.1.2. Turkey

            19.4.1.3. Northern Africa

            19.4.1.4. South Africa

            19.4.1.5. Rest of Middle East and Africa

        19.4.2. By Device Type

        19.4.3. By Wattage

        19.4.4. By Price Range

        19.4.5. By Sales Channel

    19.5. Market Attractiveness Analysis

        19.5.1. By Country

        19.5.2. By Device Type

        19.5.3. By Wattage

        19.5.4. By Price Range

        19.5.5. By Sales Channel

    19.6. Key Market Participants - Intensity Mapping

    19.7. Drivers and Restraints - Impact Analysis

20. Countries-Wise Market Analysis

    20.1. Introduction

    20.2. United Kingdom Market Analysis

        20.2.1. By Device Type

        20.2.2. By Wattage

        20.2.3. By Price Range

        20.2.4. By Sales Channel

    20.3. Canada Market Analysis

        20.3.1. By Device Type

        20.3.2. By Wattage

        20.3.3. By Price Range

        20.3.4. By Sales Channel

    20.4. Mexico Market Analysis

        20.4.1. By Device Type

        20.4.2. By Wattage

        20.4.3. By Price Range

        20.4.4. By Sales Channel

    20.5. Brazil Market Analysis

        20.5.1. By Device Type

        20.5.2. By Wattage

        20.5.3. By Price Range

        20.5.4. By Sales Channel

    20.6. Germany Market Analysis

        20.6.1. By Device Type

        20.6.2. By Wattage

        20.6.3. By Price Range

        20.6.4. By Sales Channel

    20.7. Italy Market Analysis

        20.7.1. By Device Type

        20.7.2. By Wattage

        20.7.3. By Price Range

        20.7.4. By Sales Channel

    20.8. France Market Analysis

        20.8.1. By Device Type

        20.8.2. By Wattage

        20.8.3. By Price Range

        20.8.4. By Sales Channel

    20.9.United Kingdom Market Analysis

        20.9.1. By Device Type

        20.9.2. By Wattage

        20.9.3. By Price Range

        20.9.4. By Sales Channel

    20.10. Spain Market Analysis

        20.10.1. By Device Type

        20.10.2. By Wattage

        20.10.3. By Price Range

        20.10.4. By Sales Channel

    20.11. BENELUX Market Analysis

        20.11.1. By Device Type

        20.11.2. By Wattage

        20.11.3. By Price Range

        20.11.4. By Sales Channel

    20.12. Russia Market Analysis

        20.12.1. By Device Type

        20.12.2. By Wattage

        20.12.3. By Price Range

        20.12.4. By Sales Channel

    20.13. China Market Analysis

        20.13.1. By Device Type

        20.13.2. By Wattage

        20.13.3. By Price Range

        20.13.4. By Sales Channel

    20.14. Japan Market Analysis

        20.14.1. By Device Type

        20.14.2. By Wattage

        20.14.3. By Price Range

        20.14.4. By Sales Channel

    20.15. S. Korea Market Analysis

        20.15.1. By Device Type

        20.15.2. By Wattage

        20.15.3. By Price Range

        20.15.4. By Sales Channel

    20.16. India Market Analysis

        20.16.1. By Device Type

        20.16.2. By Wattage

        20.16.3. By Price Range

        20.16.4. By Sales Channel

    20.17. ASEAN Market Analysis

        20.17.1. By Device Type

        20.17.2. By Wattage

        20.17.3. By Price Range

        20.17.4. By Sales Channel

    20.18. Australia and New Zealand Market Analysis

        20.18.1. By Device Type

        20.18.2. By Wattage

        20.18.3. By Price Range

        20.18.4. By Sales Channel

    20.19. GCC Countries Market Analysis

        20.19.1. By Device Type

        20.19.2. By Wattage

        20.19.3. By Price Range

        20.19.4. By Sales Channel

    20.20. Turkey Market Analysis

        20.20.1. By Device Type

        20.20.2. By Wattage

        20.20.3. By Price Range

        20.20.4. By Sales Channel

    20.21. South Africa Market Analysis

        20.21.1. By Device Type

        20.21.2. By Wattage

        20.21.3. By Price Range

        20.21.4. By Sales Channel

    20.22. Northern Africa Market Analysis

        20.22.1. By Device Type

        20.22.2. By Wattage

        20.22.3. By Price Range

        20.22.4. By Sales Channel

21. Market Structure Analysis

    21.1. Market Analysis by Tier of Companies

    21.2. Market Share Analysis of Top Players

    21.3. Market Presence Analysis

22. Competition Analysis

    22.1. Competition Dashboard

    22.2. Competition Benchmarking

    22.3. Competition Deep Dive

        22.3.1. Koninklijke Philips N.V.

            22.3.1.1. Overview

            22.3.1.2. Product Portfolio

            22.3.1.3. Profitability by Market Segments (Product/Channel/Region)

            22.3.1.4. Sales Footprint

            22.3.1.5. Strategy Overview

        22.3.2. Koninklijke Philips N.V.

            22.3.2.1. Overview

            22.3.2.2. Product Portfolio

            22.3.2.3. Profitability by Market Segments (Product/Channel/Region)

            22.3.2.4. Sales Footprint

            22.3.2.5. Strategy Overview

        22.3.3. Stanley Black & Decker, Inc.

            22.3.3.1. Overview

            22.3.3.2. Product Portfolio

            22.3.3.3. Profitability by Market Segments (Product/Channel/Region)

            22.3.3.4. Sales Footprint

            22.3.3.5. Strategy Overview

        22.3.4. Breville Group Limited

            22.3.4.1. Overview

            22.3.4.2. Product Portfolio

            22.3.4.3. Profitability by Market Segments (Product/Channel/Region)

            22.3.4.4. Sales Footprint

            22.3.4.5. Strategy Overview

        22.3.5. Groupe SEB

            22.3.5.1. Overview

            22.3.5.2. Product Portfolio

            22.3.5.3. Profitability by Market Segments (Product/Channel/Region)

            22.3.5.4. Sales Footprint

            22.3.5.5. Strategy Overview

        22.3.6. SharkNinja Operating LLC (CDH Private Equity)

            22.3.6.1. Overview

            22.3.6.2. Product Portfolio

            22.3.6.3. Profitability by Market Segments (Product/Channel/Region)

            22.3.6.4. Sales Footprint

            22.3.6.5. Strategy Overview

        22.3.7. Cuisinart Corporation (Conair Corporation)

            22.3.7.1. Overview

            22.3.7.2. Product Portfolio

            22.3.7.3. Profitability by Market Segments (Product/Channel/Region)

            22.3.7.4. Sales Footprint

            22.3.7.5. Strategy Overview

        22.3.8. Meyer Manufacturing Company Limited

            22.3.8.1. Overview

            22.3.8.2. Product Portfolio

            22.3.8.3. Profitability by Market Segments (Product/Channel/Region)

            22.3.8.4. Sales Footprint

            22.3.8.5. Strategy Overview

        22.3.9. GoWISE USA

            22.3.9.1. Overview

            22.3.9.2. Product Portfolio

            22.3.9.3. Profitability by Market Segments (Product/Channel/Region)

            22.3.9.4. Sales Footprint

            22.3.9.5. Strategy Overview

        22.3.10. NuWave, LLC

            22.3.10.1. Overview

            22.3.10.2. Product Portfolio

            22.3.10.3. Profitability by Market Segments (Product/Channel/Region)

            22.3.10.4. Sales Footprint

            22.3.10.5. Strategy Overview

        22.3.11. De’ Longhi Appliances S.r.l.

            22.3.11.1. Overview

            22.3.11.2. Product Portfolio

            22.3.11.3. Profitability by Market Segments (Product/Channel/Region)

            22.3.11.4. Sales Footprint

            22.3.11.5. Strategy Overview

        22.3.12. DOMU Brands Ltd

            22.3.12.1. Overview

            22.3.12.2. Product Portfolio

            22.3.12.3. Profitability by Market Segments (Product/Channel/Region)

            22.3.12.4. Sales Footprint

            22.3.12.5. Strategy Overview

        22.3.13. TAURUS GROUP

            22.3.13.1. Overview

            22.3.13.2. Product Portfolio

            22.3.13.3. Profitability by Market Segments (Product/Channel/Region)

            22.3.13.4. Sales Footprint

            22.3.13.5. Strategy Overview

        22.3.14. Bajaj Electricals Ltd.

            22.3.14.1. Overview

            22.3.14.2. Product Portfolio

            22.3.14.3. Profitability by Market Segments (Product/Channel/Region)

            22.3.14.4. Sales Footprint

            22.3.14.5. Strategy Overview

        22.3.15. Newell Brands, Inc.

            22.3.15.1. Overview

            22.3.15.2. Product Portfolio

            22.3.15.3. Profitability by Market Segments (Product/Channel/Region)

            22.3.15.4. Sales Footprint

            22.3.15.5. Strategy Overview

        22.3.16. American Micronic Instruments (India) Private Limited

            22.3.16.1. Overview

            22.3.16.2. Product Portfolio

            22.3.16.3. Profitability by Market Segments (Product/Channel/Region)

            22.3.16.4. Sales Footprint

            22.3.16.5. Strategy Overview

        22.3.17. Domu Brands Limited

            22.3.17.1. Overview

            22.3.17.2. Product Portfolio

            22.3.17.3. Profitability by Market Segments (Product/Channel/Region)

            22.3.17.4. Sales Footprint

            22.3.17.5. Strategy Overview

        22.3.18. Gorenje

            22.3.18.1. Overview

            22.3.18.2. Product Portfolio

            22.3.18.3. Profitability by Market Segments (Product/Channel/Region)

            22.3.18.4. Sales Footprint

            22.3.18.5. Strategy Overview

        22.3.19. Philips

            22.3.19.1. Overview

            22.3.19.2. Product Portfolio

            22.3.19.3. Profitability by Market Segments (Product/Channel/Region)

            22.3.19.4. Sales Footprint

            22.3.19.5. Strategy Overview

        22.3.20. Avalon Bay

            22.3.20.1. Overview

            22.3.20.2. Product Portfolio

            22.3.20.3. Profitability by Market Segments (Product/Channel/Region)

            22.3.20.4. Sales Footprint

            22.3.20.5. Strategy Overview

        22.3.21. Tefal

            22.3.21.1. Overview

            22.3.21.2. Product Portfolio

            22.3.21.3. Profitability by Market Segments (Product/Channel/Region)

            22.3.21.4. Sales Footprint

            22.3.21.5. Strategy Overview

23. Assumptions and Acronyms Used

24. Research Methodology

Explore Process Automation Insights

View Reports
Future Market Insights

Commercial Air Fryer Market

Schedule a Call