Collapsible Rigid Containers Market Size and Share Forecast Outlook 2025 to 2035

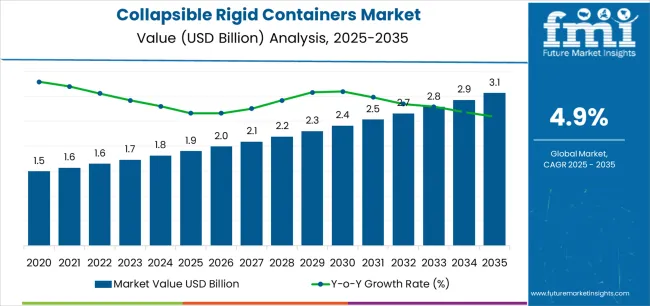
The global collapsible rigid containers market is valued at USD 1.9 billion in 2025 and is set to reach USD 3.0 billion by 2035, growing at a CAGR of 4.9%. The market stands at the forefront of a transformative decade that promises to redefine returnable packaging infrastructure and supply chain optimization excellence across automotive logistics, pharmaceutical distribution, chemical transport, and food supply sectors. The market's journey from USD 1.9 billion in 2025 to USD 3.0 billion by 2035 represents substantial growth, demonstrating the accelerating adoption of reusable bulk containers and sophisticated collapsible storage systems across closed-loop supply chains, warehouse optimization, transportation efficiency, and reverse logistics applications.

The first half of the decade (2025-2030) will witness the market climbing from USD 1.9 billion to approximately USD 2.6 billion, adding USD 0.7 billion in value, which constitutes 64% of the total forecast growth period. This phase will be characterized by the rapid adoption of advanced folding mechanisms, driven by increasing demand for storage space optimization and enhanced return logistics efficiency requirements worldwide. Superior durability capabilities and hygienic design features will become standard expectations rather than premium options.

The latter half (2030-2035) will witness growth from USD 2.6 billion to USD 3.0 billion, representing an addition of USD 0.4 billion or 36% of the decade's expansion. This period will be defined by mass market penetration of IoT-enabled tracking systems, integration with comprehensive supply chain visibility platforms, and seamless compatibility with existing material handling infrastructure. The market trajectory signals fundamental shifts in how manufacturers and logistics providers approach returnable packaging solutions, with participants positioned to benefit from demand across multiple industrial segments.
Quick Stats for Collapsible Rigid Containers Market

  • Collapsible Rigid Containers Market Value (2025): USD 1.9 billion
  • Collapsible Rigid Containers Market Forecast Value (2035): USD 3.0 billion
  • Collapsible Rigid Containers Market Forecast CAGR: 4.90%
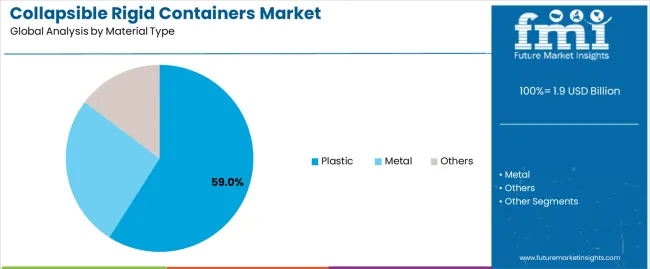
  • Leading Material Type in Collapsible Rigid Containers Market: Plastic (59%)
  • Key Growth Regions in Collapsible Rigid Containers Market: Asia Pacific, North America, and Europe
  • Key Players in Collapsible Rigid Containers Market: Brambles Limited, Supreme Industries Limited, Schoeller Allibert Services B.V., DS Smith plc, SSI Schäfer AG

Collapsible Rigid Containers Market Market Value Analysis

Collapsible Rigid Containers Market Year-over-Year Forecast (2025-2035)

The collapsible rigid containers market demonstrates distinct growth phases with varying market characteristics and competitive dynamics. Between 2025 and 2030, the market progresses through its circular economy adoption phase, expanding from USD 1.9 billion to USD 2.6 billion with steady annual increments averaging 6.5% growth. This period showcases the transition from single-use corrugated packaging to durable returnable containers with enhanced space efficiency and integrated tracking features becoming mainstream requirements.

The 2025-2030 phase adds USD 0.7 billion to market value, representing 64% of total decade expansion. Market maturation factors include standardization of folding dimensions, declining costs for high-impact polymer production, and increasing supply chain manager awareness of container pooling benefits reaching 71-76% effectiveness in automotive parts distribution applications. Competitive landscape evolution during this period features established pooling operators like Brambles and Schoeller Allibert expanding their container portfolios while new entrants focus on specialized pharmaceutical-grade solutions and enhanced hygiene technology.

From 2030 to 2035, market dynamics shift toward advanced digitalization and multi-industry deployment, with growth moderating from USD 2.6 billion to USD 3.0 billion, adding USD 0.4 billion or 36% of total expansion. This phase transition logic centers on smart container ecosystems, integration with blockchain traceability platforms, and deployment across diverse supply chain scenarios, becoming standard rather than specialized packaging formats. The competitive environment matures with focus shifting from basic collapsibility to comprehensive lifecycle management and compatibility with automated warehouse systems.

Collapsible Rigid Containers Market Key Takeaways

At-a-Glance Metrics

Metric Value
Market Value (2025) USD 1.9 billion
Market Forecast (2035) USD 3.0 billion
Growth Rate 4.90% CAGR
Leading Material Type Plastic
Primary Product Type Crates
Leading Sales Channel Direct
Primary End-Use Automobile

The market demonstrates strong fundamentals with plastic containers capturing a dominant share through superior durability and lightweight handling capabilities. Crate configurations drive primary demand, supported by increasing just-in-time manufacturing requirements and component protection solutions. Geographic expansion remains concentrated in Asia Pacific markets with rapidly expanding automotive production, while developed regions show steady adoption rates driven by circular economy mandates and rising reverse logistics activity.

Why is the Collapsible Rigid Containers Market Growing?

Market expansion rests on three fundamental shifts driving adoption across manufacturing and logistics sectors. Circular economy mandates create compelling advantages through returnable container systems that provide comprehensive waste reduction with enhanced cost efficiency, enabling manufacturers to optimize packaging expenditure and meet regulatory requirements while justifying pooling infrastructure investments over disposable corrugated alternatives. Automotive production optimization accelerates worldwide as just-in-time manufacturing drives precision logistics that delivers component protection across complex supply networks, enabling damage prevention that aligns with quality expectations and maximizes assembly line efficiency. E-commerce growth drives adoption from retailers requiring efficient distribution solutions that maximize warehouse space utilization while maintaining product protection during omnichannel fulfillment and reverse logistics operations.

The growth faces headwinds from initial investment barriers that differ across pooling model adoption regarding capital requirements and network establishment, potentially limiting market penetration in small-scale operations with limited financial resources. Container return rate challenges also persist regarding loss prevention and tracking accuracy that may increase operational costs in open-loop systems with multiple trading partners.

Opportunity Pathways - Collapsible Rigid Containers Market

The collapsible rigid containers market represents a compelling intersection of circular economy principles, logistics optimization, and supply chain efficiency. With robust growth projected from USD 1.9 billion in 2025 to USD 3.0 billion by 2035 at a 4.90% CAGR, this market is driven by increasing automotive production trends, pharmaceutical cold chain requirements, and commercial demand for returnable packaging formats.

The market's expansion reflects a fundamental shift in how manufacturers and logistics providers approach packaging infrastructure. Strong growth opportunities exist across diverse applications, from automotive tier suppliers requiring parts protection to pharmaceutical distributors demanding temperature-controlled transport. Geographic expansion is particularly pronounced in Asia-Pacific markets, led by China (6.615% CAGR) and India (6.125% CAGR), while established markets in North America and Europe drive innovation and specialized container development.

The dominance of plastic materials and automobile applications underscores the importance of proven durability and supply chain integration in driving adoption. Return rate optimization and asset tracking remain key challenges, creating opportunities for companies that can deliver reliable performance while maintaining pooling efficiency.

  • Pathway A - Automotive Parts Protection & JIT Logistics. Development of specialized collapsible containers for engine components, electronic assemblies, and trim parts with enhanced part-specific configurations, ESD protection, and damage prevention. Focus on standardization initiatives and compatibility with automated assembly lines. Expected revenue pool: USD 420-540 million.
  • Pathway B - Geographic Expansion & Manufacturing Growth. Strong growth opportunities in China (6.615% CAGR) and India (6.125% CAGR) through partnerships with automotive OEMs, region-specific pooling networks, and compliance with local packaging regulations. Localization addresses infrastructure requirements and enables closed-loop system establishment. Revenue opportunity: USD 365-470 million.
  • Pathway C - Pharmaceutical Cold Chain Solutions. Developing advanced temperature-controlled collapsible containers for vaccine distribution, biologic transport, and pharmaceutical ingredient shipping. Focus on thermal insulation, validation documentation, and compatibility with GDP requirements. Pool: USD 315-405 million.
  • Pathway D - Intermediate Bulk Container (IBC) Innovation. Specialized foldable IBCs incorporating flexible liner systems, UN certification, and chemical compatibility for liquid transport where space-efficient return logistics and hazmat compliance justify rigid collapsible designs. Focus on safety features and volumetric efficiency. Revenue uplift: USD 270-350 million.
  • Pathway E - Food & Beverage Supply Chain Applications. Systems designed for produce distribution, beverage delivery, bakery transport, and protein supply chains that appeal to food processors and grocery retailers. Integration of hygiene standards and temperature control features. Expected upside: USD 230-300 million.
  • Pathway F - E-commerce & Retail Distribution. Incorporating collapsible containers for omnichannel fulfillment, store replenishment, and last-mile delivery that enhance operational efficiency while providing damage reduction benefits. Focus on ergonomic handling and quick-fold mechanisms. Innovation pool: USD 195-255 million.
  • Pathway G - Smart Container & IoT Integration. Tailored solutions incorporating RFID tracking, GPS location monitoring, and condition sensing with real-time visibility for supply chain optimization and asset management. Enhanced appeal for high-value goods and pharmaceutical serialization. Strategic value: USD 160-215 million.

Segmental Analysis

Primary Classification: The market segments by material type into plastic, metal, and others categories, representing the evolution from wooden crates to advanced polymer-based systems for comprehensive returnable packaging operations.

Secondary Breakdown: Product type segmentation divides the market into crates, foldable IBCs, pallet boxes, and jerry cans sectors, reflecting distinct requirements for capacity, handling methods, and application specificity.

Tertiary Classification: Sales channel analysis covers direct and indirect distribution methods, demonstrating procurement pattern variations across different customer segments and relationship structures.

Quaternary Breakdown: End-use segmentation encompasses automobile, pharmaceutical, chemical, agriculture, food & beverage, shipping & logistics, and other manufacturing sectors, highlighting industry-specific container requirements.

Regional Classification: Geographic distribution covers North America, Europe, Asia Pacific, Latin America, and the Middle East & Africa, with Asia Pacific markets leading adoption while developed economies show steady growth patterns driven by logistics infrastructure modernization programs.

The segmentation structure reveals technology progression from basic collapsible designs toward engineered load-bearing structures with enhanced space efficiency and integrated identification capabilities, while application diversity spans from automotive component transport to pharmaceutical temperature-controlled logistics requiring comprehensive validation solutions and regulatory compliance systems.
By Material Type, the Plastic Segment Accounts for Dominant Market Share

Collapsible Rigid Containers Market Analysis By Material Type

Plastic segment is estimated to account for 59% of the collapsible rigid containers market share in 2025. The segment's leading position stems from its fundamental role as a critical component in lightweight packaging applications and its extensive use across multiple automotive, food, and industrial sectors. Plastic's dominance is attributed to its superior weight-to-strength ratio, including excellent impact resistance, chemical inertness, and design flexibility that make it indispensable for high-rotation pooling and multi-trip logistics operations.

Market Position: Plastic container systems command the leading position in the collapsible rigid containers market through advanced polymer processing technologies, including comprehensive injection molding capabilities, structural ribbing optimization, and reliable hinge mechanisms that enable logistics providers to deploy containers across diverse transportation applications.

Value Drivers: The segment benefits from material cost-effectiveness that provides attractive total cost of ownership without compromising durability performance. Excellent corrosion resistance enables deployment in food-grade applications, chemical transport, and outdoor storage scenarios where moisture exposure and chemical contact represent critical environmental requirements.

Competitive Advantages: Plastic systems differentiate through outstanding design versatility, proven hygiene characteristics, and compatibility with automated handling equipment that enhance operational efficiency while maintaining economical lifecycle profiles suitable for diverse pooling applications.

Key market characteristics:

  • Advanced material systems with high-density polyethylene (HDPE), polypropylene (PP), and engineered polymer formulations
  • Design optimization enabling comprehensive collapsibility with structural integrity maintenance under load
  • Customization options, including color coding, logo branding, and dimension variations for customer-specific operations

By Product Type, the Crates Segment Accounts for Significant Market Share

Crates segment is projected to hold 42.8% of the collapsible rigid containers market share in 2025. The segment's strong market position is driven by the versatile application suitability and widespread adoption across automotive parts handling, where crates serve as both protective packaging and material handling units. The manufacturing industry's preference for standardized container formats supports the segment's prominent position.

Market Context: Crate applications represent the foundation of the market due to optimal balance between load capacity, handling convenience, and space efficiency that extends operational versatility while maintaining cost-effective pricing structures.

Appeal Factors: Supply chain managers prioritize stackability when loaded, nestability when empty, and compatibility with standard pallet dimensions that enable efficient transportation and warehouse storage workflows. The segment benefits from established automotive industry standards and logistics infrastructure designed around crate-based systems.

Growth Drivers: Automotive tier supplier networks incorporate collapsible crates as standard packaging for component shipments. At the same time, e-commerce fulfillment centers are increasing adoption of crate systems that optimize storage density and enable rapid order picking operations.

Market Challenges: Specialized container requirements and unique dimensional needs may drive certain applications toward custom pallet boxes or bulk container alternatives.

Product type dynamics include:
  • Strong adoption in automotive supply chains and tier-supplier logistics requiring standardized packaging
  • Increasing usage in retail distribution and store replenishment for grocery and general merchandise
  • Rising preference in reverse logistics and returnable packaging programs for closed-loop supply chains

By Sales Channel, the Direct Segment Accounts for Significant Market Share

Collapsible Rigid Containers Market Analysis By Sales Channel

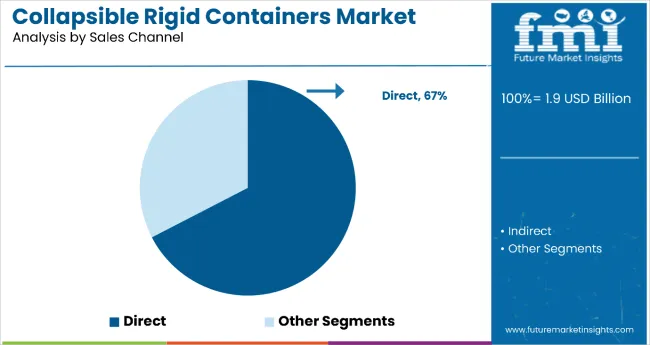
Direct sales channel is projected to hold approximately 58% of the collapsible rigid containers market share in 2025. The segment's market leadership is driven by the pooling service model prevalence and long-term rental arrangements, where container providers serve as both equipment suppliers and logistics partners. The industry's preference for asset-light operations supports the segment's dominant position.

Market Context: Direct sales applications dominate the market due to widespread adoption of container pooling services and optimal balance between capital efficiency, fleet management expertise, and quality assurance that extends operational value while maintaining predictable cost structures.

Appeal Factors: Manufacturing organizations prioritize turnkey solutions, comprehensive asset tracking, and service level guarantees that enable coordinated deployment without internal fleet management burdens. The segment benefits from substantial logistics outsourcing trends and industry preferences that emphasize core competency focus over packaging asset ownership.

Growth Drivers: Pooling service expansion incorporates technology-enabled tracking and automated billing systems. At the same time, circular economy pressures are increasing demand for managed returnable packaging programs that ensure consistent container quality and reliable availability.

Market Challenges: Large-volume users with established logistics networks may prefer direct ownership to maintain control and reduce long-term costs.

Sales channel dynamics include:
  • Strong growth in pooling service models and rental programs requiring provider relationship management
  • Increasing adoption in cross-industry standardization initiatives and collaborative supply chain programs
  • Rising integration with digital platforms and supply chain visibility tools

By End-Use, the Automobile Segment Accounts for the Largest Market Share

Collapsible Rigid Containers Market Analysis By End Use

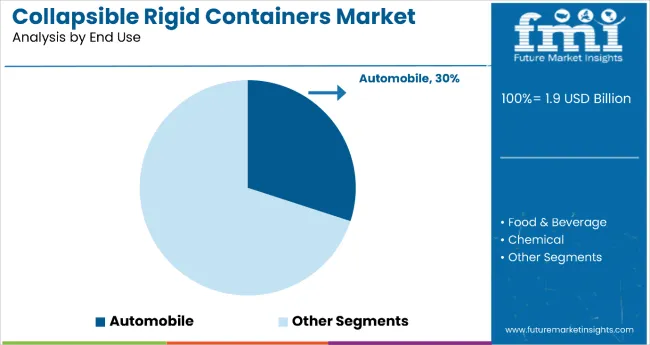
Automobile segment is projected to hold 34% of the collapsible rigid containers market share in 2025. The segment's market leadership is driven by the extensive use of collapsible containers in parts distribution, just-in-time delivery, aftermarket logistics, and component protection, where containers serve as both damage prevention systems and supply chain efficiency enablers. The automotive industry's consistent investment in logistics optimization supports the segment's dominant position.

Market Context: Automobile manufacturing applications dominate the market due to widespread adoption of sequenced part delivery and increasing focus on lean manufacturing, inventory reduction, and packaging standardization that extend production value while maintaining quality protection standards.

Appeal Factors: Automotive OEMs and tier suppliers prioritize container durability, dimensional consistency, and integration with automated guided vehicle (AGV) systems that enable coordinated deployment across global supply networks. The segment benefits from substantial electric vehicle production growth and industry standards that emphasize returnable packaging for environmental compliance.

Growth Drivers: Global automotive production expansion incorporates collapsible containers as essential infrastructure for parts logistics. At the same time, electric vehicle manufacturing is increasing demand for specialized containers that comply with battery component protection requirements and enhance supply chain visibility.

Market Challenges: Production volume fluctuations and regional manufacturing shifts may impact container utilization rates and pooling network optimization.

Application dynamics include:

  • Strong growth in tier-supplier networks and aftermarket parts distribution requiring protective packaging
  • Increasing adoption in electric vehicle component logistics and battery assembly material handling
  • Rising integration with manufacturing execution systems and supply chain control towers

What are the Drivers, Restraints, and Key Trends of the Collapsible Rigid Containers Market?

Growth Accelerators: Logistics cost optimization drives primary adoption as collapsible containers provide exceptional space efficiency that enables transportation cost reduction through maximized return load density, supporting operational profitability and competitive positioning that require efficient backhaul utilization. Environmental legislation accelerates market growth as extended producer responsibility mandates packaging waste minimization that maintains circular material flows during distribution while enhancing corporate objectives through documented recycling rates and material reuse metrics. Supply chain digitalization increases worldwide, creating demand for track-and-trace enabled containers that complement visibility platforms and provide competitive advantages in inventory accuracy.

Growth Inhibitors: Asset investment requirements differ across pooling model implementation regarding initial capital and network infrastructure, which may limit market adoption and accessibility in emerging markets with underdeveloped reverse logistics capabilities. Container standardization challenges persist regarding dimensional compatibility and industry-specific requirements that may increase complexity in multi-sector pooling operations with diverse customer specifications. Market competition from corrugated packaging and intermediate bulk containers creates substitution concerns between different packaging formats and existing supply chain preferences.

Market Evolution Patterns: Adoption accelerates in automotive and pharmaceutical sectors where container protection justifies pooling investments, with geographic concentration in Asia Pacific transitioning toward network expansion in manufacturing regions driven by automotive production growth and pharmaceutical distribution modernization. Technology development focuses on enhanced RFID integration, improved folding mechanism durability, and compatibility with automated storage and retrieval systems that optimize asset tracking and handling efficiency. The market could face disruption if alternative packaging innovations or single-use material improvements significantly challenge returnable container advantages in total cost of ownership comparisons.

Analysis of the Collapsible Rigid Containers Market by Key Country

The collapsible rigid containers market shows varied regional dynamics. Growth Leaders include China (6.6% CAGR) and India (6.1% CAGR), supported by booming logistics, e-commerce, and industrial packaging sectors, where collapsible rigid containers are increasingly adopted for cost-efficient storage and return logistics. Steady Performers encompass Germany (5.6% CAGR) and the USA (4.7% CAGR), benefiting from established packaging industries, eco-friendly initiatives, and automation in warehouse management systems. Emerging Markets include the UK (4.8% CAGR) and Japan (3.9% CAGR), where adoption is driven by niche applications in retail distribution, automotive supply chains, and space-efficient storage solutions.
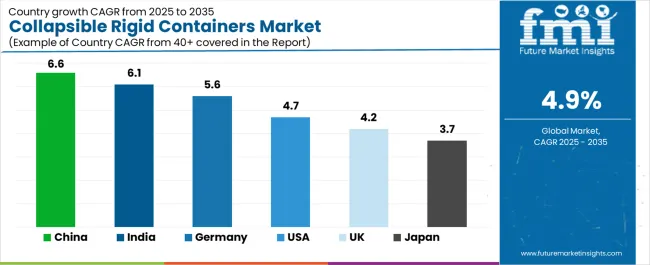
Collapsible Rigid Containers Market Cagr Analysis By Country

Country CAGR (2025–2035)
China 6.6%
India 6.1%
Germany 5.6%
USA 4.7%
UK 4.2%
Japan 3.7%

Asia-Pacific leads global growth, anchored by China and India, where expanding logistics networks, e-commerce growth, and manufacturing supply chains drive robust adoption of collapsible rigid containers. Europe maintains stable momentum, with Germany pushing growth through its advanced automotive and industrial packaging industries, while the UK sees consistent but modest uptake. North America shows measured growth led by the USA, where eco-friendly practices, warehouse automation, and returnable packaging programs fuel demand across retail and industrial sectors.
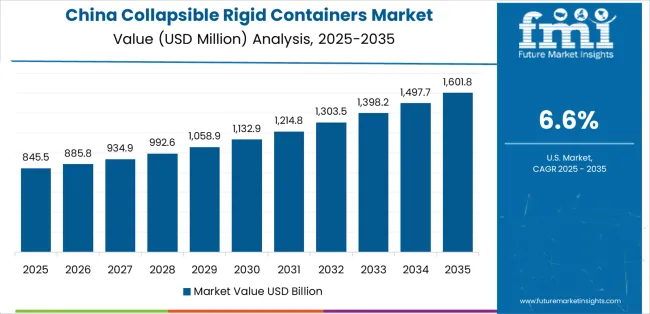
China Drives Global Market Leadership

Collapsible Rigid Containers Market Country Value Analysis

In Shanghai, Shenzhen/Guangzhou, and Tianjin, 3PLs, e-commerce fulfillment networks, and automotive suppliers are standardizing on collapsible rigid containers to cut cube, lower reverse-logistics costs, and meet environmental goals. The market is projected to grow at 6.6% CAGR through 2035, propelled by nationwide warehouse expansion, automation in mega-fulfillment centers, and OEM-led returnable packaging programs across automotive and electronics value chains. Local producers offer competitive, durable designs with quick lead times, while integrators bundle containers with RFID/IoT tracking and pooling services to boost fleet utilization.

Market Intelligence Brief:

  • E-commerce and 3PL hubs driving adoption with ~50% YoY growth in returnable container deployments
  • Government and industry environmental programs accelerating shift from single-use to reusable transport packaging
  • Local manufacturers >70% share, leveraging cost advantages and nationwide distribution
  • Rapid uptake of RFID/IoT-enabled containers for cycle tracking in automated DCs

India Emerges as High-Growth Market

In New Delhi, Mumbai, and Bangalore, industrial distributors, logistics providers, and e-commerce operators are adopting collapsible rigid containers to improve warehouse efficiency and return logistics. The market is set for 6.1% CAGR through 2035, supported by fast-growing e-commerce, retail and FMCG supply chains, and government-backed logistics infrastructure development. Adoption concentrates in automotive, retail distribution, and FMCG where space savings and reusability deliver measurable cost reductions.

Market Intelligence Brief:

  • Logistics & e-commerce operators posting ~52% annual growth in returnable packaging procurement
  • Infrastructure and logistics-park expansion programs encouraging standardized reusable containers
  • Local packaging manufacturers partnering with global suppliers to scale design and production
  • Urban retail, automotive, and FMCG hubs adopting containers to reduce handling costs and improve DC throughput

Germany Anchors European Premium Adoption

Across Bavaria, Baden-Württemberg, and North Rhine-Westphalia, automotive, industrial machinery, and grocery distribution networks deploy collapsible rigid containers as part of closed-loop, pooled RTP programs. With 5.6% CAGR, growth is driven by automation, enviromental regulations, and precision handling needs in Tier-1/Tier-2 supplier parks. German buyers favor heavy-duty, RFID-ready designs compatible with AS/RS and AGV systems.

Market Intelligence Brief:

  • Automotive & industrial accounts for ~55% of demand; grocery pooling adds steady volumes
  • EU packaging & waste directives catalyze switch to reusable transport packaging
  • Local/European manufacturers hold ~60% share in premium, durable formats
  • Strong demand for pooling + repair/refurb services to extend fleet life cycles

United States Leverages Automation & Retail Networks

In the Midwest, Texas, and California corridors, big-box retail, food & beverage distributors, and industrials adopt collapsible rigid containers to streamline high-velocity DCs and reduce freight backhauls. The market grows at 4.7% CAGR, supported by warehouse automation, ESG commitments, and retailer mandates for standardized returnable packaging. Integrations with WMS and vision-guided equipment enable faster turns and lower damage rates.

Market Intelligence Brief:

  • Retail & F&B distribution drive ~45%+ of demand for collapsible rigid containers
  • Automation-ready designs (fork-guide, AS/RS, AMR compatibility) gaining share
  • Domestic makers retain ~55% share, with imports supplementing peak demand
  • Growth in closed-loop programs reducing corrugate waste and transport cube by double digits

United Kingdom Maintains Moderate, Efficiency-Led Growth

In the Midlands and South East, grocery chains, automotive, and omni-channel retailers use collapsible rigid containers to save space in constrained DC footprints and trim reverse-logistics costs. With 4.8% CAGR, uptake is steady, shaped by environmental goals and network redesigns post-Brexit that favor standardized reusable systems and regional pooling.

Market Intelligence Brief:
  • Grocery & retail account for ~50–55% of demand; automotive provides high-value niches
  • Pooling models (rental/lease) expand to de-risk capex for mid-size shippers
  • Imports from EU/Asia complement ~35–40% domestic supply
  • Increased adoption of fold-flat, lightweight formats to cut handling and transport costs

Japan Pursues Incremental, High-Quality Adoption

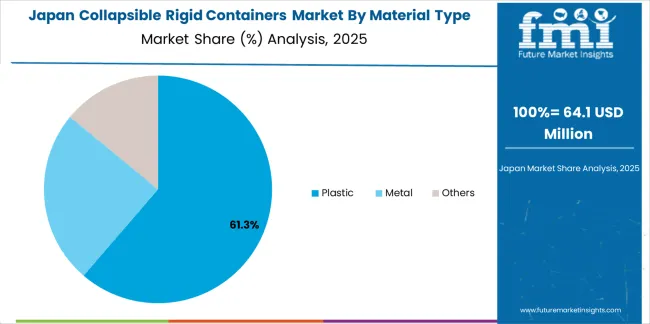
Collapsible Rigid Containers Market Japan Market Share Analysis By Material Type

In Tokyo, Osaka, and Nagoya, automotive keiretsu, electronics, and convenience-store logistics adopt collapsible rigid containers to support just-in-time flows and backroom space constraints. The market advances at 3.9% CAGR, with buyers prioritizing precision, durability, and quiet operation in dense, automated facilities. Lifecycle services—cleaning, inspection, and refurbishment are important differentiators.

Market Intelligence Brief:
  • Automotive/electronics represent ~50% of demand; convenience retail adds consistent volumes
  • Preference for premium, low-tolerance containers compatible with AGVs and shuttle systems
  • Domestic producers hold ~60%+ share, supplemented by select imports for specialty specs
  • Growth in service bundles (tracking, maintenance) to extend asset life and reliability

Competitive Landscape of the Collapsible Rigid Containers Market

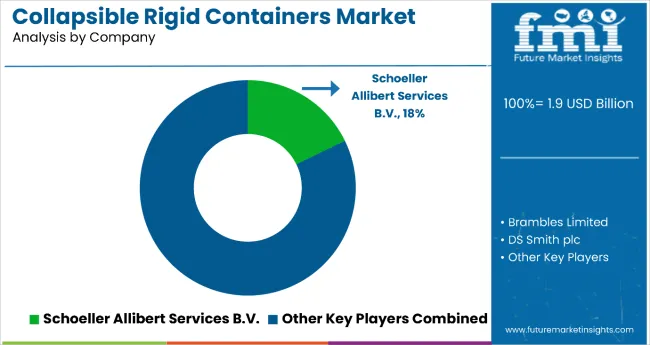
Collapsible Rigid Containers Market Analysis By Company

The collapsible rigid containers market operates with moderate concentration, featuring approximately 50-70 participants, where leading companies control roughly 47-55% of the global market share through established pooling networks and comprehensive service capabilities. Competition emphasizes fleet management expertise, geographic coverage, and customer service rather than price-based rivalry.

Market leaders encompass Brambles Limited, Supreme Industries Limited, and Schoeller Allibert Services B.V., which maintain competitive advantages through extensive pooling infrastructure, global service networks, and comprehensive asset tracking capabilities that create customer loyalty and support supply chain requirements. These companies leverage decades of returnable packaging experience and ongoing technology investments to develop advanced collapsible container systems with exceptional durability and tracking features.

Specialty challengers include DS Smith plc, SSI Schäfer AG, and Georg Utz Holding AG, which compete through specialized application focus and efficient regional operations that appeal to manufacturers seeking customized packaging solutions and flexible pooling arrangements. These companies differentiate through technical expertise emphasis and specialized industry application focus.

Market dynamics favor participants that combine reliable container quality with advanced pooling services, including asset tracking, maintenance programs, and logistics optimization support. Competitive pressure intensifies as packaging companies expand into pooling services. At the same time, logistics providers challenge established players through integrated supply chain solutions and multi-product container offerings targeting comprehensive packaging outsourcing opportunities.

Key Players in the Collapsible Rigid Containers Market

  • Brambles Limited
  • Supreme Industries Limited
  • Schoeller Allibert Services B.V.
  • DS Smith plc
  • SSI Schäfer AG
  • Georg Utz Holding AG
  • ORBIS Corporation
  • Rehrig Pacific Company
  • IPL Plastics Inc.
  • Craemer Holding GmbH
  • Loadhog Limited
  • TranPak Inc.
  • Polymer Logistics
  • Enlightening Pallet Industry Co., Ltd.
  • Qingdao Guanyu Plastic Co., Ltd.

Scope of the Report

Item Value
Quantitative Units USD 1.9 billion
Material Type Plastic, Metal, Others
Product Type Crates, Foldable IBCs, Pallet Boxes, Jerry Cans
Sales Channel Direct, Indirect
End-Use Automobile, Pharmaceutical, Chemical, Agriculture, Food & Beverage, Shipping & Logistics, Other Manufacturing
Regions Covered North America, Europe, Asia Pacific, Latin America, Middle East & Africa
Countries Covered China, Germany, USA, Japan, UK, India, and 33+ additional countries
Key Companies Profiled Brambles Limited, Supreme Industries Limited, Schoeller Allibert Services B.V., DS Smith plc, SSI Schäfer AG
Additional Attributes Dollar sales by material type and end-use categories, regional adoption trends across Asia Pacific, Europe, and North America, competitive landscape with pooling service providers and container manufacturers, customer preferences for durability and space efficiency, integration with supply chain management systems and reverse logistics networks, innovations in RFID tracking technology and material engineering, and development of specialized container solutions with enhanced collapsibility capabilities and automated handling features

Collapsible Rigid Containers Market by Segments

Material Type:

  • Plastic
  • Metal
  • Others

Product Type:

  • Crates
  • Foldable IBCs
  • Pallet Boxes
  • Jerry Cans

Sales Channel:

  • Direct
  • Indirect

End-Use:

  • Automobile
  • Pharmaceutical
  • Chemical
  • Agriculture
  • Food & Beverage
  • Shipping & Logistics
  • Other Manufacturing

Region:

  • North America
    • United States
    • Canada
    • Mexico
  • Europe
    • Germany
    • France
    • United Kingdom
    • Netherlands
    • Spain
    • Italy
    • Belgium
    • Rest of Europe
  • Asia Pacific
    • China
    • Japan
    • India
    • South Korea
    • Thailand
    • Indonesia
    • Australia & New Zealand
    • Rest of Asia Pacific
  • Latin America
    • Brazil
    • Argentina
    • Chile
    • Rest of Latin America
  • Middle East & Africa
    • United Arab Emirates
    • Kingdom of Saudi Arabia
    • Turkey
    • South Africa
    • Egypt
    • Rest of Middle East & Africa

Table of Content

  1. Executive Summary
    • Global Market Outlook
    • Demand to side Trends
    • Supply to side Trends
    • Technology Roadmap Analysis
    • Analysis and Recommendations
  2. Market Overview
    • Market Coverage / Taxonomy
    • Market Definition / Scope / Limitations
  3. Market Background
    • Market Dynamics
      • Drivers
      • Restraints
      • Opportunity
      • Trends
    • Scenario Forecast
      • Demand in Optimistic Scenario
      • Demand in Likely Scenario
      • Demand in Conservative Scenario
    • Opportunity Map Analysis
    • Product Life Cycle Analysis
    • Supply Chain Analysis
    • Investment Feasibility Matrix
    • Value Chain Analysis
    • PESTLE and Porter’s Analysis
    • Regulatory Landscape
    • Regional Parent Market Outlook
    • Production and Consumption Statistics
    • Import and Export Statistics
  4. Global Market Analysis 2020 to 2024 and Forecast, 2025 to 2035
    • Historical Market Size Value (USD Million) Analysis, 2020 to 2024
    • Current and Future Market Size Value (USD Million) Projections, 2025 to 2035
      • Y to o to Y Growth Trend Analysis
      • Absolute $ Opportunity Analysis
  5. Global Market Pricing Analysis 2020 to 2024 and Forecast 2025 to 2035
  6. Global Market Analysis 2020 to 2024 and Forecast 2025 to 2035, By Material Type
    • Introduction / Key Findings
    • Historical Market Size Value (USD Million) Analysis By Material Type , 2020 to 2024
    • Current and Future Market Size Value (USD Million) Analysis and Forecast By Material Type , 2025 to 2035
      • Plastic
      • Metal
      • Others
    • Y to o to Y Growth Trend Analysis By Material Type , 2020 to 2024
    • Absolute $ Opportunity Analysis By Material Type , 2025 to 2035
  7. Global Market Analysis 2020 to 2024 and Forecast 2025 to 2035, By Product Type
    • Introduction / Key Findings
    • Historical Market Size Value (USD Million) Analysis By Product Type, 2020 to 2024
    • Current and Future Market Size Value (USD Million) Analysis and Forecast By Product Type, 2025 to 2035
      • Crates
      • Foldable IBCs
      • Pallet Boxes
      • Jerry Cans
    • Y to o to Y Growth Trend Analysis By Product Type, 2020 to 2024
    • Absolute $ Opportunity Analysis By Product Type, 2025 to 2035
  8. Global Market Analysis 2020 to 2024 and Forecast 2025 to 2035, By Sales Channel
    • Introduction / Key Findings
    • Historical Market Size Value (USD Million) Analysis By Sales Channel, 2020 to 2024
    • Current and Future Market Size Value (USD Million) Analysis and Forecast By Sales Channel, 2025 to 2035
      • Direct sales
      • Indirect
    • Y to o to Y Growth Trend Analysis By Sales Channel, 2020 to 2024
    • Absolute $ Opportunity Analysis By Sales Channel, 2025 to 2035
  9. Global Market Analysis 2020 to 2024 and Forecast 2025 to 2035, By End-Use
    • Introduction / Key Findings
    • Historical Market Size Value (USD Million) Analysis By End-Use, 2020 to 2024
    • Current and Future Market Size Value (USD Million) Analysis and Forecast By End-Use, 2025 to 2035
      • Automobile
      • Pharmaceutical
      • Chemical
      • Agriculture
      • Food & Beverage
      • Shipping & Logistics
      • Other Manufacturing
    • Y to o to Y Growth Trend Analysis By End-Use, 2020 to 2024
    • Absolute $ Opportunity Analysis By End-Use, 2025 to 2035
  10. Global Market Analysis 2020 to 2024 and Forecast 2025 to 2035, By Region
    • Introduction
    • Historical Market Size Value (USD Million) Analysis By Region, 2020 to 2024
    • Current Market Size Value (USD Million) Analysis and Forecast By Region, 2025 to 2035
      • North America
      • Latin America
      • Western Europe
      • Eastern Europe
      • East Asia
      • South Asia and Pacific
      • Middle East & Africa
    • Market Attractiveness Analysis By Region
  11. North America Market Analysis 2020 to 2024 and Forecast 2025 to 2035, By Country
    • Historical Market Size Value (USD Million) Trend Analysis By Market Taxonomy, 2020 to 2024
    • Market Size Value (USD Million) Forecast By Market Taxonomy, 2025 to 2035
      • By Country
        • USA
        • Canada
        • Mexico
      • By Material Type
      • By Product Type
      • By Sales Channel
      • By End-Use
    • Market Attractiveness Analysis
      • By Country
      • By Material Type
      • By Product Type
      • By Sales Channel
      • By End-Use
    • Key Takeaways
  12. Latin America Market Analysis 2020 to 2024 and Forecast 2025 to 2035, By Country
    • Historical Market Size Value (USD Million) Trend Analysis By Market Taxonomy, 2020 to 2024
    • Market Size Value (USD Million) Forecast By Market Taxonomy, 2025 to 2035
      • By Country
        • Brazil
        • Chile
        • Rest of Latin America
      • By Material Type
      • By Product Type
      • By Sales Channel
      • By End-Use
    • Market Attractiveness Analysis
      • By Country
      • By Material Type
      • By Product Type
      • By Sales Channel
      • By End-Use
    • Key Takeaways
  13. Western Europe Market Analysis 2020 to 2024 and Forecast 2025 to 2035, By Country
    • Historical Market Size Value (USD Million) Trend Analysis By Market Taxonomy, 2020 to 2024
    • Market Size Value (USD Million) Forecast By Market Taxonomy, 2025 to 2035
      • By Country
        • Germany
        • UK
        • Italy
        • Spain
        • France
        • Nordic
        • BENELUX
        • Rest of Western Europe
      • By Material Type
      • By Product Type
      • By Sales Channel
      • By End-Use
    • Market Attractiveness Analysis
      • By Country
      • By Material Type
      • By Product Type
      • By Sales Channel
      • By End-Use
    • Key Takeaways
  14. Eastern Europe Market Analysis 2020 to 2024 and Forecast 2025 to 2035, By Country
    • Historical Market Size Value (USD Million) Trend Analysis By Market Taxonomy, 2020 to 2024
    • Market Size Value (USD Million) Forecast By Market Taxonomy, 2025 to 2035
      • By Country
        • Russia
        • Poland
        • Hungary
        • Balkan & Baltic
        • Rest of Eastern Europe
      • By Material Type
      • By Product Type
      • By Sales Channel
      • By End-Use
    • Market Attractiveness Analysis
      • By Country
      • By Material Type
      • By Product Type
      • By Sales Channel
      • By End-Use
    • Key Takeaways
  15. East Asia Market Analysis 2020 to 2024 and Forecast 2025 to 2035, By Country
    • Historical Market Size Value (USD Million) Trend Analysis By Market Taxonomy, 2020 to 2024
    • Market Size Value (USD Million) Forecast By Market Taxonomy, 2025 to 2035
      • By Country
        • China
        • Japan
        • South Korea
      • By Material Type
      • By Product Type
      • By Sales Channel
      • By End-Use
    • Market Attractiveness Analysis
      • By Country
      • By Material Type
      • By Product Type
      • By Sales Channel
      • By End-Use
    • Key Takeaways
  16. South Asia and Pacific Market Analysis 2020 to 2024 and Forecast 2025 to 2035, By Country
    • Historical Market Size Value (USD Million) Trend Analysis By Market Taxonomy, 2020 to 2024
    • Market Size Value (USD Million) Forecast By Market Taxonomy, 2025 to 2035
      • By Country
        • India
        • ASEAN
        • Australia & New Zealand
        • Rest of South Asia and Pacific
      • By Material Type
      • By Product Type
      • By Sales Channel
      • By End-Use
    • Market Attractiveness Analysis
      • By Country
      • By Material Type
      • By Product Type
      • By Sales Channel
      • By End-Use
    • Key Takeaways
  17. Middle East & Africa Market Analysis 2020 to 2024 and Forecast 2025 to 2035, By Country
    • Historical Market Size Value (USD Million) Trend Analysis By Market Taxonomy, 2020 to 2024
    • Market Size Value (USD Million) Forecast By Market Taxonomy, 2025 to 2035
      • By Country
        • Kingdom of Saudi Arabia
        • Other GCC Countries
        • Turkiye
        • South Africa
        • Other African Union
        • Rest of Middle East & Africa
      • By Material Type
      • By Product Type
      • By Sales Channel
      • By End-Use
    • Market Attractiveness Analysis
      • By Country
      • By Material Type
      • By Product Type
      • By Sales Channel
      • By End-Use
    • Key Takeaways
  18. Key Countries Market Analysis
    • USA
      • Pricing Analysis
      • Market Share Analysis, 2024
        • By Material Type
        • By Product Type
        • By Sales Channel
        • By End-Use
    • Canada
      • Pricing Analysis
      • Market Share Analysis, 2024
        • By Material Type
        • By Product Type
        • By Sales Channel
        • By End-Use
    • Mexico
      • Pricing Analysis
      • Market Share Analysis, 2024
        • By Material Type
        • By Product Type
        • By Sales Channel
        • By End-Use
    • Brazil
      • Pricing Analysis
      • Market Share Analysis, 2024
        • By Material Type
        • By Product Type
        • By Sales Channel
        • By End-Use
    • Chile
      • Pricing Analysis
      • Market Share Analysis, 2024
        • By Material Type
        • By Product Type
        • By Sales Channel
        • By End-Use
    • Germany
      • Pricing Analysis
      • Market Share Analysis, 2024
        • By Material Type
        • By Product Type
        • By Sales Channel
        • By End-Use
    • UK
      • Pricing Analysis
      • Market Share Analysis, 2024
        • By Material Type
        • By Product Type
        • By Sales Channel
        • By End-Use
    • Italy
      • Pricing Analysis
      • Market Share Analysis, 2024
        • By Material Type
        • By Product Type
        • By Sales Channel
        • By End-Use
    • Spain
      • Pricing Analysis
      • Market Share Analysis, 2024
        • By Material Type
        • By Product Type
        • By Sales Channel
        • By End-Use
    • France
      • Pricing Analysis
      • Market Share Analysis, 2024
        • By Material Type
        • By Product Type
        • By Sales Channel
        • By End-Use
    • India
      • Pricing Analysis
      • Market Share Analysis, 2024
        • By Material Type
        • By Product Type
        • By Sales Channel
        • By End-Use
    • ASEAN
      • Pricing Analysis
      • Market Share Analysis, 2024
        • By Material Type
        • By Product Type
        • By Sales Channel
        • By End-Use
    • Australia & New Zealand
      • Pricing Analysis
      • Market Share Analysis, 2024
        • By Material Type
        • By Product Type
        • By Sales Channel
        • By End-Use
    • China
      • Pricing Analysis
      • Market Share Analysis, 2024
        • By Material Type
        • By Product Type
        • By Sales Channel
        • By End-Use
    • Japan
      • Pricing Analysis
      • Market Share Analysis, 2024
        • By Material Type
        • By Product Type
        • By Sales Channel
        • By End-Use
    • South Korea
      • Pricing Analysis
      • Market Share Analysis, 2024
        • By Material Type
        • By Product Type
        • By Sales Channel
        • By End-Use
    • Russia
      • Pricing Analysis
      • Market Share Analysis, 2024
        • By Material Type
        • By Product Type
        • By Sales Channel
        • By End-Use
    • Poland
      • Pricing Analysis
      • Market Share Analysis, 2024
        • By Material Type
        • By Product Type
        • By Sales Channel
        • By End-Use
    • Hungary
      • Pricing Analysis
      • Market Share Analysis, 2024
        • By Material Type
        • By Product Type
        • By Sales Channel
        • By End-Use
    • Kingdom of Saudi Arabia
      • Pricing Analysis
      • Market Share Analysis, 2024
        • By Material Type
        • By Product Type
        • By Sales Channel
        • By End-Use
    • Turkiye
      • Pricing Analysis
      • Market Share Analysis, 2024
        • By Material Type
        • By Product Type
        • By Sales Channel
        • By End-Use
    • South Africa
      • Pricing Analysis
      • Market Share Analysis, 2024
        • By Material Type
        • By Product Type
        • By Sales Channel
        • By End-Use
  19. Market Structure Analysis
    • Competition Dashboard
    • Competition Benchmarking
    • Market Share Analysis of Top Players
      • By Regional
      • By Material Type
      • By Product Type
      • By Sales Channel
      • By End-Use
  20. Competition Analysis
    • Competition Deep Dive
      • Brambles Limited
        • Overview
        • Product Portfolio
        • Profitability by Market Segments (Product/Age /Sales Channel/Region)
        • Sales Footprint
        • Strategy Overview
          • Marketing Strategy
          • Product Strategy
          • Channel Strategy
      • Supreme Industries Limited
      • Schoeller Allibert Services B.V.
      • DS Smith plc
      • SSI Schäfer AG
      • Georg Utz Holding AG
      • ORBIS Corporation
      • Rehrig Pacific Company
      • IPL Plastics Inc.
      • Craemer Holding GmbH
      • Loadhog Limited
      • TranPak Inc.
      • Polymer Logistics
      • Enlightening Pallet Industry Co., Ltd.
      • Qingdao Guanyu Plastic Co., Ltd.
  21. Assumptions & Acronyms Used
  22. Research Methodology

List of Tables

  • Table 1: Global Market Value (USD Million) Forecast by Region, 2020 to 2035
  • Table 2: Global Market Value (USD Million) Forecast by Material Type , 2020 to 2035
  • Table 3: Global Market Value (USD Million) Forecast by Product Type, 2020 to 2035
  • Table 4: Global Market Value (USD Million) Forecast by Sales Channel, 2020 to 2035
  • Table 5: Global Market Value (USD Million) Forecast by End-Use, 2020 to 2035
  • Table 6: North America Market Value (USD Million) Forecast by Country, 2020 to 2035
  • Table 7: North America Market Value (USD Million) Forecast by Material Type , 2020 to 2035
  • Table 8: North America Market Value (USD Million) Forecast by Product Type, 2020 to 2035
  • Table 9: North America Market Value (USD Million) Forecast by Sales Channel, 2020 to 2035
  • Table 10: North America Market Value (USD Million) Forecast by End-Use, 2020 to 2035
  • Table 11: Latin America Market Value (USD Million) Forecast by Country, 2020 to 2035
  • Table 12: Latin America Market Value (USD Million) Forecast by Material Type , 2020 to 2035
  • Table 13: Latin America Market Value (USD Million) Forecast by Product Type, 2020 to 2035
  • Table 14: Latin America Market Value (USD Million) Forecast by Sales Channel, 2020 to 2035
  • Table 15: Latin America Market Value (USD Million) Forecast by End-Use, 2020 to 2035
  • Table 16: Western Europe Market Value (USD Million) Forecast by Country, 2020 to 2035
  • Table 17: Western Europe Market Value (USD Million) Forecast by Material Type , 2020 to 2035
  • Table 18: Western Europe Market Value (USD Million) Forecast by Product Type, 2020 to 2035
  • Table 19: Western Europe Market Value (USD Million) Forecast by Sales Channel, 2020 to 2035
  • Table 20: Western Europe Market Value (USD Million) Forecast by End-Use, 2020 to 2035
  • Table 21: Eastern Europe Market Value (USD Million) Forecast by Country, 2020 to 2035
  • Table 22: Eastern Europe Market Value (USD Million) Forecast by Material Type , 2020 to 2035
  • Table 23: Eastern Europe Market Value (USD Million) Forecast by Product Type, 2020 to 2035
  • Table 24: Eastern Europe Market Value (USD Million) Forecast by Sales Channel, 2020 to 2035
  • Table 25: Eastern Europe Market Value (USD Million) Forecast by End-Use, 2020 to 2035
  • Table 26: East Asia Market Value (USD Million) Forecast by Country, 2020 to 2035
  • Table 27: East Asia Market Value (USD Million) Forecast by Material Type , 2020 to 2035
  • Table 28: East Asia Market Value (USD Million) Forecast by Product Type, 2020 to 2035
  • Table 29: East Asia Market Value (USD Million) Forecast by Sales Channel, 2020 to 2035
  • Table 30: East Asia Market Value (USD Million) Forecast by End-Use, 2020 to 2035
  • Table 31: South Asia and Pacific Market Value (USD Million) Forecast by Country, 2020 to 2035
  • Table 32: South Asia and Pacific Market Value (USD Million) Forecast by Material Type , 2020 to 2035
  • Table 33: South Asia and Pacific Market Value (USD Million) Forecast by Product Type, 2020 to 2035
  • Table 34: South Asia and Pacific Market Value (USD Million) Forecast by Sales Channel, 2020 to 2035
  • Table 35: South Asia and Pacific Market Value (USD Million) Forecast by End-Use, 2020 to 2035
  • Table 36: Middle East & Africa Market Value (USD Million) Forecast by Country, 2020 to 2035
  • Table 37: Middle East & Africa Market Value (USD Million) Forecast by Material Type , 2020 to 2035
  • Table 38: Middle East & Africa Market Value (USD Million) Forecast by Product Type, 2020 to 2035
  • Table 39: Middle East & Africa Market Value (USD Million) Forecast by Sales Channel, 2020 to 2035
  • Table 40: Middle East & Africa Market Value (USD Million) Forecast by End-Use, 2020 to 2035

List of Figures

  • Figure 1: Global Market Pricing Analysis
  • Figure 2: Global Market Value (USD Million) Forecast 2020-2035
  • Figure 3: Global Market Value Share and BPS Analysis by Material Type , 2025 and 2035
  • Figure 4: Global Market Y to o to Y Growth Comparison by Material Type , 2025-2035
  • Figure 5: Global Market Attractiveness Analysis by Material Type
  • Figure 6: Global Market Value Share and BPS Analysis by Product Type, 2025 and 2035
  • Figure 7: Global Market Y to o to Y Growth Comparison by Product Type, 2025-2035
  • Figure 8: Global Market Attractiveness Analysis by Product Type
  • Figure 9: Global Market Value Share and BPS Analysis by Sales Channel, 2025 and 2035
  • Figure 10: Global Market Y to o to Y Growth Comparison by Sales Channel, 2025-2035
  • Figure 11: Global Market Attractiveness Analysis by Sales Channel
  • Figure 12: Global Market Value Share and BPS Analysis by End-Use, 2025 and 2035
  • Figure 13: Global Market Y to o to Y Growth Comparison by End-Use, 2025-2035
  • Figure 14: Global Market Attractiveness Analysis by End-Use
  • Figure 15: Global Market Value (USD Million) Share and BPS Analysis by Region, 2025 and 2035
  • Figure 16: Global Market Y to o to Y Growth Comparison by Region, 2025-2035
  • Figure 17: Global Market Attractiveness Analysis by Region
  • Figure 18: North America Market Incremental Dollar Opportunity, 2025-2035
  • Figure 19: Latin America Market Incremental Dollar Opportunity, 2025-2035
  • Figure 20: Western Europe Market Incremental Dollar Opportunity, 2025-2035
  • Figure 21: Eastern Europe Market Incremental Dollar Opportunity, 2025-2035
  • Figure 22: East Asia Market Incremental Dollar Opportunity, 2025-2035
  • Figure 23: South Asia and Pacific Market Incremental Dollar Opportunity, 2025-2035
  • Figure 24: Middle East & Africa Market Incremental Dollar Opportunity, 2025-2035
  • Figure 25: North America Market Value Share and BPS Analysis by Country, 2025 and 2035
  • Figure 26: North America Market Value Share and BPS Analysis by Material Type , 2025 and 2035
  • Figure 27: North America Market Y to o to Y Growth Comparison by Material Type , 2025-2035
  • Figure 28: North America Market Attractiveness Analysis by Material Type
  • Figure 29: North America Market Value Share and BPS Analysis by Product Type, 2025 and 2035
  • Figure 30: North America Market Y to o to Y Growth Comparison by Product Type, 2025-2035
  • Figure 31: North America Market Attractiveness Analysis by Product Type
  • Figure 32: North America Market Value Share and BPS Analysis by Sales Channel, 2025 and 2035
  • Figure 33: North America Market Y to o to Y Growth Comparison by Sales Channel, 2025-2035
  • Figure 34: North America Market Attractiveness Analysis by Sales Channel
  • Figure 35: North America Market Value Share and BPS Analysis by End-Use, 2025 and 2035
  • Figure 36: North America Market Y to o to Y Growth Comparison by End-Use, 2025-2035
  • Figure 37: North America Market Attractiveness Analysis by End-Use
  • Figure 38: Latin America Market Value Share and BPS Analysis by Country, 2025 and 2035
  • Figure 39: Latin America Market Value Share and BPS Analysis by Material Type , 2025 and 2035
  • Figure 40: Latin America Market Y to o to Y Growth Comparison by Material Type , 2025-2035
  • Figure 41: Latin America Market Attractiveness Analysis by Material Type
  • Figure 42: Latin America Market Value Share and BPS Analysis by Product Type, 2025 and 2035
  • Figure 43: Latin America Market Y to o to Y Growth Comparison by Product Type, 2025-2035
  • Figure 44: Latin America Market Attractiveness Analysis by Product Type
  • Figure 45: Latin America Market Value Share and BPS Analysis by Sales Channel, 2025 and 2035
  • Figure 46: Latin America Market Y to o to Y Growth Comparison by Sales Channel, 2025-2035
  • Figure 47: Latin America Market Attractiveness Analysis by Sales Channel
  • Figure 48: Latin America Market Value Share and BPS Analysis by End-Use, 2025 and 2035
  • Figure 49: Latin America Market Y to o to Y Growth Comparison by End-Use, 2025-2035
  • Figure 50: Latin America Market Attractiveness Analysis by End-Use
  • Figure 51: Western Europe Market Value Share and BPS Analysis by Country, 2025 and 2035
  • Figure 52: Western Europe Market Value Share and BPS Analysis by Material Type , 2025 and 2035
  • Figure 53: Western Europe Market Y to o to Y Growth Comparison by Material Type , 2025-2035
  • Figure 54: Western Europe Market Attractiveness Analysis by Material Type
  • Figure 55: Western Europe Market Value Share and BPS Analysis by Product Type, 2025 and 2035
  • Figure 56: Western Europe Market Y to o to Y Growth Comparison by Product Type, 2025-2035
  • Figure 57: Western Europe Market Attractiveness Analysis by Product Type
  • Figure 58: Western Europe Market Value Share and BPS Analysis by Sales Channel, 2025 and 2035
  • Figure 59: Western Europe Market Y to o to Y Growth Comparison by Sales Channel, 2025-2035
  • Figure 60: Western Europe Market Attractiveness Analysis by Sales Channel
  • Figure 61: Western Europe Market Value Share and BPS Analysis by End-Use, 2025 and 2035
  • Figure 62: Western Europe Market Y to o to Y Growth Comparison by End-Use, 2025-2035
  • Figure 63: Western Europe Market Attractiveness Analysis by End-Use
  • Figure 64: Eastern Europe Market Value Share and BPS Analysis by Country, 2025 and 2035
  • Figure 65: Eastern Europe Market Value Share and BPS Analysis by Material Type , 2025 and 2035
  • Figure 66: Eastern Europe Market Y to o to Y Growth Comparison by Material Type , 2025-2035
  • Figure 67: Eastern Europe Market Attractiveness Analysis by Material Type
  • Figure 68: Eastern Europe Market Value Share and BPS Analysis by Product Type, 2025 and 2035
  • Figure 69: Eastern Europe Market Y to o to Y Growth Comparison by Product Type, 2025-2035
  • Figure 70: Eastern Europe Market Attractiveness Analysis by Product Type
  • Figure 71: Eastern Europe Market Value Share and BPS Analysis by Sales Channel, 2025 and 2035
  • Figure 72: Eastern Europe Market Y to o to Y Growth Comparison by Sales Channel, 2025-2035
  • Figure 73: Eastern Europe Market Attractiveness Analysis by Sales Channel
  • Figure 74: Eastern Europe Market Value Share and BPS Analysis by End-Use, 2025 and 2035
  • Figure 75: Eastern Europe Market Y to o to Y Growth Comparison by End-Use, 2025-2035
  • Figure 76: Eastern Europe Market Attractiveness Analysis by End-Use
  • Figure 77: East Asia Market Value Share and BPS Analysis by Country, 2025 and 2035
  • Figure 78: East Asia Market Value Share and BPS Analysis by Material Type , 2025 and 2035
  • Figure 79: East Asia Market Y to o to Y Growth Comparison by Material Type , 2025-2035
  • Figure 80: East Asia Market Attractiveness Analysis by Material Type
  • Figure 81: East Asia Market Value Share and BPS Analysis by Product Type, 2025 and 2035
  • Figure 82: East Asia Market Y to o to Y Growth Comparison by Product Type, 2025-2035
  • Figure 83: East Asia Market Attractiveness Analysis by Product Type
  • Figure 84: East Asia Market Value Share and BPS Analysis by Sales Channel, 2025 and 2035
  • Figure 85: East Asia Market Y to o to Y Growth Comparison by Sales Channel, 2025-2035
  • Figure 86: East Asia Market Attractiveness Analysis by Sales Channel
  • Figure 87: East Asia Market Value Share and BPS Analysis by End-Use, 2025 and 2035
  • Figure 88: East Asia Market Y to o to Y Growth Comparison by End-Use, 2025-2035
  • Figure 89: East Asia Market Attractiveness Analysis by End-Use
  • Figure 90: South Asia and Pacific Market Value Share and BPS Analysis by Country, 2025 and 2035
  • Figure 91: South Asia and Pacific Market Value Share and BPS Analysis by Material Type , 2025 and 2035
  • Figure 92: South Asia and Pacific Market Y to o to Y Growth Comparison by Material Type , 2025-2035
  • Figure 93: South Asia and Pacific Market Attractiveness Analysis by Material Type
  • Figure 94: South Asia and Pacific Market Value Share and BPS Analysis by Product Type, 2025 and 2035
  • Figure 95: South Asia and Pacific Market Y to o to Y Growth Comparison by Product Type, 2025-2035
  • Figure 96: South Asia and Pacific Market Attractiveness Analysis by Product Type
  • Figure 97: South Asia and Pacific Market Value Share and BPS Analysis by Sales Channel, 2025 and 2035
  • Figure 98: South Asia and Pacific Market Y to o to Y Growth Comparison by Sales Channel, 2025-2035
  • Figure 99: South Asia and Pacific Market Attractiveness Analysis by Sales Channel
  • Figure 100: South Asia and Pacific Market Value Share and BPS Analysis by End-Use, 2025 and 2035
  • Figure 101: South Asia and Pacific Market Y to o to Y Growth Comparison by End-Use, 2025-2035
  • Figure 102: South Asia and Pacific Market Attractiveness Analysis by End-Use
  • Figure 103: Middle East & Africa Market Value Share and BPS Analysis by Country, 2025 and 2035
  • Figure 104: Middle East & Africa Market Value Share and BPS Analysis by Material Type , 2025 and 2035
  • Figure 105: Middle East & Africa Market Y to o to Y Growth Comparison by Material Type , 2025-2035
  • Figure 106: Middle East & Africa Market Attractiveness Analysis by Material Type
  • Figure 107: Middle East & Africa Market Value Share and BPS Analysis by Product Type, 2025 and 2035
  • Figure 108: Middle East & Africa Market Y to o to Y Growth Comparison by Product Type, 2025-2035
  • Figure 109: Middle East & Africa Market Attractiveness Analysis by Product Type
  • Figure 110: Middle East & Africa Market Value Share and BPS Analysis by Sales Channel, 2025 and 2035
  • Figure 111: Middle East & Africa Market Y to o to Y Growth Comparison by Sales Channel, 2025-2035
  • Figure 112: Middle East & Africa Market Attractiveness Analysis by Sales Channel
  • Figure 113: Middle East & Africa Market Value Share and BPS Analysis by End-Use, 2025 and 2035
  • Figure 114: Middle East & Africa Market Y to o to Y Growth Comparison by End-Use, 2025-2035
  • Figure 115: Middle East & Africa Market Attractiveness Analysis by End-Use
  • Figure 116: Global Market - Tier Structure Analysis
  • Figure 117: Global Market - Company Share Analysis

Frequently Asked Questions

How big is the collapsible rigid containers market in 2025?

The global collapsible rigid containers market is estimated to be valued at USD 1.9 billion in 2025.

What will be the size of collapsible rigid containers market in 2035?

The market size for the collapsible rigid containers market is projected to reach USD 3.1 billion by 2035.

How much will be the collapsible rigid containers market growth between 2025 and 2035?

The collapsible rigid containers market is expected to grow at a 4.9% CAGR between 2025 and 2035.

What are the key product types in the collapsible rigid containers market?

The key product types in collapsible rigid containers market are plastic , metal and others.

Which product type segment to contribute significant share in the collapsible rigid containers market in 2025?

In terms of product type, crates segment to command 42.8% share in the collapsible rigid containers market in 2025.

Explore Similar Insights

Future Market Insights

Collapsible Rigid Containers Market

Chat With MaRIA

Chat With

MaRIA

Hi There, I am MaRIA, Your Market Research Intelligence Assistant. How may I help you?