The cold plates market is expected to grow from USD 465.8 million in 2025 to USD 834.2 million by 2035, representing substantial growth, as the adoption of advanced liquid cooling systems and microchannel technologies accelerates across data center infrastructure, electric vehicle powertrains, and power electronics sectors.
The first half of the decade (2025-2030) will see the market increase from USD 465.8 million to approximately USD 624.4 million, adding USD 158.6 million in value, which constitutes 43% of the total forecasted growth period. This phase will be characterized by the rapid adoption of microchannel cold plate designs, driven by increasing AI/HPC computing demands and the growing need for efficient thermal dissipation in high-density electronics worldwide. Advanced vacuum-brazed aluminum technologies and liquid cooling infrastructure will become standard expectations rather than premium options.
The latter half (2030-2035) will witness sustained growth from USD 624.4 million to USD 834.2 million, representing an addition of USD 209.4 million or 57% of the decade's expansion. This period will be defined by mass market penetration of immersion and direct-to-chip cooling systems, integration with comprehensive data center infrastructure platforms, and seamless compatibility with existing power electronics architectures. The market trajectory signals fundamental shifts in how thermal engineers approach heat dissipation optimization and power density management, with participants positioned to benefit from sustained demand across multiple product types and end-use segments.
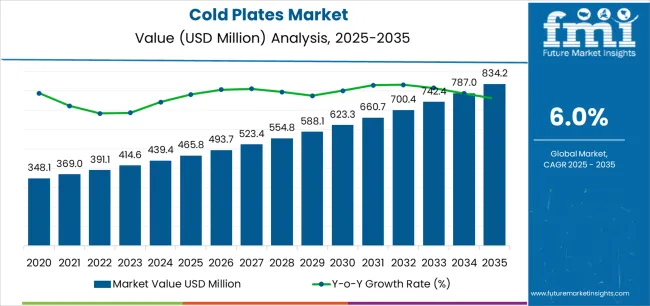
The cold plates market demonstrates distinct growth phases with varying market characteristics and competitive dynamics. Between 2025 and 2030, the market progresses through its AI infrastructure acceleration phase, expanding from USD 465.8 million to USD 624.4 million with steady annual increments averaging 6.0% growth. This period showcases the transition from traditional air cooling to liquid cooling systems with enhanced thermal conductivity and integrated microchannel architectures becoming mainstream features.
The 2025-2030 phase adds USD 158.6 million to market value, representing 43% of total decade expansion. Market maturation factors include standardization of liquid cooling protocols, declining unit costs for vacuum-brazed cold plates, and increasing data center awareness of thermal efficiency benefits reaching 250-400 W/cm² heat flux management in high-performance computing applications. Competitive landscape evolution during this period features established thermal management companies like Parker Hannifin and Boyd Corporation expanding their cold plate portfolios while specialty manufacturers focus on advanced microchannel development and enhanced heat transfer capabilities.
From 2030 to 2035, market dynamics shift toward edge computing proliferation and global EV adoption acceleration, with growth continuing from USD 624.4 million to USD 834.2 million, adding USD 209.4 million or 57% of total expansion. This phase transition focuses on the integration of direct liquid cooling, deployment with two-phase cooling systems, and implementation across diverse power electronics scenarios, making it a standard rather than a specialized application. The competitive environment matures with focus shifting from basic thermal management to comprehensive cooling optimization systems and integration with building management and vehicle thermal architectures.
| Metric | Value |
|---|---|
| Market Value (2025) | USD 465.8 million |
| Market Forecast (2035) | USD 834.2 million |
| Growth Rate | 6.0% CAGR |
| Leading Product | Vacuum-brazed cold plates |
| Primary Application | High-powered electronics Segment |
The market demonstrates strong fundamentals with vacuum-brazed cold plates capturing a dominant share through advanced thermal conductivity and manufacturing precision capabilities. High-powered electronics applications drive primary demand, supported by increasing power density requirements and thermal management challenges. Geographic expansion remains concentrated in developed markets with established electronics manufacturing infrastructure, while emerging economies show accelerating adoption rates driven by data center construction and EV production localization.
Market expansion rests on three fundamental shifts driving adoption across the electronics cooling and thermal management sectors.
The AI and high-performance computing proliferation creates compelling thermal demand through cold plate systems that enable chip-level heat dissipation without throttling performance, supporting data center operators' infrastructure missions while maintaining computational efficiency and reducing cooling energy consumption.
The electric vehicle adoption accelerates as automotive manufacturers worldwide seek advanced thermal management for battery packs and power electronics, enabling optimal temperature control that aligns with safety standards and extends component lifespan regulations.
The power electronics density increases through wide-bandgap semiconductor adoption requiring superior cooling solutions that minimize thermal resistance while maintaining compact form factors during high-power conversion operations. The growth faces headwinds from manufacturing complexity that varies across joining techniques regarding vacuum brazing process control and microchannel fabrication tolerances, which may limit adoption in cost-sensitive applications. Technical limitations also persist regarding coolant compatibility and pressure drop optimization that may reduce system efficiency in poorly designed installations, affecting overall thermal performance and pump power requirements.
The cold plates market represents a critical thermal management opportunity driven by expanding AI computing infrastructure, electric vehicle electrification, and the need for efficient heat dissipation in high-power electronics applications. As system designers worldwide seek to manage heat fluxes exceeding 250 W/cm², reduce cooling energy consumption, and integrate advanced liquid cooling with existing infrastructure, cold plates are evolving from basic heat exchangers to sophisticated thermal solutions ensuring performance reliability and energy efficiency.
The convergence of computing power density increases, EV power electronics requirements, and 5G infrastructure deployment creates sustained demand drivers across multiple technology segments. The market's growth trajectory from USD 465.8 million in 2025 to USD 834.2 million by 2035 at a 6.0% CAGR reflects fundamental shifts in thermal management requirements and cooling technology optimization.
Geographic expansion opportunities are particularly pronounced in Asia-Pacific markets, where ASEAN (11.8% CAGR) and the United Kingdom (9.8% CAGR) lead through data center construction and electronics manufacturing expansion. The dominance of vacuum-brazed cold plates (35.0% market share) and high-powered electronics applications (40.0% share) provides clear strategic focus areas, while emerging microchannel technologies and two-phase cooling systems open new revenue streams.
Strengthening the dominant vacuum-brazed segment (35.0% market share) through enhanced joint integrity, superior thermal performance, automated brazing systems, and seamless integration with microchannel architectures. This pathway focuses on optimizing brazing cycles, improving filler metal dispersion, extending operational life to 100,000+ hours, and developing specialized designs for diverse cooling requirements. Market leadership consolidation through advanced metallurgy and comprehensive quality assurance enables premium positioning while defending competitive advantages. Expected revenue pool: USD 85-140 million
Expansion within high-powered electronics applications (40.0% market share) through data center accelerator cooling (37.0% sub-segment), power conversion thermal management (33.0%), and comprehensive solutions for GPU and AI chip cooling. This pathway encompasses high heat flux management, low thermal resistance designs, modular installation systems, and compatibility with rack-level distribution. Premium positioning reflects proven performance, system reliability, and comprehensive technical support. Expected revenue pool: USD 95-155 million
Strengthening aluminum material dominance (62.0% market share) through 6xxx wrought alloy optimization (58.0% sub-segment), Al-Cu hybrid base development (19.0%), and advanced composite integration (15.0%) for enhanced thermal conductivity. This pathway addresses weight reduction, corrosion resistance, thermal interface optimization, and cost-effective manufacturing for volume applications. Technology differentiation through alloy selection and surface treatment enables competitive advantages. Expected revenue pool: USD 75-125 million
Strategic expansion within EV and mobility applications (28.0% market share) requires specialized battery cooling plates, inverter thermal solutions, and comprehensive vehicle thermal architecture integration. This pathway addresses fast-charging thermal loads, compact packaging requirements, automotive qualification standards, and long-term reliability for 8-10 year vehicle lifecycles. Premium pricing reflects automotive certification, supply chain integration, and comprehensive validation programs. Expected revenue pool: USD 70-115 million
Development within data center and telecom segment (24.0% market share) addressing rack-level liquid cooling, 5G base station thermal management, and edge computing infrastructure. This pathway encompasses modular CDU integration, hot-water cooling compatibility, PUE optimization, and comprehensive monitoring integration. Premium positioning through data center expertise and infrastructure partnership capabilities creates strategic opportunities. Expected revenue pool: USD 60-100 million
Integration of advanced microchannel designs (44.0% of vacuum-brazed segment) enabling ultra-high heat flux management, reduced thermal resistance, and compact form factors for AI accelerators and HPC applications. This pathway encompasses sub-millimeter channel geometries, advanced flow distribution, two-phase cooling compatibility, and extensive CFD optimization. Premium positioning through technology leadership creates differentiation opportunities. Expected revenue pool: USD 50-85 million
Rapid electronics manufacturing growth across ASEAN (11.8% CAGR) creates opportunities through local production capacity, semiconductor fab partnerships, and comprehensive supply chain development. Growing data center construction, EV supply chain localization, and electronics export manufacturing drive sustained demand for thermal solutions. Localization strategies reduce lead times and enable regional customization. Expected revenue pool: USD 45-75 million
Primary Classification: The market segments by product/manufacturing method into Vacuum-brazed cold plates, Microchannel designs, and other manufacturing approaches, representing the evolution from basic machined cold plates to advanced thermal solutions for comprehensive heat dissipation optimization.
Secondary Classification: Application segmentation divides the market into High-powered electronics, Data center & AI accelerators, Power conversion, Telecom/5G radios, and Industrial motion drives sectors, reflecting distinct requirements for thermal performance, reliability, and system integration.
Tertiary Classification: Material segmentation encompasses Aluminum (6xxx wrought, Al-Cu hybrid, Al composites), Copper, and other materials, while end-use segmentation includes EV & Mobility, Data center & Telecom, Industrial & Power, Medical, and Aerospace & Defense.
Regional Classification: Geographic distribution covers North America, Europe, Asia Pacific, Latin America, and the Middle East & Africa, with developed markets leading adoption while emerging economies show accelerating growth patterns driven by electronics manufacturing expansion programs.
Market Position: Vacuum-brazed cold plates command the leading position in the cold plates market with approximately 35.0% market share through superior thermal performance features, including microchannel designs for AI/HPC (44.0% sub-segment), EV battery/inverter modules (32.0%), medical & laser systems (16.0%), and aerospace/defense electronics (8.0%) that enable thermal engineers to achieve optimal heat dissipation across demanding high-power applications.
Value Drivers: The segment benefits from design engineer preference for reliable joining methods providing hermetic seals, minimal thermal interface resistance, and structural integrity without requiring mechanical fasteners. Vacuum brazing enables complex internal geometries, integrated manifolds, and multi-pass configurations, where joint quality and thermal conductivity represent critical performance requirements.
Competitive Advantages: Vacuum-brazed systems differentiate through proven leak-free operation, consistent thermal performance, and compatibility with corrosive coolants that enhance system reliability while maintaining optimal heat transfer suitable for mission-critical electronics cooling applications.
Key market characteristics:
Microchannel cold plates within the vacuum-brazed category maintain 44.0% sub-segment share through ultra-high heat flux capability for AI accelerators and HPC processors. These advanced designs appeal to data center operators requiring maximum thermal performance in minimal footprint for GPU and ASIC cooling. Market growth is driven by AI computing proliferation emphasizing liquid cooling for next-generation processor thermal management.
Alternative manufacturing approaches including friction stir welding, diffusion bonding, and deep-drilled configurations hold collective market share focusing on cost-sensitive applications and rapid prototyping scenarios requiring manufacturing flexibility without vacuum brazing infrastructure investment.
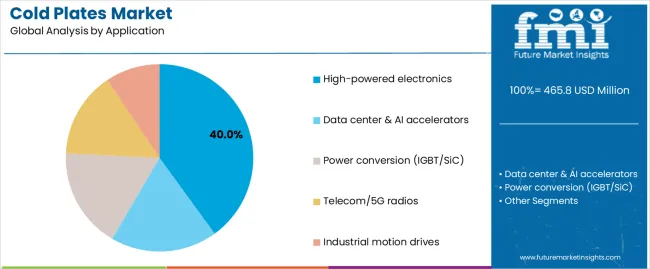
Market Context: High-powered electronics applications dominate the cold plates market with approximately 40.0% market share due to escalating power density trends and increasing focus on thermal management optimization, including data center & AI accelerators (37.0%), power conversion systems with IGBT/SiC devices (33.0%), telecom/5G radio equipment (18.0%), and industrial motion drives (12.0%) that collectively enable reliable operation while minimizing thermal throttling across demanding electronics applications.
Appeal Factors: Electronics designers prioritize thermal resistance minimization, system reliability enhancement, and integration with existing cooling infrastructure enabling coordinated thermal management across multi-chip modules and power electronics racks. The segment benefits from substantial data center investment and AI infrastructure programs emphasizing liquid cooling adoption for thermal efficiency applications.
Growth Drivers: AI accelerator deployment incorporates direct liquid cooling as standard thermal solution for GPU clusters exceeding 700W per chip, while power electronics adoption increases demand for cold plate systems supporting SiC and GaN device thermal management in traction inverters and industrial drives.
Market Challenges: Varying coolant specifications and pressure drop constraints may limit cold plate standardization across different system architectures or deployment scenarios.
Application dynamics include:
Data center and AI accelerator cooling captures 37.0% of the high-powered electronics segment through rack-level liquid cooling implementation, direct-to-chip thermal solutions, and immersion cooling infrastructure. These applications demand ultra-low thermal resistance capable of managing 300-500W per chip in high-density computing environments while maintaining operational reliability and energy efficiency.
Power conversion systems account for 33.0% of high-powered electronics applications, including IGBT modules, SiC inverters, and high-frequency converters requiring comprehensive thermal management for industrial drives, renewable energy systems, and electric vehicle powertrains.
Growth Accelerators: Artificial intelligence and high-performance computing proliferation drives primary adoption as cold plates enable direct liquid cooling supporting chip-level thermal management without performance throttling, enabling data center operators to deploy AI accelerators exceeding 700W TDP while maintaining computational efficiency and reducing total facility cooling energy consumption intensity. Electric vehicle production acceleration intensifies market expansion as automotive manufacturers seek advanced thermal management systems for battery packs, inverters, and charging systems that maintain optimal temperature ranges ensuring safety compliance, extending component lifespans, and enabling fast-charging capability during vehicle operation scenarios. Power electronics advancement increases worldwide through wide-bandgap semiconductor deployment including SiC and GaN devices generating higher heat fluxes in smaller packages, creating sustained demand for cold plate systems providing superior thermal conductivity that complement existing cooling infrastructure and enable higher power density conversion equipment across industrial, renewable energy, and transportation applications.
Growth Inhibitors: Manufacturing complexity and cost challenges vary across fabrication processes regarding vacuum brazing capital equipment requirements, microchannel machining tolerances, and quality control procedures, which may limit market penetration in cost-sensitive consumer electronics or price-competitive industrial segments where thermal management budget constraints restrict advanced cooling adoption. Coolant infrastructure limitations persist regarding facility chilled water availability, coolant distribution unit installation requirements, and maintenance expertise needs that may reduce deployment feasibility in legacy data centers or retrofit applications, affecting market addressability and adoption rates in brownfield installations. Market fragmentation across diverse application requirements and custom design specifications creates standardization difficulties between different OEM platforms and existing thermal architectures, requiring extensive engineering customization and validation that increase market development costs and extend commercialization timelines.
Market Evolution Patterns: Adoption accelerates in AI data centers and electric vehicle segments where thermal performance requirements justify liquid cooling investments and premium pricing, with geographic concentration in advanced technology markets transitioning toward mainstream deployment in enterprise computing and industrial applications driven by power density increases and thermal efficiency mandates. Technology development focuses on enhanced microchannel geometries, improved two-phase cooling integration, and compatibility with direct-to-chip cooling architectures optimizing thermal resistance and pumping power requirements through advanced computational fluid dynamics and additive manufacturing techniques. The market could face disruption if alternative cooling technologies including immersion cooling systems, thermoelectric devices, or advanced heat pipe solutions significantly change the deployment patterns of traditional cold plate thermal management in high-power electronics and computing infrastructure applications.
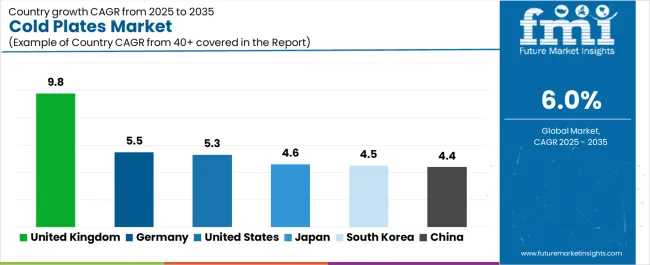
The cold plates market demonstrates varied regional dynamics with Growth Leaders including United Kingdom (9.8% CAGR) driving expansion through data center construction and renewable energy infrastructure. Steady Performers encompass Germany (5.5% CAGR), United States (5.3% CAGR), and Japan (4.6% CAGR), benefiting from established electronics manufacturing and automotive electrification. Mature Markets feature South Korea (4.5% CAGR) and China (4.4% CAGR), where semiconductor production and EV scaling support consistent growth patterns.
| Country/Region | CAGR (2025-2035) |
|---|---|
| United Kingdom | 9.8% |
| Germany | 5.5% |
| United States | 5.3% |
| Japan | 4.6% |
| South Korea | 4.5% |
| China | 4.4% |
Regional synthesis reveals Asia-Pacific markets leading adoption through electronics manufacturing expansion and data center investment acceleration, while European countries maintain steady growth supported by automotive electrification mandates and industrial automation advancement. North American markets show moderate growth driven by AI infrastructure deployment and EV production localization.
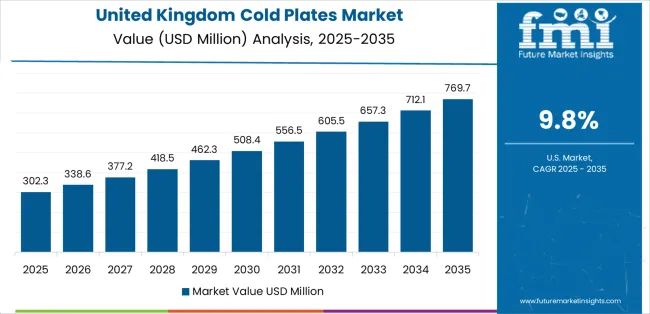
In London, Manchester, and emerging technology corridors, British data center operators and renewable energy developers are implementing advanced cold plate systems as standard thermal solutions for AI infrastructure and power electronics cooling, driven by increasing hyperscale data center construction and clean energy mandates emphasizing power conversion efficiency that require superior thermal management capabilities. The market holds 9.8% CAGR, supported by government digital infrastructure investments and net-zero commitments promoting energy-efficient cooling technologies for data center and industrial applications. UK facilities adopt liquid cooling systems providing PUE optimization and waste heat recovery, particularly appealing in regions where energy costs and carbon reduction represent critical operational and regulatory requirements.
Market expansion benefits from growing AI computing demand and renewable energy integration requiring advanced power electronics thermal management for grid-scale inverters and energy storage systems. Technology adoption follows patterns established in financial services and telecommunications infrastructure, where reliability and efficiency drive procurement decisions and capital deployment.
Market Intelligence Brief:
Germany's advanced automotive market demonstrates robust cold plate adoption through comprehensive vehicle electrification programs, industrial automation systems requiring power electronics cooling, and SiC power converter platforms for renewable energy and traction applications leveraging precision thermal management expertise. The country maintains 5.5% CAGR driven by automotive industry transformation, industrial technology leadership, and comprehensive sustainability mandates supporting thermal efficiency optimization. German automotive suppliers showcase advanced cold plate integration in battery thermal management systems, inverter cooling, and onboard charging equipment where thermal performance directly impacts vehicle range, charging speed, and component longevity.
German engineering companies prioritize thermal modeling validation, long-term reliability testing, and automotive qualification standards in cooling system development, creating demand for premium cold plate systems with comprehensive validation documentation and performance guarantees. The market benefits from established automotive supply chain infrastructure and engineering expertise supporting advanced thermal solution development.
Market Intelligence Brief:
U.S. market expansion benefits from AI and HPC liquid cooling infrastructure deployment across hyperscale data centers, electric vehicle inverter and battery thermal management in domestic EV production, and advanced medical device applications requiring precision temperature control including MRI gradient coil cooling and laser systems. The country maintains 5.3% CAGR driven by technology industry investment, automotive manufacturing transformation, and medical device innovation requiring sophisticated thermal solutions. American data center operators prioritize energy efficiency optimization through advanced liquid cooling enabling higher rack densities while reducing facility-level cooling infrastructure and operational costs.
American thermal management companies emphasize application engineering support, rapid prototyping capabilities, and comprehensive CFD analysis in cold plate development, creating market differentiation through technical service excellence and custom solution design. Growing sustainability focus creates additional demand for efficient cooling systems enabling waste heat recovery and reduced water consumption.
Strategic Market Considerations:
Japan demonstrates steady market development with 4.6% CAGR, distinguished by precision electronics manufacturers' preference for high-quality cold plates integrating seamlessly with automated production equipment and providing reliable long-term operation in semiconductor manufacturing, industrial automation, and customized thermal solutions for specialty electronics applications. The market prioritizes advanced features including ultra-tight tolerances, comprehensive quality documentation, and validated thermal performance reflecting Japanese manufacturing industry expectations for technological sophistication and operational reliability.
South Korean electronics manufacturers and semiconductor producers implement advanced cold plate systems for power module cooling, battery production line equipment thermal management, and display manufacturing process control supporting precision temperature requirements. The market holds 4.5% CAGR driven by semiconductor capacity expansion, display technology advancement, and battery manufacturing scaling for domestic and export EV markets requiring robust thermal solutions for high-power equipment.
Market expansion benefits from established electronics manufacturing infrastructure and technology development capabilities supporting advanced cold plate design and production. The supply chain ecosystem supports rapid customization and qualification for demanding semiconductor and display manufacturing applications.
China's expansive manufacturing ecosystem demonstrates substantial cold plate adoption through large-scale electric vehicle production programs, comprehensive 5G telecommunications infrastructure deployment, and power electronics cooling systems supporting renewable energy integration and industrial automation applications leveraging cost-effective thermal management innovation. The country maintains 4.4% CAGR driven by EV market dominance, digital infrastructure expansion, and government-supported manufacturing capabilities advancing thermal efficiency standards. Chinese automotive manufacturers showcase advanced cold plate integration in battery thermal management systems, inverter cooling platforms, and charging infrastructure where thermal performance optimization enables competitive vehicle range, rapid charging capabilities, and extended component durability.
Chinese engineering firms emphasize production scalability, cost optimization strategies, and domestic supply chain integration in cooling system development, creating demand for high-volume cold plate manufacturing with standardized specifications and competitive pricing structures. The market benefits from established electronics manufacturing infrastructure and rapidly developing engineering capabilities supporting thermal solution commercialization.
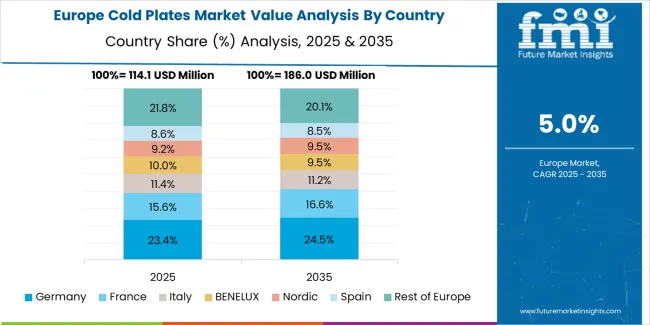
Europe is estimated at USD 130.4 million in 2025 (approximately 28.0% of the USD 465.8 million global market). Within Europe, demand is concentrated in EV and power electronics, data center liquid cooling infrastructure, medical devices, and industrial automation applications. Germany leads European consumption with 26% (USD 33.9 million), followed by United Kingdom 18% (USD 23.5 million), France 15% (USD 19.6 million), Italy 11% (USD 14.3 million), Nordics 10% (USD 13.0 million), Spain 9% (USD 11.7 million), Benelux 7% (USD 9.1 million), and Central & Eastern Europe 4% (USD 5.2 million). The regional market structure reflects vacuum-brazed aluminum plates as the dominant configuration for high-power electronics and IGBT drive applications across automotive, industrial, and data center sectors supporting European manufacturing competitiveness and sustainability objectives.
In Japan, the Cold Plates market prioritizes vacuum-brazed aluminum cold plate systems, which capture the dominant technology share through proven reliability and seamless integration with precision electronics manufacturing infrastructure. Japanese electronics manufacturers emphasize quality consistency, long-term durability, and comprehensive validation documentation, creating demand for premium cold plate systems providing superior thermal performance and extensive quality assurance based on demanding semiconductor equipment and industrial automation requirements for mission-critical cooling applications.
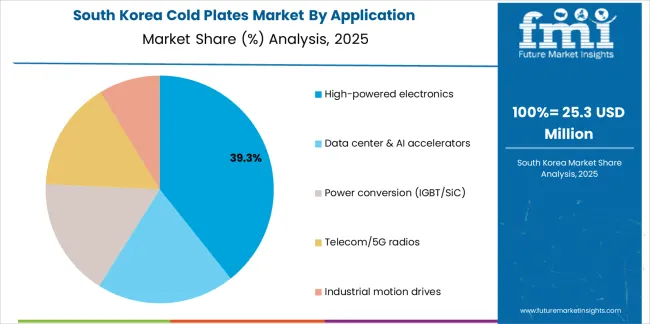
In South Korea, the market structure favors international thermal management manufacturers including Parker Hannifin, Boyd Corporation, and Fujikura, which maintain dominant positions through comprehensive product portfolios and established relationships with major electronics companies supporting semiconductor equipment, display manufacturing, and battery production installations. These providers offer integrated solutions combining advanced cold plate designs with professional thermal modeling services and ongoing application support appealing to Korean manufacturers seeking reliable cooling systems for high-value production equipment. Local thermal solution providers capture moderate market share through localized engineering support and competitive pricing for standard industrial applications.
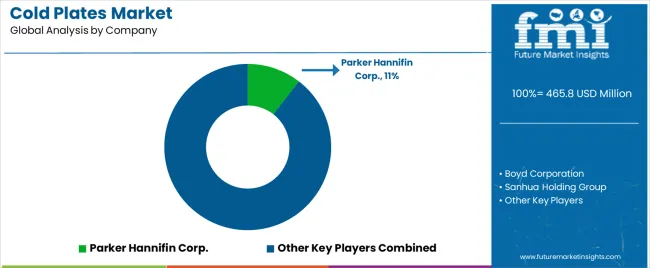
The cold plates market operates with moderate concentration, featuring approximately 15-25 meaningful participants, where leading companies control roughly 45-50% of the global market share through established OEM relationships and comprehensive thermal engineering capabilities. Parker Hannifin Corp. maintains the leading position with approximately 10.5% market share through extensive thermal management expertise and diversified industrial presence. Competition emphasizes thermal performance, design customization capability, and application engineering support rather than price-based rivalry.
Market Leaders encompass Parker Hannifin Corp., Boyd Corporation, and Sanhua Holding Group, which maintain competitive advantages through extensive thermal engineering expertise, global manufacturing footprints, and comprehensive design and validation capabilities creating customer loyalty and supporting premium pricing. These companies leverage decades of thermal management experience and ongoing R&D investments to develop advanced cold plate designs with optimized microchannel geometries, enhanced thermal conductivity, and proven reliability.
Technology Innovators include AMS Technologies, Fujikura Ltd., and Dana Limited, which compete through specialized cooling technology focus and innovative manufacturing processes that appeal to OEMs seeking advanced thermal solutions for next-generation electronics. These companies differentiate through rapid custom design cycles and specialized high-heat-flux application expertise.
Regional Specialists feature companies like Sumitomo Precision Products, Columbia-Staver Ltd., and Wieland Microcool, which focus on specific geographic markets and specialized applications including aerospace, medical devices, and industrial power. Market dynamics favor participants that combine reliable thermal performance with comprehensive engineering services including CFD analysis, thermal testing, and application optimization support. Competitive pressure intensifies as traditional heat exchanger manufacturers expand into electronics cooling while specialized microchannel developers challenge established players through innovative additive manufacturing and advanced joining technologies targeting AI data center and EV powertrain segments.
| Item | Value |
|---|---|
| Quantitative Units | USD 465.8 million |
| Product/Manufacturing Method | Vacuum-brazed cold plates, Microchannel designs, Other manufacturing methods |
| Application | High-powered electronics, Data center & AI accelerators, Power conversion, Telecom/5G radios, Industrial motion drives |
| Material | Aluminum (6xxx wrought, Al-Cu hybrid, Al composites), Copper, Others |
| End Use | EV & Mobility, Data center & Telecom, Industrial & Power, Medical, Aerospace & Defense |
| Regions Covered | North America, Europe, Asia Pacific, Latin America, Middle East & Africa |
| Countries/Regions Covered | ASEAN, United Kingdom, Germany, United States, Japan, South Korea, China, and 25+ additional countries |
| Key Companies Profiled | Parker Hannifin Corp., Boyd Corporation, Sanhua Holding Group, AMS Technologies, Fujikura Ltd., Dana Limited |
| Additional Attributes | Dollar sales by product type and application categories, regional adoption trends across Asia-Pacific, Europe, and North America, competitive landscape with thermal management specialists and electronics cooling providers, customer preferences for thermal resistance optimization and reliability performance, integration with liquid cooling infrastructure and facility thermal systems, innovations in microchannel geometries and vacuum brazing technology, and development of application-specific designs with enhanced heat transfer and manufacturing efficiency capabilities. |
The global cold plates market is estimated to be valued at USD 465.8 million in 2025.
The market size for the cold plates market is projected to reach USD 834.2 million by 2035.
The cold plates market is expected to grow at a 6.0% CAGR between 2025 and 2035.
The key product types in cold plates market are vacuum-brazed cold plates, microchannel designs and other manufacturing methods.
In terms of application, high-powered electronics segment to command 40.0% share in the cold plates market in 2025.


Full Research Suite comprises of:
Market outlook & trends analysis
Interviews & case studies
Strategic recommendations
Vendor profiles & capabilities analysis
5-year forecasts
8 regions and 60+ country-level data splits
Market segment data splits
12 months of continuous data updates
DELIVERED AS:
PDF EXCEL ONLINE
Liquid Cold Plates Market Size and Share Forecast Outlook 2025 to 2035
Cold Forging Machine Market Size and Share Forecast Outlook 2025 to 2035
Cold-Pressed Oil Market Size and Share Forecast Outlook 2025 to 2035
Cold Chain Packaging Market Size and Share Forecast Outlook 2025 to 2035
Cold-Chain Sensor Encapsulators Market Analysis - Size and Share Forecast Outlook 2025 to 2035
Cold-Pressed Fruit Extracts Market Size and Share Forecast Outlook 2025 to 2035
Cold Heading Wire Market Size and Share Forecast Outlook 2025 to 2035
Cold Water Swelling Starch Market Analysis - Size, Share, and Forecast Outlook 2025 to 2035
Cold Insulation Materials Market Size and Share Forecast Outlook 2025 to 2035
Cold Chain Monitoring Market Size and Share Forecast Outlook 2025 to 2035
Cold Finished Iron and Steel Bars and Bar Size Shapes Market Size and Share Forecast Outlook 2025 to 2035
Cold Storage Equipment Market Size and Share Forecast Outlook 2025 to 2035
Cold Laser Therapy Market Analysis - Size, Share & Forecast 2025 to 2035
Cold Mix Asphalt Market Size and Share Forecast Outlook 2025 to 2035
Cold Cuts Market Analysis - Size, Share, and Forecast 2025 to 2035
Cold Seal Paper Market Size and Share Forecast Outlook 2025 to 2035
Cold Pain Therapy Market Size and Share Forecast Outlook 2025 to 2035
Cold Chain Equipment Market Size and Share Forecast Outlook 2025 to 2035
Cold Chain Logistics Market Size and Share Forecast Outlook 2025 to 2035
Cold Formed Blister Foil Market Growth - Demand & Forecast 2025 to 2035

Thank you!
You will receive an email from our Business Development Manager. Please be sure to check your SPAM/JUNK folder too.
Chat With
MaRIA