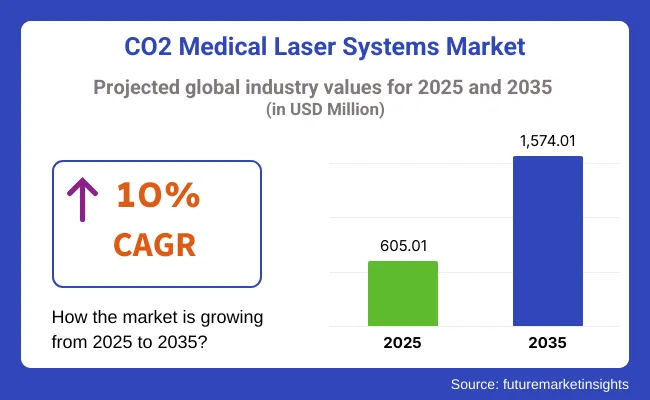
The global CO2 Medical Laser Systems Market is estimated to be valued at USD 605.01 million in 2025 and is projected to reach USD 1,574.01 million by 2035, registering a CAGR of 10.0% over the forecast period.

The CO2 medical laser systems market has experienced steady growth, supported by expanding aesthetic procedures, technological advancements in fractional and ultrapulsed laser platforms, and a rising preference for minimally invasive treatments across medical specialties.
Healthcare providers have increasingly adopted CO2 laser systems due to their precision in tissue ablation, reduced collateral damage, and versatility in dermatology, gynecology, and ENT procedures. Manufacturers have invested in enhancing system ergonomics, integrated cooling technologies, and user-friendly interfaces to improve clinician workflow and patient outcomes.
Dermatology segment holds a revenue share of 25.2% in the overall CO2 Medical Laser market due to its pivotal role in in the treatment of acne and scars. The market is supported by growing patient demand for wrinkle reduction, scar revision, and skin rejuvenation treatments that offer predictable outcomes with minimal recovery time.
Clinical guidelines have recognized CO2 lasers as highly effective for ablative resurfacing and treatment of benign skin lesions. Advances in fractional laser technology have improved safety profiles by allowing controlled microthermal zones, reducing complications, and broadening patient eligibility. Dermatology practices have prioritized CO2 systems for their versatility and return on investment through a wide range of aesthetic and medical applications.
Specialty clinics have accounted for 41.6% of market revenue, driven by their central role in delivering elective aesthetic and therapeutic laser treatments. Clinics have invested in CO2 laser platforms due to their broad application range, consistent clinical outcomes, and ability to attract self-pay patients seeking minimally invasive options.
Marketing strategies have emphasized safety, efficacy, and shorter recovery times, further increasing patient volumes. Reimbursement policies have had a limited impact on aesthetic treatments, supporting cash-based revenue models that improve clinic profitability. Training programs and certifications have strengthened clinician expertise, driving adoption of advanced systems.
The medical lasers segment is anticipated to lead during the forecast period, due to an increase in demand for minimally invasive procedures, an upsurge in technological advancements, and their growing application in dermatology, gynecology, and oncology.
Major beneficiaries comprise medical device manufacturers, healthcare providers, and patients looking for advanced treatment options, whereas traditional surgical equipment manufacturers may be impacted negatively with increasing adoption of lasers. It is also expected to be driven by emerging industries and continued R&D investments that will fuel further industry expansion.
Invest in Technological Advancements
Executives should prioritize R&D investments in AI-powered precision laser systems, portable CO2 lasers, and energy-efficient technologies. Innovations that improve safety, efficacy, and affordability will provide a competitive edge and expand industry penetration across medical applications.
Align with Evolving Market and Client Needs
Companies must adapt to the rising demand for minimally invasive procedures by expanding product portfolios to cater to dermatology, gynecology, ophthalmology, and other key segments. Aligning with healthcare trends, regulatory shifts, and evolving patient preferences will be crucial for sustained growth.
Expand Strategic Partnerships and M&A Activities
Stakeholders should pursue collaborations with hospitals, specialty clinics, and OEMs while exploring acquisitions of emerging laser technology firms. Strengthening distribution networks and expanding into high-growth regions like East and South Asia will enhance industry reach and revenue streams.
| Risk | Probability & Impact |
|---|---|
| Regulatory and Compliance Changes | High Probability - High Impact |
| High Initial Costs and Limited Reimbursement Policies | Medium Probability - High Impact |
| Technological Disruptions and Competitive Pressures | Medium Probability - Medium Impact |
| Priority | Immediate Action |
|---|---|
| Technology Development | Accelerate AI-powered and portable CO2 laser R&D |
| Market Expansion | Identify and establish partnerships in emerging industries |
| Regulatory Readiness | Strengthen compliance strategies for evolving global regulations |
To stay ahead in the evolving CO2 medical laser systems industry, stakeholders must act swiftly on innovation, strategic expansion, and regulatory preparedness. Investing in next-generation CO2 laser technology, strengthening partnerships with hospitals and clinics, and expanding into high-growth regions will drive sustained growth. Market differentiation will come from AI integration, affordability improvements, and enhanced clinical outcomes, ensuring long-term industry leadership.
(Surveyed Q4 2024, n=500 stakeholder participants evenly distributed across manufacturers, healthcare providers, regulatory experts, and distributors in North America, Europe, East Asia, and South Asia.
Regional Variance:
High Variance:
Convergent and Divergent Perspectives on ROI:
68% of North American stakeholders consider automation a "high-return investment," whereas only 27% in South Asia prefer investing in premium automated systems.
Consensus:
Titanium-Coated Optics: Selected by 67% overall due to superior durability and resistance to thermal degradation.
Variance:
Shared Challenges:
82% cited rising manufacturing costs due to inflation and increased raw material expenses.
Regional Differences:
Manufacturers:
Distributors:
Healthcare Providers:
Alignment:
76% of global manufacturers plan to invest in AI-driven laser precision and automation.
Divergence:
North America:
71% reported FDA device classification changes as a significant factor influencing R&D investments.
Europe:
79% viewed the EU MDR and sustainability mandates as key drivers for premium CO2 laser adoption.
East Asia/South Asia:
Only 35% felt regulatory frameworks significantly impacted purchasing decisions due to weaker enforcement mechanisms.
High Consensus:
The industry agrees on compliance, innovation, and cost management as universal challenges.
Key Variances:
Strategic Insight:
| Countries /Regions | Policies, Regulations & Certifications |
|---|---|
| United States | The FDA (Food and Drug Administration) classifies CO2 medical lasers as Class II or III medical devices, requiring 510(k) clearance or Premarket Approval (PMA) for high-risk applications. HIPAA compliance is mandatory for data security in AI-assisted laser systems. The CMS (Centers for Medicare & Medicaid Services) reimbursement policies influence hospital adoption rates. |
| European Union | The Medical Device Regulation (MDR 2017/745) imposes strict safety, efficacy, and post- industry surveillance requirements. CE Marking is mandatory for industry entry, ensuring compliance with EU health and safety standards. The EU Green Deal encourages the adoption of sustainable, energy-efficient medical technologies. |
| China | The National Medical Products Administration (NMPA) regulates medical devices, requiring CFDA (China Food and Drug Administration) approval for imported CO2 laser systems. Stricter quality control regulations have increased the approval time for foreign manufacturers. GB/T standards define safety and performance benchmarks. |
| Japan | The Pharmaceuticals and Medical Devices Act (PMDA) mandates rigorous testing and certification for medical lasers. JPAL (Japanese Pharmaceutical Affairs Law) requires foreign companies to partner with a local registered entity to distribute CO2 laser systems. ISO 13485 certification is highly recommended for industry entry. |
| India | The Central Drugs Standard Control Organization (CDSCO) classifies CO2 medical lasers under Medical Device Rules, 2017. Manufacturers must obtain a Form MD-15 license for import and distribution. The lack of universal healthcare coverage slows industry growth despite rising medical tourism. |
| South Korea | The Ministry of Food and Drug Safety (MFDS) regulates CO2 laser devices, requiring KGMP (Korean Good Manufacturing Practice) certification. The government provides incentives for local manufacturing but imposes strict post- industry surveillance requirements. |
| Brazil | The ANVISA ( Agência Nacional de Vigilância Sanitária ) regulates medical lasers under Resolution RDC 185/2001, requiring stringent clinical testing. Import restrictions and high tariffs make it challenging for foreign manufacturers to enter the industry . |
| Australia | The Therapeutic Goods Administration (TGA) enforces ARTG (Australian Register of Therapeutic Goods) certification for CO2 laser systems. Compliance with ISO 13485 and IEC 60601 safety standards is necessary for approval. |
| Middle East (UAE, Saudi Arabia) | The SFDA (Saudi Food and Drug Authority) and MOH (Ministry of Health UAE) require SFDA/MOH registration for medical lasers. GCC Standardization Organization (GSO) approvals are often required for broader regional distribution. |

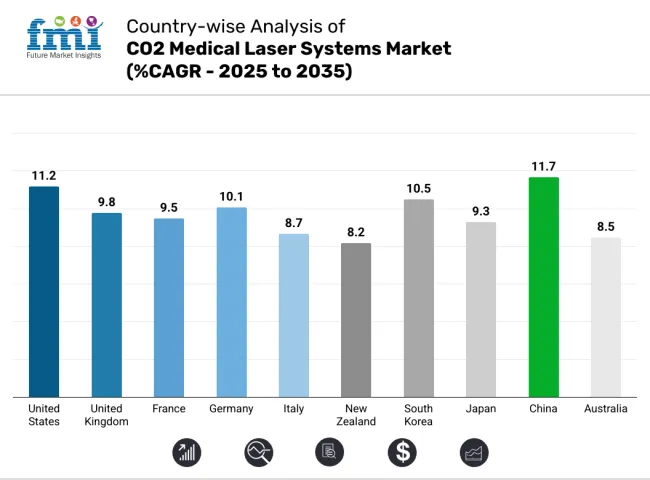
The CO2 medical laser systems industry in the United States is expected to grow at a CAGR of 11.2% from 2025 to 2035, driven by increasing demand for minimally invasive cosmetic and surgical procedures. The widespread adoption of laser-based dermatology treatments, including skin resurfacing and scar removal, is a key growth driver. Advanced healthcare infrastructure, high disposable income, and favorable reimbursement policies further support industry expansion.
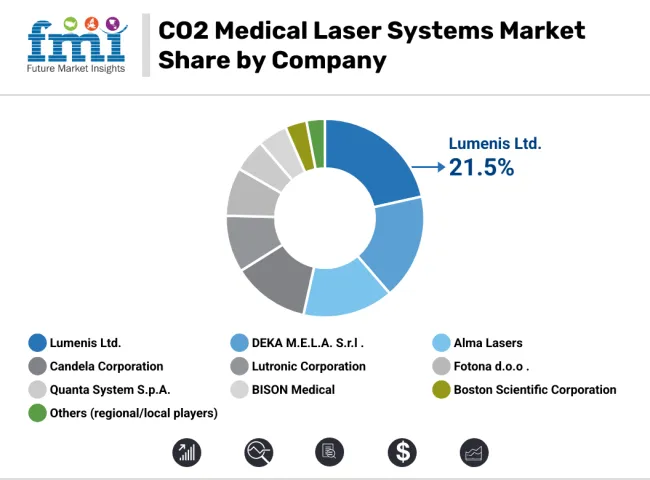
Additionally, the presence of key players such as Lumenis, Candela, and Boston Scientific ensures a competitive landscape with continuous innovation. Regulatory approvals from the FDA (Food and Drug Administration) set stringent quality standards, promoting the adoption of advanced and AI-integrated laser systems. With growing investments in research and clinical trials, the USA industry is expected to maintain its position as a global leader in CO2 laser technology.
The United Kingdom’s CO2 medical laser systems industry is set to expand at a CAGR of 9.8% from 2025 to 2035, fueled by rising demand for aesthetic and minimally invasive medical procedures. The increasing popularity of laser treatments for skin rejuvenation, acne scars, and gynecological applications is driving adoption across hospitals and specialty clinics.
The presence of NHS-backed clinical research on laser therapies is accelerating technological advancements and regulatory approvals. Growing medical tourism, particularly in London, is another factor attracting investments in high-end laser technologies. However, Brexit-related regulatory adjustments pose challenges for international manufacturers seeking industry entry. Still, increasing awareness of minimally invasive laser procedures, coupled with strong R&D investments, is expected to drive significant industry expansion.
France’s CO2 medical laser systems industry is projected to witness a CAGR of 9.5% from 2025 to 2035, supported by increasing demand for dermatology, gynecology, and ophthalmology applications. The country has a strong presence of aesthetic medicine clinics, with a rising number of patients opting for laser-based skin resurfacing and anti-aging treatments.
A well-developed public and private healthcare sector, combined with government support for advanced medical technologies, is ensuring continuous innovation in laser systems. France also adheres to stringent EU MDR (Medical Device Regulation) standards, ensuring high safety and quality benchmarks for medical laser devices. The growing trend of AI-driven laser technologies and the expansion of outpatient facilities specializing in laser procedures are further propelling industry growth.
Germany’s CO2 medical laser systems industry is expected to expand at a CAGR of 10.1% from 2025 to 2035, owing to its advanced healthcare infrastructure and strong medical device manufacturing sector. The country has a high adoption rate of laser technologies across multiple applications, including dermatology, dentistry, and gynecology.
The demand for minimally invasive surgical procedures is growing, supported by an aging population and an increasing preference for non-surgical aesthetic treatments. Germany's strict regulatory framework, including CE certification and EU MDR compliance, ensures high-quality laser devices.
The country’s robust R&D sector, coupled with partnerships between medical institutions and laser technology firms, is driving continuous innovation. Moreover, the rising adoption of robotic-assisted laser surgeries in German hospitals and specialty clinics is further accelerating industry growth.
Italy’s CO2 medical laser systems industry is forecast to grow at a CAGR of 8.7% from 2025 to 2035, driven by the increasing popularity of cosmetic laser treatments and growing applications in dentistry and gynecology. The country has a well-developed aesthetic medicine industry, with a significant number of clinics offering laser-based skin rejuvenation and scar treatments. Additionally, the rising preference for non-invasive medical procedures is fueling demand for CO2 laser technology.
Italy follows EU MDR regulations, ensuring strict quality control and high safety standards for medical laser devices. The country also benefits from medical tourism, as international patients seek advanced yet affordable cosmetic laser procedures in cities like Milan and Rome. Growing investments in medical research and training programs for laser specialists are further strengthening industry prospects.
New Zealand’s CO2 medical laser systems industry is set to grow at a CAGR of 8.2% from 2025 to 2035, driven by increasing awareness of laser-based medical treatments and rising demand for cosmetic procedures. The country's well-established healthcare infrastructure supports the adoption of advanced laser technologies across dermatology, ophthalmology, and gynecology.
The regulatory landscape is evolving, with Medsafe (New Zealand Medicines and Medical Devices Safety Authority) playing a crucial role in ensuring compliance with international medical device standards. The rising influence of medical tourism, particularly for non-invasive aesthetic procedures, is contributing to industry growth. Additionally, the increasing presence of specialty clinics offering laser-based treatments is expected to enhance industry penetration over the coming years.
The CO2 medical laser systems industry in South Korea is projected to grow at a CAGR of 10.5% from 2025 to 2035, largely driven by the country’s booming cosmetic surgery industry. South Korea is a global hub for aesthetic procedures, with laser skin resurfacing and scar treatments becoming increasingly popular. The presence of cutting-edge medical technology and strong R&D investments in laser-based solutions further support industry growth.
The government has established strict medical regulations under the MFDS (Ministry of Food and Drug Safety), ensuring the safety and efficacy of laser devices. Moreover, growing partnerships between South Korean laser manufacturers and international players are expanding the industry's reach. The high adoption of AI-integrated laser systems in dermatology and plastic surgery clinics is expected to sustain strong demand throughout the forecast period.
Japan’s CO2 medical laser systems industry is anticipated to expand at a CAGR of 9.3% from 2025 to 2035, driven by increasing demand for non-invasive medical treatments and advancements in laser technology. The country has a strong focus on dermatological and ophthalmological applications, with a growing number of clinics offering advanced laser-based treatments.
Japan’s strict regulatory framework under the PMDA (Pharmaceuticals and Medical Devices Agency) ensures that only high-quality and rigorously tested laser systems are approved for use. Additionally, the growing elderly population is boosting demand for laser-based skin treatments and minimally invasive surgical procedures. With ongoing technological innovations and increasing R&D investments, the Japanese industry is expected to see steady growth over the forecast period.
China’s CO2 medical laser systems industry is forecast to witness a CAGR of 11.7% from 2025 to 2035, making it one of the fastest-growing industries globally. The rising demand for aesthetic and dermatology treatments, coupled with rapid advancements in medical technology, is fueling industry expansion.
China’s increasing healthcare spending and growing number of specialized clinics are driving the adoption of CO2 laser systems. The government has been actively regulating the medical device industry through the NMPA (National Medical Products Administration), ensuring high-quality standards for imported and locally manufactured laser devices. Additionally, the expansion of local manufacturers into international industries is boosting innovation and competition within the industry.
Australia’s CO2 medical laser systems industry is set to grow at a CAGR of 8.5% from 2025 to 2035, supported by rising consumer interest in aesthetic treatments and a strong regulatory framework. The country has a high adoption rate of laser-based cosmetic procedures, with increasing demand for treatments such as skin resurfacing and acne scar reduction. The TGA (Therapeutic Goods Administration) regulates medical lasers, ensuring stringent safety and performance standards.
Additionally, the growing influence of medical tourism, particularly in cities like Sydney and Melbourne, is attracting investments in advanced laser technology. The expansion of specialty clinics and outpatient centers offering laser-based procedures is further driving industry growth.
The competitive landscape has been shaped by companies investing in fractional CO2 laser technology, ergonomic handpieces, and advanced software to enhance treatment precision. Leading manufacturers have pursued regulatory approvals and global distribution partnerships to expand access in high-growth regions. Strategic collaborations with dermatology and aesthetic societies have been implemented to support clinical education and protocol development. Training initiatives and digital marketing campaigns have been launched to build practitioner confidence and accelerate adoption.

Key Development:
Dermatology, Ophthalmology, Gynecology, Urology, Dentistry, Cardiovascular, ENT
Hospitals, Outpatient Facilities, Specialty Clinics, Ambulatory Surgical Centers, Research & Manufacturing, Research Institutes, Academic Institutes
North America, Latin America, Europe, East Asia, South Asia, Oceania
The increasing preference for minimally invasive procedures, advancements in laser technology, and rising applications in dermatology, gynecology, and ophthalmology are major factors driving adoption. Additionally, growing awareness of laser-based treatments and expanding healthcare infrastructure contribute to widespread use.
CO2 laser systems offer higher precision, better tissue penetration, and improved coagulation properties compared to other laser types like Erbium or Nd:YAG lasers. These features make them ideal for applications requiring controlled ablation and minimal thermal damage.
Healthcare facilities, including hospitals, specialty clinics, and outpatient surgical centers, are the primary users. Additionally, research institutions and medical device manufacturers integrate these systems into advanced treatment and diagnostic applications.
Regulatory approvals vary by region, with agencies such as the FDA in the USA, CE certification in Europe, and NMPA in China ensuring compliance with safety and performance standards. Manufacturers must meet stringent guidelines before commercial distribution.
The integration of AI-assisted laser precision, robotic-assisted surgical applications, and improved cooling mechanisms are enhancing efficiency and patient outcomes. Additionally, portable and more energy-efficient models are expected to improve accessibility and affordability in healthcare settings.
Explore Similar Insights

Thank you!
You will receive an email from our Business Development Manager. Please be sure to check your SPAM/JUNK folder too.
Chat With
MaRIA