The CO2 Injector Market is estimated to be valued at USD 13.3 million in 2025 and is projected to reach USD 23.5 million by 2035, registering a compound annual growth rate (CAGR) of 5.9% over the forecast period.
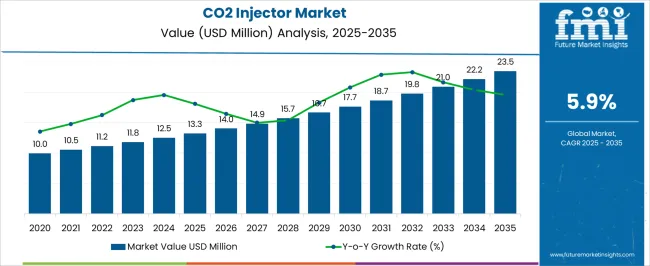
| Metric | Value |
|---|---|
| CO2 Injector Market Estimated Value in (2025 E) | USD 13.3 million |
| CO2 Injector Market Forecast Value in (2035 F) | USD 23.5 million |
| Forecast CAGR (2025 to 2035) | 5.9% |
The CO2 injector market is experiencing robust growth. Rising demand for minimally invasive imaging procedures, increasing adoption of advanced contrast agents, and growing preference for patient-friendly diagnostic solutions are driving market expansion.
Current market dynamics are influenced by technological advancements in automated injection systems, regulatory approvals for medical devices, and growing awareness among healthcare professionals. The future outlook is shaped by the expansion of interventional radiology procedures, rising prevalence of vascular and chronic diseases, and the enhancement of hospital infrastructure in both developed and emerging regions.
Growth rationale is founded on the clinical advantages offered by CO2 injectors, including reduced risk of adverse reactions, improved procedural efficiency, and compatibility with diverse imaging modalities Continuous product innovation, strategic partnerships with healthcare providers, and integration into hospital supply chains are expected to further support market penetration, ensuring sustained adoption and revenue growth across the forecast period.
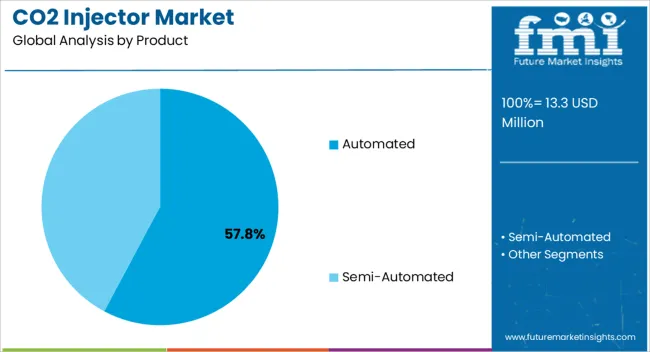
The automated product segment, accounting for 57.80% of the product category, has been leading due to its precision, ease of use, and reliability in delivering controlled CO2 doses. Adoption has been supported by its ability to improve procedural efficiency, minimize operator error, and enhance patient safety.
Integration with imaging systems has reinforced preference among interventional radiologists and hospital staff. Technological advancements, including automated monitoring and programmable injection protocols, have increased clinical confidence.
Regulatory compliance and quality assurance measures have further contributed to sustained market trust Continued focus on device innovation, training programs for clinicians, and strategic collaborations with medical institutions is expected to maintain the segment’s market share and drive growth in both established and emerging healthcare markets.
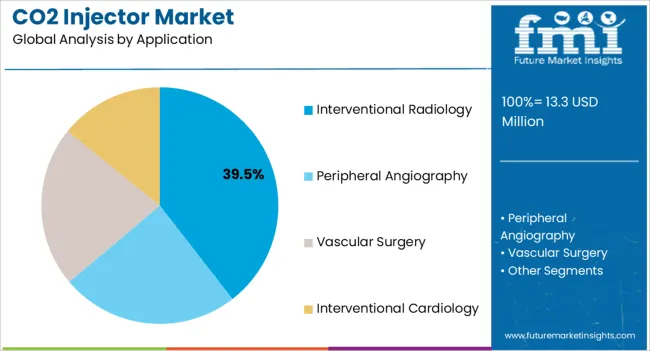
The interventional radiology application segment, representing 39.50% of the application category, has maintained prominence due to increasing procedural volumes and the growing adoption of minimally invasive imaging techniques. Adoption has been facilitated by the safety profile of CO2 as a contrast agent and its suitability for patients with iodine contrast allergies or renal impairment.
Integration into diagnostic workflows has enhanced procedural efficiency, while clinical guidelines and physician preference have reinforced usage. Technological improvements in injector systems have supported accuracy and consistency during interventions.
Expanding hospital capacities and the increasing prevalence of vascular and chronic conditions are expected to sustain the segment’s market share and drive incremental growth over the forecast horizon.
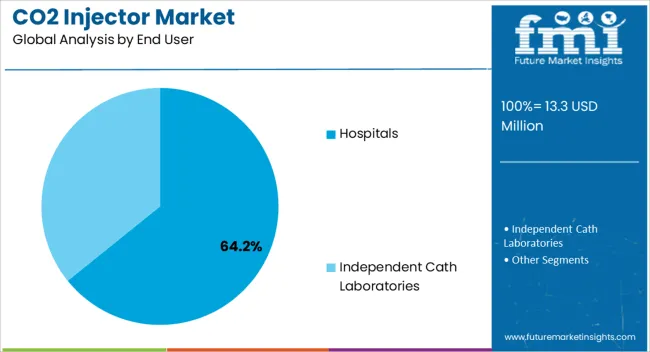
The hospitals end-user segment, holding 64.20% of the end-user category, has emerged as the leading channel due to high procedural volumes and centralized procurement capabilities. Adoption has been driven by established infrastructure, trained personnel, and integration of CO2 injectors into routine interventional radiology procedures.
Hospital-based availability ensures timely access for both inpatient and outpatient interventions, while partnerships with device manufacturers have enhanced inventory management and technical support. Operational efficiencies, combined with institutional trust and regulatory adherence, have reinforced the segment’s market dominance.
Expansion of hospital networks, particularly in emerging markets, is expected to sustain segment share and support broader market penetration in the coming years.
Minimally Invasive Procedures to Push Demand for Gas Injection Units
CO2 injectors are expected to be an integral part of the healthcare sector with the rising demand for minimally invasive procedures. The growing need for quick recovery times, short hospital stays, and relatively low patient trauma is anticipated to drive the global demand for minimally invasive procedures.
Such innovative procedures are expected to be particularly relevant in emerging areas where healthcare infrastructure is limited, making it vital to optimize resource utilization. CO2 injectors are projected to be considered cost-effective alternatives to traditional contrast agents and surgical procedures. This affordability is set to make specialized interventions more attainable for patients and healthcare providers in resource-constrained settings.
Mobile clinics and remote healthcare facilities are anticipated to opt for CO2 injectors due to their high portability and versatility. Their high flexibility is estimated to reduce the need for extensive infrastructure investments. It is further expected to make it easier to provide specialized care in emerging nations.
Using CO2 injectors in training and skill development programs is expected to empower local healthcare professionals in emerging nations. These are set to effectively allow specialized procedures to initiate effectively, bolstering the capacity for quality care delivery. The aforementioned factors are anticipated to propel the CO2 injector market size in the estimated period.
Financial Strain to Hamper Demand for Carbon Dioxide Incubators
Using CO2 injectors in angiography is anticipated to offer a promising alternative to traditional iodinated contrast agents. However, multiple factors will likely impede the widespread adoption of CO2 injectors. The costs and availability issues are set to play a pivotal role in affecting demand through 2035.
While CO2 injectors have demonstrated efficacy in specific cases, their economic and logistical implications can pose challenges. These are set to restrict their integration into routine medical practices, particularly in certain medical facilities.
One of the key restraining factors is the financial burden associated with CO2 injectors and their related supplies. The initial investment required for procuring CO2 injector systems, specialized catheters, and other necessary equipment can be substantial.
Maintenance and servicing costs are projected to be higher than conventional systems, further contributing to the financial strain. This financial outlay can significantly deter medical institutions, especially those operating under constrained budgets.
The availability of CO2 injectors and related supplies is predicted to be a pressing concern. Renowned medical facilities often have well-established procurement channels for iodinated contrast agents, while CO2 systems can require the setting up of new distribution networks.
The relatively limited availability of CO2 injector technology compared to the widespread availability of conventional contrast agents can restrict access. This is particularly prevalent in regions with less developed medical infrastructure or resource-constrained settings.
The global CO2 injector market recorded a CAGR of 4.7% in the historical period from 2020 to 2025. It stood at a valuation of USD 11,147.8 thousand in 2025. The CO2 injection equipment industry is estimated to witness a CAGR of 6.2% in the assessment period.
| Historical CAGR (2025 to 2035) | 4.7% |
|---|---|
| Historical CO2 Injector Revenue (2025) | USD 11,147.8 thousand |
The demand for CO2 injectors in the realm of angiography and complex interventions is a compelling and dynamic demand-side trend redefining the healthcare landscape. The increasing reliance on CO2 injectors drives this trend to enhance the safety, precision, and success of intricate procedures, such as tumor ablation, endovascular interventions, and bariatric surgeries.
CO2 angiography is expected to gradually develop into a substitute for iodinated contrast, which is more frequently employed due to the advent of digital subtraction angiography. This is anticipated to be especially advantageous when the patient has impaired renal function or is intolerant to iodinated contrast.
Growing concerns about patient safety are also expected to bolster the market's demand for carbonation and CO2 injection solutions. Patients suffering from thyroid disorders, renal issues, or allergies are expected to present high demand. This is because conventional iodinated contrast agents used in angiography can pose risks.
The ability of CO2 angiography to provide a safer alternative owing to its non-allergenic nature is set to push demand. At the same time, the absence of nephrotoxic effects, unlike iodine-based contrast agents, is expected to make it a suitable choice for several healthcare professionals.
The increasing focus on reducing medical waste and environmental sustainability is also projected to aid the demand for CO2 angiography. It is expected to be highly demanded among clinicians as it can lower the environmental impact as carbon dioxide can be easily removed from the body. This will likely fulfill the sustainability goals of the healthcare sector, further propelling demand.
The table below provides the latest trends in the global CO2 injector market, growth obstacles, and upcoming opportunities. Appropriate business strategies for the CO2 injector market can enable stakeholders to invest in the right area and gain profit.
| Attributes | Key Factors |
|---|---|
| Latest Trends |
|
| Upcoming Opportunities |
|
| Challenges |
|
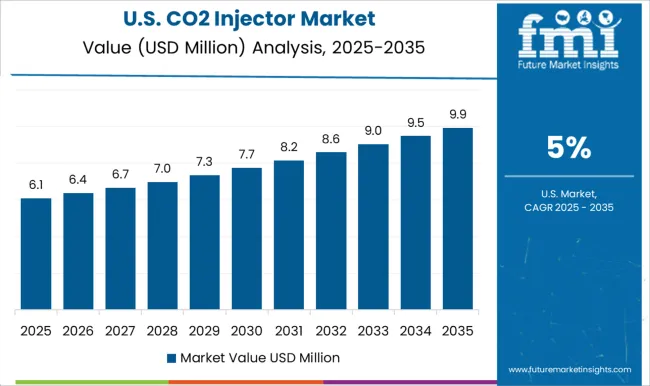
The United States CO2 injector market is set to expand at a CAGR of 6.5% in the forecast period. Increasing popularity of angiography procedures in the country is projected to drive CO2 injector demand through 2035.
According to the National Institutes of Health, around 13.3 million people were diagnosed with coronary artery disease in the United States in 2025. It was mainly driven by high-risk factors, such as obesity, diabetes, high blood pressure (HBP), and high cholesterol.
More than one million angiographies are performed each year in the United States. Cardiovascular diseases remain a significant health concern and burden to the healthcare systems.
The healthcare sector in the United States continues to witness substantial investments in infrastructure development, including medical facilities and equipment. This includes the procurement of advanced CO2 injectors in cardiac catheterization labs to meet the growing demand for angiography procedures. The aforementioned factors are projected to support CO2 injector market demand in the United States.
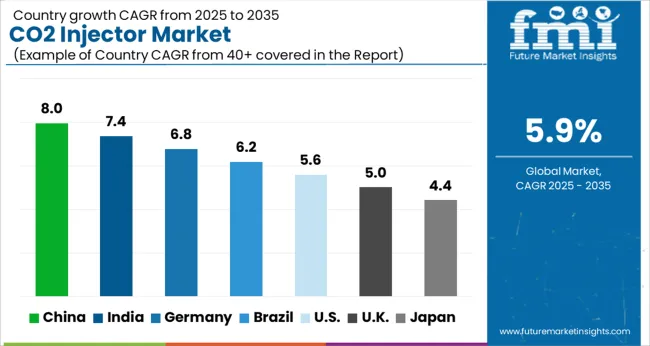
China is estimated to showcase a CAGR of 8.2% in the review period with rising investments in healthcare infrastructure and technology. China's gasoline direct injection market is also expected to surge amid the adoption of new and safe medical imaging techniques, including CO2 angiography.
Continuous technological advancements in CO2 injector systems are set to make the procedures more efficient, safer, and cost-effective. Hospitals and healthcare providers are more likely to invest in such systems.
Government regulations and policies are anticipated to affect the adoption of medical technologies. Favorable regulations and reimbursement policies in China are set to encourage healthcare providers to use CO2 injectors for angiography.
Training programs for healthcare professionals to help them use CO2 injectors and angiography techniques properly are expected to be established. These are set to ensure that medical professionals are proficient in performing CO2 angiography procedures.
India will likely record a CAGR of 8.0% from 2025 to 2035 in the CO2 injector market. The country has become a popular destination for medical tourism. It has been attracting patients worldwide for several medical procedures, including angiography.
The availability of advanced equipment, including CO2 injectors, is expected to contribute to growth. Ongoing research & development efforts in the field of angiography equipment, including CO2 injectors, are also projected to lead to innovations. These can further enhance the quality of angiographic procedures.
As per the India Brand Equity Foundation (IBEF), in FY22, India exported medical products worth USD 2.40 billion. Medical gadget exports from April to December 2025 were USD 13.3.3 billion, and by 2025, they are anticipated to reach USD 10 billion. Hence, increasing exports of medical devices, including angiography equipment, are set to aid growth in India.
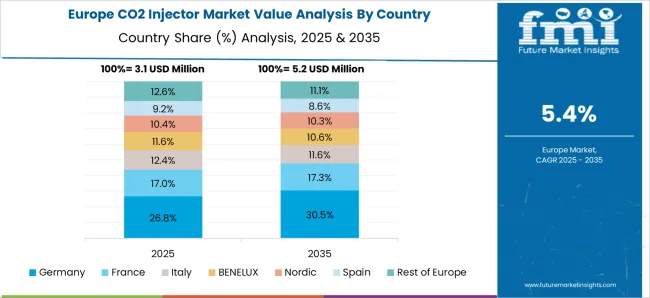
The CO2 injector market in Germany is set to register a CAGR of 5.6% in the assessment period. The increasing popularity of minimally invasive and non-invasive aesthetic procedures is anticipated to spur demand in Germany.
The ability of CO2 injectors to offer a high level of precision required for cosmetic treatments is expected to drive their demand. The surging demand for scar removal, fine-line reduction, and other procedures is estimated to push the need for precision. The ability of CO2 injectors to reduce the risk of complications is expected to spur their demand.
According to the Association of German Aesthetic-Plastic Surgeons, in 2024, around 38,854 plastic surgery procedures were performed in Germany. The number of minimally invasive procedures in the same year was 54,999. The number is estimated to surge at a fast pace in the forecast period, thereby fostering growth.
The CO2 injector market in the United Kingdom is projected to witness a CAGR of 6.2% in the estimated period. The country's increasing demand for wearable injectors is projected to foster sales by 2035.
Market share for wearable injectors is set to remain relatively high in the United Kingdom amid their ability to provide high convenience and comfort to patients. Those looking to receive medication on time regularly are expected to look for these injectors.
Wearable CO2 injectors are estimated to be available in the United Kingdom at a relatively low cost as compared to other variants. Patients wanting to avoid painful, frequent injections are set to drive demand as wearables would help them to administer medicines.
The rising prevalence of autoimmune conditions and diabetes in the United Kingdom will likely push the need for wearable injectors. As per the British Diabetic Association, around 5 million people in the United States currently suffer from diabetes. Also, about 850,000 individuals in the country are yet to obtain a diagnosis.
The table below highlights the global demand for carbon dioxide incubators by product. Under products, the automated CO2 injection system segment will likely remain dominant in the assessment period.
While smaller, the automated CO2 injection system segment is set to showcase a significant CAGR of 6.6% through 2035 in the CO2 injector market. It is expected to be followed by the semi-automated CO2 injection system segment.
CO2 Injector Market Growth Outlook by Key Product
| Product | Value-based CAGR |
|---|---|
| Automated CO2 Injection Systems | 6.6% |
| Semi-automated CO2 Injection Systems | 5.3% |
Based on products, the automated CO2 injection system segment is projected to retain its dominance through 2035 at a CAGR of 6.6% in the CO2 injector market. The ability of automated CO2 injection systems to provide high safety is expected to drive their demand.
Automated systems are anticipated to be extensively used by clinicians due to their ability to ensure precise and controlled delivery of CO2. This is further projected to help reduce the risk of complications, which otherwise increases while using iodine-based contrast agents.
There can also be a high chance of developing kidney issues using iodine-based contrast agents, as these can be nephrotoxic. Hence, patients with pre-existing renal conditions are projected to opt for automated CO2 injectors.
The emergence of new automated CO2 injection systems that can be programmed to use lower volumes of CO2 is set to help minimize the risk of nephrotoxicity. These are set to be designed to provide high efficiency and streamline angiography procedures.
Companies are also launching automated CO2 injectors with quick and precise injection features to reduce the procedure time and improve patient throughput in healthcare facilities. The United States Food and Drug Administration (FDA) and other regulatory bodies are expected to support CO2 angiography. Implementing favorable norms promoting their use as an alternative to iodine-based contrast agents is anticipated to fuel demand.
The table below highlights the sales of gasoline direct injection (GDI) systems by application. Under applications, the interventional radiology segment will likely remain dominant during the assessment period in the CO2 injector market.
The interventional radiology segment, while smaller, is set to showcase a significant CAGR of 7.1% through 2035 in the CO2 injector market. It is expected to be followed by peripheral angiography, vascular surgery, and interventional cardiology segments.
CO2 Injector Market Growth Outlook by Application
| Application | Value-based CAGR |
|---|---|
| Peripheral Angiography | 6.4% |
| Interventional Radiology | 7.1% |
| Vascular Surgery | 5.8% |
| Interventional Cardiology | 5.3% |
In terms of application, the interventional radiology segment will likely lead the CO2 injector market by exhibiting a CAGR of 7.1% during the assessment period. However, the peripheral angiography segment is anticipated to remain second by showcasing a 6.4% CAGR in the CO2 injector market.
Peripheral angiography is expected to be extensively used for diagnosing peripheral vascular diseases, including peripheral arterial disease (PAD) and deep vein thrombosis (DVT). The growing prevalence of these conditions often associated with diabetes, obesity, and aging populations, has led to an increased demand for diagnostic procedures, including angiography.
Peripheral angiography is anticipated to often involve the evaluation of small and tortuous arteries in the extremities. In such cases, due to dispersion and dilution, traditional contrast agents cannot provide optimal imaging. The ability of CO2 injectors to allow for improved visualization of these complex peripheral arteries will likely aid in diagnosing and treating vascular diseases.
As the medical community gains more experience with CO2 angiography, its applications continue to expand. This includes using CO2 injectors in multiple peripheral vascular interventions, such as angioplasty, stent placement, and embolization procedures.
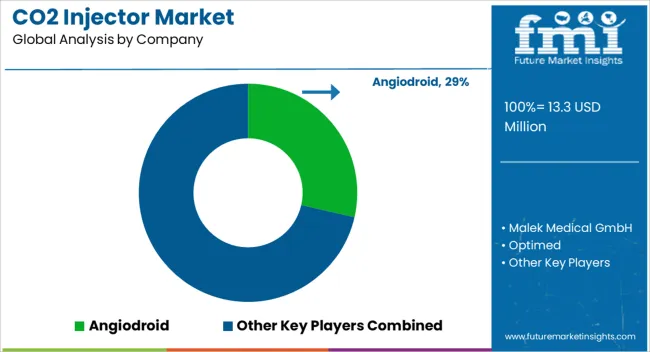
Key players are positioning themselves to obtain a foothold in the highly competitive CO2 injector market. Innovation in product development and technology is a crucial approach that several manufacturers are implementing.
Companies are also working to build CO2 injectors that are more effective and ecologically friendly by making research & development investments. These advances appeal to a wider range of businesses, from farming to energy generation, as they minimize greenhouse gases and operating costs.
Leading stakeholders, including research institutions and governmental organizations, are actively building partnerships and working with manufacturers. These collaborations ultimately increase Their economic advantage, which promotes knowledge sharing, access to necessary resources, and regulatory compliance.
Such partnerships are crucial for negotiating the complex regulatory environment and guaranteeing that products adhere to strict environmental requirements. This is becoming highly crucial as the world's focus on carbon reduction increases.
For instance
| Attribute | Details |
|---|---|
| CO2 Injector Market Estimated Size (2025) | USD 13.3 million |
| CO2 Injector Market Projected Size (2035) | USD 23.5 million |
| Value-based CO2 Injector Market CAGR (2025 to 2035) | 5.9% |
| Forecast Period | 2025 to 2035 |
| Historical Data Available for | 2020 to 2025 |
| CO2 Injector Market Analysis | Value (USD thousand) |
| Key Regions Covered in CO2 Injector Market | North America; Latin America; Europe; South Asia; East Asia; Oceania; Middle East and Africa |
| Key Country Covered in CO2 Injector Market | United States, Canada, Brazil, Mexico, Argentina, Germany, Italy, France, United Kingdom, Spain, BENELUX, Russia, China, Japan, South Korea, India, Indonesia, Thailand, Malaysia, Australia, New Zealand, GCC countries, Türkiye, Northern Africa and South Africa. |
| Key Segments Covered in CO2 Injector Market | By Product, By Application, By End User, By Region |
| Key Companies Profiled in CO2 Injector Market | Angiodroid; Malek Medical GmbH; Optimed |
| CO2 Injector Market Report Coverage | Market Forecast, Competition Intelligence, Market Dynamics and Challenges, Strategic Growth Initiatives |
The global CO2 injector market is estimated to be valued at USD 13.3 million in 2025.
The market size for the CO2 injector market is projected to reach USD 23.5 million by 2035.
The CO2 injector market is expected to grow at a 5.9% CAGR between 2025 and 2035.
The key product types in CO2 injector market are automated and semi-automated.
In terms of application, interventional radiology segment to command 39.5% share in the CO2 injector market in 2025.


Full Research Suite comprises of:
Market outlook & trends analysis
Interviews & case studies
Strategic recommendations
Vendor profiles & capabilities analysis
5-year forecasts
8 regions and 60+ country-level data splits
Market segment data splits
12 months of continuous data updates
DELIVERED AS:
PDF EXCEL ONLINE
CO2-based Polycarbonate Polyol Market Size and Share Forecast Outlook 2025 to 2035
CO2 Medical Laser Systems Market Analysis by Application, End User, and Region: Forecast for 2025 to 2035
ETCO2 masks market
Botanical CO2 Extracts Market Analysis by Cranberry Seed, Blackcurrant, Oat, Carrot, and Rice Bran through 2035.
Subcritical CO2 Refrigeration System Market Size and Share Forecast Outlook 2025 to 2035
Extracorporeal CO2 Removal Devices Market Size and Share Forecast Outlook 2025 to 2035
Carbon Dioxide Enhanced Oil Recovery (CO2 EOR) Market Analysis by Application, Source and Region: Forecast from 2025 to 2035
Injector Nozzle Market
PET Injectors Market Size and Share Forecast Outlook 2025 to 2035
Wax Injector Market Size and Share Forecast Outlook 2025 to 2035
Auto-Injectors Market Analysis - Size, Share & Forecast 2025 to 2035
Wearable Injectors Market Size and Share Forecast Outlook 2025 to 2035
Needle-Free Injectors Market Size and Share Forecast Outlook 2025 to 2035
Syringeless Injector Market Analysis – Size, Share & Forecast 2025-2035
Disposable Pen Injectors Market Size and Share Forecast Outlook 2025 to 2035
Contrast Media Injectors Market Analysis - Size, Share, and Forecast 2025 to 2035
Jet Needle-free Injectors Market Size and Share Forecast Outlook 2025 to 2035
Automotive Fuel Injector Market Size and Share Forecast Outlook 2025 to 2035
Odor-Neutralizer Injectors Market Size and Share Forecast Outlook 2025 to 2035
Epinephrine Auto-Injectors Market Insights - Growth & Forecast 2024 to 2034

Thank you!
You will receive an email from our Business Development Manager. Please be sure to check your SPAM/JUNK folder too.
Chat With
MaRIA