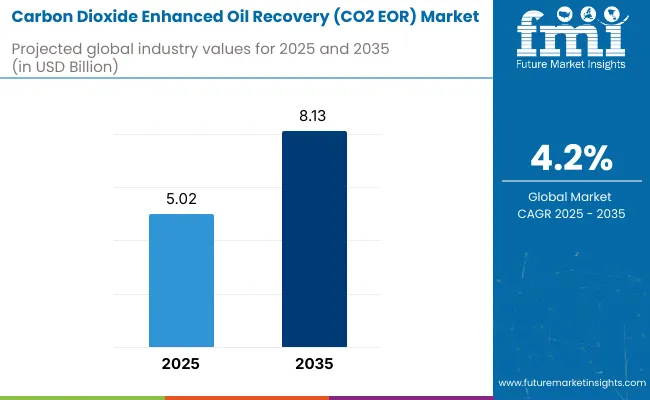
The global Carbon Dioxide Enhanced Oil Recovery (CO2 EOR) market is anticipated to surge to a valuation of USD 5.02 billion in 2025. The market will acquire a total valuation of USD 8.13 billion by 2035, representing a CAGR of 4.2% by the upcoming decade.

The carbon dioxide-enhanced oil recovery industry experienced significant growth in 2024. This growth of the sector is driven by various notable developments happening across various regions of the world. These include Santos and Beach Energy in Australia injected sequestered CO2 into depleted Cooper Basin reservoirs. This achievement proved the feasibility of carbon capture and storage (CCS) technology and its impact on shareholder confidence.
In Europe, INEOS, the British chemicals group, and its partners pledged to invest in Greensand Future off the coast of Denmark. This project is set to start operations by late 2025 or early 2026. It aims to inject as much as 400,000 tonnes of CO2 per year into an existing depleted oilfield. The project is supported by a USD 197 million grant from the Danish government.
The CO2 EOR industry is likely to transform with technological advancements and a greater focus on sustainability during the projected period between 2025 and 2035. Emerging technologies like Microbial Enhanced Oil Recovery (MEOR), intelligent polymer flooding, and digital twins are likely to improve oil recovery rates and operating efficiency while reducing the environmental footprint. Moreover, integrating CO2 EOR with carbon capture and storage programs offers a promising avenue for improving both oil recovery and carbon reduction objectives
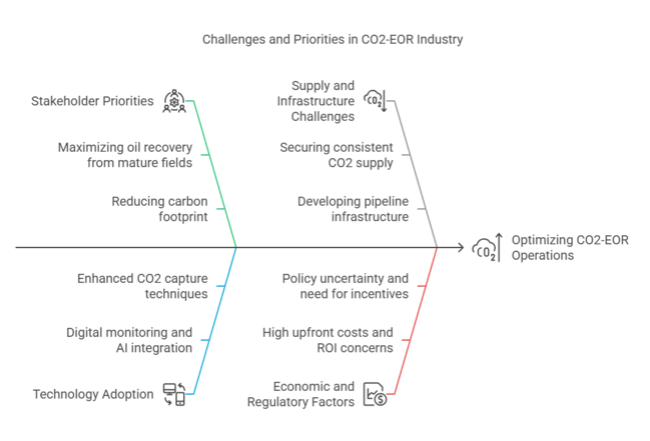
The CO2-enhanced oil Recovery (EOR) industry is set to grow steadily, fuelled by the twin imperative of extracting as much oil as possible from mature fields and lowering carbon emissions. Major winners are oil producers using EOR to boost production, carbon capture technology companies, and governments backing low-carbon projects. Companies that depend on traditional extraction techniques without sustainability plans, though, risk regulatory and economic penalties as environmental regulations become stricter.
Accelerate Carbon Capture Integration
Action: Invest in CO2 capture and injection facilities to respond to increasing emissions controls and improve EOR performance. Collaborating with industrial sources can provide a secure supply of CO2 while taking advantage of government incentives such as tax credits and carbon trading mechanisms.
Leverage Digital & AI-Driven Optimization
Action: Embrace artificial intelligence-based reservoir modelling, real-time tracking, and predictive analysis to optimize oil recovery rates and lower the cost of operations. Aligning with future technologies will enhance efficiency and sustainability while ensuring competitiveness in a changing energy economy.
Expand Strategic Partnerships & M&A
Action: Engaging with technology providers, service companies, and governments to grow operations and foster long-term viability. Pursue acquisitions of carbon management, alternative EOR technologies, or storage to pre-empt future regulatory and industry needs.
| Risk | Probability & Impact |
|---|---|
| Regulatory Uncertainty & Policy Shifts | High Probability, High Impact |
| CO2Supply Chain & Infrastructure Gaps | Medium Probability, High Impact |
| Volatility in Oil Prices & Demand | High Probability, Medium Impact |
1-Year Executive Watchlist
| Priority | Immediate Action |
|---|---|
| Scaling CO2Capture & Storage Capacity | Conducting feasibility studies of increasing CO2 sourcing partnerships and injection locations. |
| Regulatory Compliance & Incentives | Collaborate with industry associations and policymakers to ensure optimal gains from upcoming carbon credit schemes. |
| Technology & AI Integration | Invest in pilot schemes for AI-powered reservoir surveillance and predictive analytics. |
To stay ahead CO2 EOR industry, the client must make scaling CO2 capture and injection capacity through AI-based optimization and gaining regulatory incentives top priorities. Urgent measures should involve entering into strategic collaborations with industrial CO2 suppliers, testing digital reservoir management software, and actively working with policymakers to influence positive regulations.
This insight moves the roadmap towards an integrated, technology-facilitated, and policy-compliant approach-establishing the client as a industry leader in enhanced oil recovery as well as carbon management.
In Q4 2024, Future Market Insights (FMI) conducted a comprehensive survey involving 450 stakeholders across the CO2-enhanced oil Recovery (EOR) industry, including oil producers, technology providers, policymakers, and environmental agencies from North America, Western Europe, Asia-Pacific, and the Middle East.
Regional Variations
Regional Insights

| Countries | Regulations and Certifications |
|---|---|
| United States |
|
| Canada |
|
| United Kingdom |
|
| Indonesia |
|
| Germany |
|

The USA CO2 EOR industry is driven by ample natural CO2 sources and policy support, such as the Section 45Q tax credit, which encourages carbon capture and storage activities.
The USA has many mature oil fields where CO2 EOR methods can effectively boost production. Furthermore, energy security and less dependence on imported oil further drive industry growth. Key players like Occidental Petroleum and ExxonMobil are developing their EOR activities to enhance oil recovery and minimize carbon imprints.
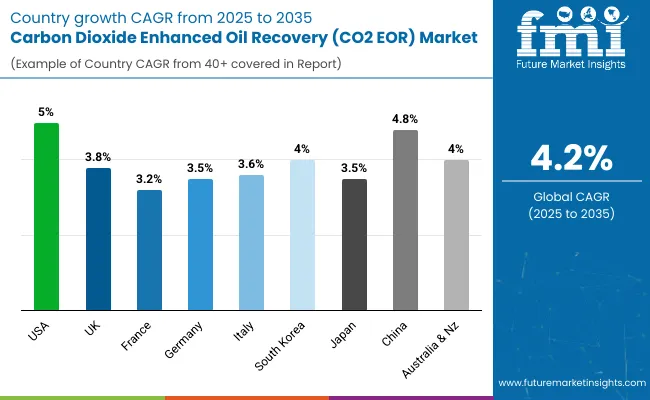
FMI opines that the United States' CO2 EOR sales will grow at nearly 5.0% CAGR through 2025 to 2035.
United Kingdom's CO2 EOR industry is estimated to grow steadily. The UK government has cleared projects such as the £4 billion carbon storage site spearheaded by BP and Equinor to capture and store CO2 beneath the North Sea. These projects are in line with the UK's plan to hit net-zero emissions by 2050 and enable the development of the CO2 EOR industry. However, several challenges, including regulatory hurdles and the necessity for considerable investments in infrastructure to underpin large-scale CO2 injection schemes.
FMI opines that the United Kingdom's CO2 EOR sales will grow at nearly 3.8% CAGR through 2025 to 2035.
France's CO2 EOR industry is driven by the nation's aspirations for decreasing greenhouse gas emissions, and emphasis on clean energy options stimulates demand for CO2 EOR technologies. Stringent environment laws and a few suitable oil fields, though, might limit industry growth at a fast pace.
Interactions among energy organizations and research institutions are in place to examine the possibility of using CO2 EOR to augment local oil production within environmental parameters.
FMI opines that the France CO2 EOR sales will grow at nearly 3.2% CAGR through 2025 to 2035.
The German industry for CO2 EOR is anticipated to grow moderately during the forecast period between 2025 and 2035. The carbon-cutting emphasis, as well as state-of-the-art technological capability by Germany, are facilitating the application of CO2 EOR technologies.
However, regulatory oversight of carbon credits and environmental impact assessments could affect the rate of industry growth. German companies are investing in research and development to maximize CO2 injection methods and enhance the economic viability of EOR projects in the context of the nation's Energiewende policy.
FMI opines that Germany’s CO2 EOR sales will grow at nearly 3.5% CAGR through 2025 to 2035.
The availability of mature oil reservoirs and carbon emission reduction efforts are key drivers for CO2 EOR industry growth in Italy. Partnerships between oil companies and research centres in terms of developing and applying CO2 EOR technologies also contribute to the trend.
However, geological limitations and opposition to CO2 storage from the populace have the potential to affect the overall use of these methods.
FMI opines that the Italy CO2 EOR sales will grow at nearly 3.6% CAGR through 2025 to 2035.
South Korea's industry for CO2 EOR will expand at a CAGR of roughly 4.0% between 2025 and 2035. South Korea's emphasis on energy security and eco-friendliness has promoted collaboration between energy companies to drive innovation in CO2EOR ventures.
Government encouragement and investment in carbon capture and storage technologies propel industry growth as well. Nevertheless, domestic oil production constraints and importation requirements for CO2 make it difficult to scale up EOR projects.
FMI opines that the South Korea CO2 EOR sales will grow at nearly 3.7% CAGR through 2025 to 2035.
The Japanese industry for CO2 EOR is poised to expand consistently during the forecast period between 2025 to 2035. The growth of the industry is driven by several industrial factors, such as the Carbon emissions reduction efforts towards investments in sophisticated technologies underpin the uptake of CO2 EOR practices in the country.
FMI opines that Japan CO2 EOR sales will grow at nearly 3.5 CAGR through 2025 to 2035.
China's CO2 EOR industry is expected to develop at a rapid pace between 2025 and 2035. The nation's vast oil reserves and many mature oil fields offer scope for CO2 EOR use. Government efforts to increase domestic oil production and decrease carbon emissions, such as involvement in carbon credit trading, also drive industry growth.
For example, the Shengli Oil Field has utilized CO2 capture and injection projects to increase oil production while supporting China's net-zero emissions objectives.
FMI opines that China’s CO2 EOR sales will grow at nearly 4.8% CAGR through 2025 to 2035.
The Australian and New Zealand CO2 EOR industry is set to expand at a CAGR of roughly 3.5% over the forecast period. The two nations' emphasis on sustainable energy practices and the availability of mature oil fields create potential for the implementation of CO2 EOR. Government incentives for carbon capture and storage schemes and alliances with foreign energy companies help drive the industry. However, Environmental issues and regulatory obstacles, though, can affect the speed of uptake.
FMI opines that the Australia-NZ CO2 EOR sales will grow at nearly 4.0% CAGR through 2025 to 2035.
Conventional oil fields will continue to be the primary focus for CO2 Enhanced Oil Recovery (EOR). These fields have a lot of oil left, so using CO2 injections helps extract more oil and keeps the fields operating longer. Oil companies will work hard to maximize oil extraction while complying with strict environmental regulations.
Improvements in monitoring and reservoir modeling will make CO2 injections more effective, keeping conventional fields vital for growth in the industry. Based on the application, the conventional oil fields segment is likely to record a CAGR of 4.1% in the projection period.
Unconventional oil and gas reservoirs, like tight oil and shale formations, will see increased interest in CO2 EOR as new technologies develop. Although hydraulic fracturing and horizontal drilling are the main methods, more operators will explore CO2 injection to enhance recovery rates.
There's a need to increase production from existing wells without a lot of drilling, so research will focus on adapting CO2 EOR for unconventional fields. However, challenges like CO2 retention and breakthrough risks will need innovation to fully utilize this segment.
Mature or declining oil fields will be the most profitable application for CO2 EOR as companies aim to get maximum oil from diminishing reserves. Many fields are nearing the end of their primary and secondary recovery stages, so operators will use CO2 injections as a cost-effective way to extract the remaining oil.
Governments and energy firms will prioritize CO2 EOR projects in older fields to boost energy security and lessen dependence on new exploration. Policy incentives, including carbon pricing and tax credits, will encourage investment in this area, ensuring that mature fields continue contributing significantly to the oil supply.
Natural CO2 will be significant for EOR, especially in regions with abundant natural CO2 in geological formations. Oil-producing areas with access to natural CO2 reservoirs will keep using this source due to its cost-effectiveness and existing infrastructure.
Companies will expand pipeline networks to link natural CO2 sources with numerous oil fields, ensuring a steady and affordable supply. The natural CO2 segment is expected to dominate the global CO2 EOR market share by 2035. It is estimated to register more than 4.0% CAGR in the review period.
Anthropogenic CO2 is an industrial process that will become crucial for EOR projects. Industries like power generation, cement manufacturing, and steel production will explore carbon capture technologies to supply CO2 for oil recovery.
A strong focus on carbon neutrality will push governments and oil companies to incorporate captured emissions into EOR operations. Strategic Partnerships between fossil fuel producers and heavy industries will speed up the development of CO2 capture projects, making anthropogenic CO2 a promising option.
Captured CO2 from dedicated carbon capture and storage (CCS) facilities will play a key role in shaping the future of CO2 EOR. With stricter carbon reduction targets, energy firms will invest in large-scale CCS projects to supply CO2 for enhanced oil recovery and meet sustainability goals.

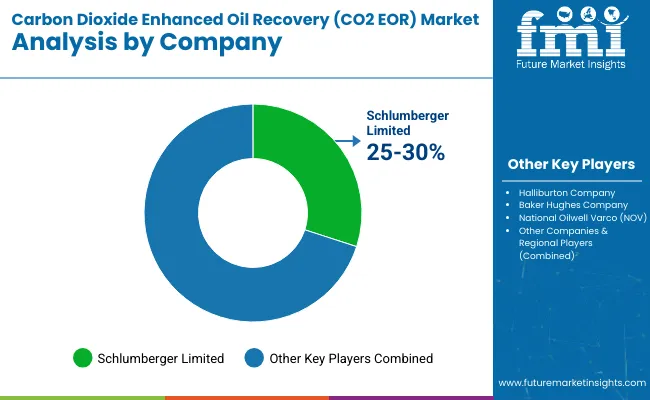
The Carbon Dioxide (CO₂) -enhanced oil Recovery (EOR) industry is moderately concentrated, with industry leaders like Occidental Petroleum, ExxonMobil, and Chevron dominating the market shares. Businesses in the sector are competing by employing strategies that are based on technological advancement, strategic alliances, and geographical expansion.
Their growth plans involve investing in research and development to advance CO2 capture and injection technologies, partnerships to access complementary strengths, and growing operations into countries with mature oil fields that are suitable for CO2 EOR.
In recent news, in October 2024, Repsol and Baker Hughes entered into a partnership to deploy the Leucipa automated field production solution. The partnership is intended to roll out AI-driven automation workflows on Repsol's worldwide assets to enhance operational efficiency and lower emissions. The Leucipa technology allows for proactive oil and gas production management through the use of operational data for data-driven decision-making.
Market Share Analysis
Conventional oil fields, unconventional oil and gas reservoirs, and mature or declining oil fields
Natural CO2, anthropogenic (man-made) CO2, captured CO2
North America, Latin America, Western Europe, South Asia and Pacific, East Asia and Middle East and Africa
Stricter carbon regulations, tax incentives, and advancements in carbon capture are driving renewed interest, making CO2 injection a more viable recovery method.
Companies like Occidental and ExxonMobil are integrating direct air capture and industrial CO2 sources into their operations, securing partnerships to expand CO2 supply chains.
Policies like the USA Inflation Reduction Act and global carbon credit programs are encouraging investments by offering financial incentives for CO2 storage and utilization.
AI-driven reservoir modeling, improved CO2 injection techniques, and automation in field operations are increasing efficiency and reducing costs.
North America leads due to policy support, while the Middle East, China, and parts of Europe are scaling up projects as carbon capture infrastructure develops.


Full Research Suite comprises of:
Market outlook & trends analysis
Interviews & case studies
Strategic recommendations
Vendor profiles & capabilities analysis
5-year forecasts
8 regions and 60+ country-level data splits
Market segment data splits
12 months of continuous data updates
DELIVERED AS:
PDF EXCEL ONLINE
Carbon Tetrabromide Market Size and Share Forecast Outlook 2025 to 2035
Carbon Steel Market Size and Share Forecast Outlook 2025 to 2035
Carbon Brush Market Size and Share Forecast Outlook 2025 to 2035
Carbon Offset Platform Market Size and Share Forecast Outlook 2025 to 2035
Carbon Tapes Market Size and Share Forecast Outlook 2025 to 2035
Carbon-Free Waste Gas Abatement System Market Size and Share Forecast Outlook 2025 to 2035
Carbon Labeled Packaged Meal Market Analysis - Size and Share Forecast Outlook 2025 to 2035
Carbon Fiber Bike Wheelset Market Size and Share Forecast Outlook 2025 to 2035
Carbon-negative Packaging Market Size and Share Forecast Outlook 2025 to 2035
Carbon Fiber Construction Repair Market Size and Share Forecast Outlook 2025 to 2035
Carbon Credit Market Size and Share Forecast Outlook 2025 to 2035
Carbon-Neutral Skincare Ingredients Market Analysis - Size and Share Forecast Outlook 2025 to 2035
Carbonate Market Size and Share Forecast Outlook 2025 to 2035
Carbon Fiber Reinforced Plastic Market Size and Share Forecast Outlook 2025 to 2035
Carbon Fiber Wraps Market Size and Share Forecast Outlook 2025 to 2035
Carbon Fiber Boat Hulls Market Size and Share Forecast Outlook 2025 to 2035
Carbon Textile Reinforced Concrete Market Size and Share Forecast Outlook 2025 to 2035
Carbon And Graphite Felt Market Size and Share Forecast Outlook 2025 to 2035
Carbon Black Content Tester Market Size and Share Forecast Outlook 2025 to 2035
Carbon Free Hose Market Analysis - Size, Share, and Forecast Outlook 2025 to 2035

Thank you!
You will receive an email from our Business Development Manager. Please be sure to check your SPAM/JUNK folder too.
Chat With
MaRIA