Cloudifier Market Size and Share Forecast Outlook 2025 to 2035

The global cloudifier market is valued at USD 709.7 million in 2025 and is slated to reach USD 1,435.7 million by 2035, reflecting a CAGR of 7.3%. Consumers are increasingly demanding natural food additives in beverages and processed foods, which drives market expansion.
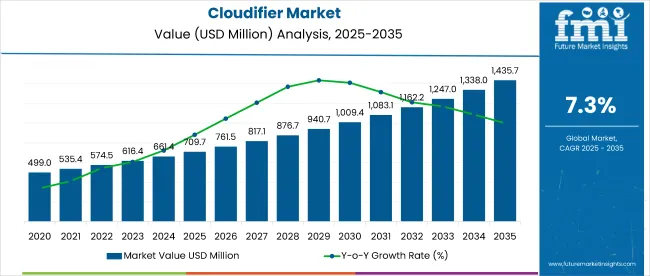
Quick Stats for Cloudifier Market

  • Market Value (2025): USD 709.7 million
  • Forecast Value (2035): USD 1,435.7 million
  • Forecast CAGR: 7.3%
  • Application Leader in 2025: Food and Beverages (78% Market Share)
  • Top Source Segment: Natural (65% share)
  • Key Growth Region: North America (USA is the fastest-growing market with 6.8% CAGR)

Cloudifier Market Market

Metric Value
Market Size (2025) USD 709.7 million
Market Size (2035) USD 1,435.7 million
CAGR (2025 to 2035) 7.3%

Health-conscious lifestyles, rising consumption of packaged products, and continuous innovation in natural ingredients are fueling the market. Moreover, favorable regulations across developed regions are encouraging food manufacturers to adopt cloudifiers across various end-use applications.

The USA is projected to lead the global market with the highest CAGR of 6.8% between 2025 and 2035, fueled by strong demand for functional beverages and continuous innovation. Germany ranks second with a 6.7% CAGR, driven by clean-label preferences and growing alcohol-based drink consumption.

France follows with a 6.6% CAGR, supported by regulatory push and organic trends. By application, food and beverages will dominate the market in 2025 with a 78% share. By nature, natural cloudifiers will hold the second-largest share at 65%, reflecting the growing preference for clean-label opacity and texture enhancers.

Governments in North America, Europe, and Asia Pacific are promoting clean-label regulations, encouraging the use of natural additives like cloudifiers. Regulatory bodies such as the FDA and EFSA are restricting synthetic ingredients, pushing manufacturers toward plant-based solutions.

Innovations like BrightSeed’s AI-driven Forager platform help discover functional plant compounds, while FLAVORWATCH™ offers advanced weighting agents to enhance beverage stability. These developments support consumer demand for natural, transparent, and sustainable food products, driving growth in the market.

The market holds a niche yet growing share within its parent markets. As of 2025, it accounts for approximately 4.5% of the global food additives market, and around 6.2% of the functional food ingredients market, reflecting rising demand for visual and sensory enhancements in beverages.

Within the beverage additives market, cloudifiers represent a more significant share of about 9.8%, driven by their widespread use in juices and carbonated drinks. In the clean label ingredients segment, cloudifiers contribute nearly 3.5%, supported by their natural origin. These figures are expected to rise steadily through 2035 with innovation and regulatory support.

Cloudifier Market Analysis by Top Investment Segments

The global market is segmented by source, properties, form, application, and region. By source, the market is classified into natural and synthetic or non-natural cloudifiers. Based on properties, the market is segmented into neutral and non-neutral.

By form, the marketcovers powdered and oil-based liquid. Based on application, the market is segmented into food and beverages, cosmetics, and pharmaceuticals. Regionally, the market is classified into North America, Latin America, Western Europe, Eastern Europe, South Asia and Pacific, East Asia, and the Middle East & Africa.
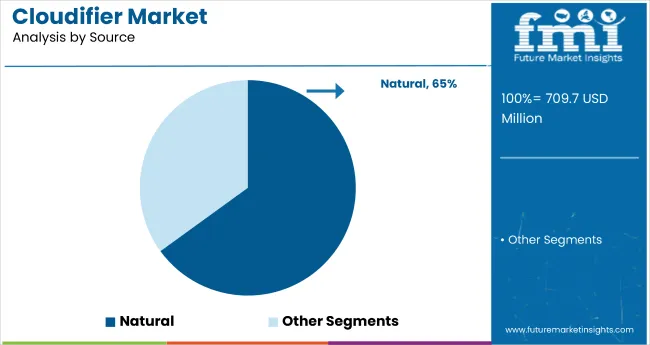
Natural Cloudifiers to Lead the Source Segment with Over 65% Market Share in 2025

Cloudifier Market Analysis By Source

The natural segment is projected to account for over 65% of the total market share in 2025, with significant growth driven by beverage applications. This trend is supported by increasing consumer preference for clean-label and non-synthetic ingredients in functional drinks, smoothies, and wellness beverages.

The segment also benefits from regulatory support for natural colorants, rising vegan and organic product launches, and broader application in health-oriented formulations targeting detox, immunity, and energy enhancement.
  • Natural cloudifiers are projected to be the most lucrative segment in the global market due to rising consumer demand for clean-label and plant-based ingredients.
  • As regulatory bodies tighten restrictions on synthetic additives, manufacturers are increasingly opting for natural alternatives derived from citrus fruits, essential oils, and botanical extracts.

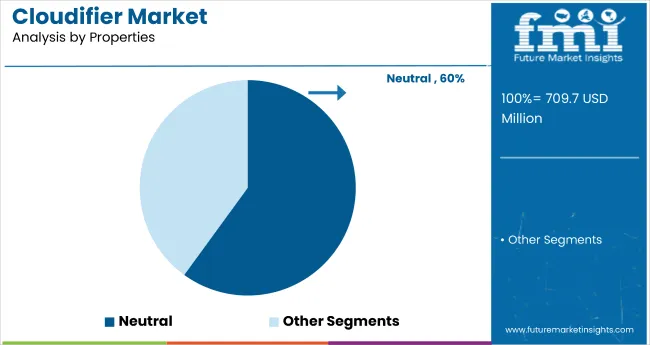
Neutral Cloudifiers to Dominate the Properties Segment with Around 60% Market Share in 2025

Cloudifier Market Analysis By Properties

The neutral cloudifiers segment is projected to hold around 60% of the market share in 2025, driven by their ability to maintain the original flavor, color, and clarity of beverages and food products. Their compatibility with a wide range of formulations, including juices, carbonated drinks, dairy-based beverages, and flavored waters, enhances their adoption across global F&B manufacturing.

Additionally, the segment benefits from rising demand for visual appeal in premium beverages, minimal flavor interference, and improved dispersion properties, making them a preferred choice in both natural and synthetic product lines.
  • Manufacturers prefer neutral cloudifiers for applications in juices, dairy drinks, and clear beverages where product consistency and appearance are crucial.
  • Their non-intrusive nature makes them ideal for formulations targeting health-conscious consumers seeking clean-label, visually appealing products without compromising on taste or quality.

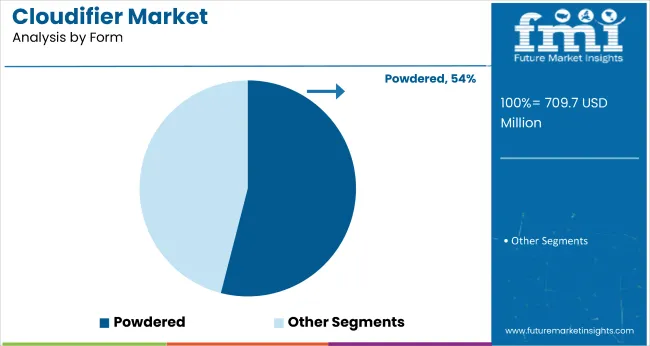
Powdered Cloudifiers to Lead the Form Segment with 54% Market Share in 2025

Cloudifier Market Analysis By Form

The powdered cloudifiers segment is expected to hold 54% of the market share in 2025, driven by its superior stability, ease of storage, and cost-effectiveness in large-scale food and beverage manufacturing. These cloudifiers offer longer shelf life, better solubility in dry mixes, and reduced transportation costs, making them ideal for instant beverage powders, dry drink mixes, and processed food applications.

Their growing use in emerging markets, where cold-chain infrastructure is limited, further accelerates adoption. Additionally, manufacturers favor powdered formats for their flexibility in formulation, consistent quality, and compatibility with high-speed industrial processing lines.
  • Powdered cloudifiers are widely used in dry mixes, instant beverages, and processed food products because they offer better shelf life and easier handling during formulation.
  • Their compatibility with a wide range of ingredients makes them the preferred choice for manufacturers aiming for consistency, convenience, and efficient logistics across global supply chains.

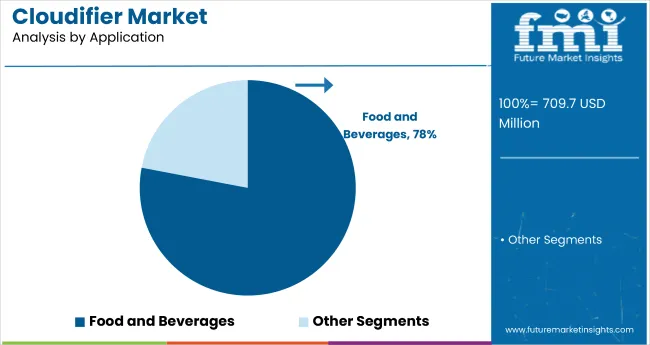
Food and Beverages to Dominate the Application Segment with 78% Market Share in 2025

Cloudifier Market Analysis By Application

The food and beverages segment will dominate with a 78% share in 2025, driven by strong demand for turbidity in juices, dairy products, and carbonated drinks. Increased consumer preference for visually appealing, natural-looking beverages, along with rising use in plant-based alternatives, flavored waters, and ready-to-drink formulations, is fueling segment growth. Manufacturers are also incorporating cloudifiers to enhance mouthfeel, simulate pulp presence, and differentiate products in competitive retail environments.

  • Cloudifiers improve appearance, texture, and product uniformity, making them essential in beverage formulation.
  • With rising demand for natural and visually appealing drinks, manufacturers increasingly use cloudifiers to meet clean-label and sensory needs, boosting growth in the food and beverages segment.

Top Cloudifier Market Dynamics

The market is growing steadily, driven by rising demand for clean-label ingredients, increasing consumer focus on natural additives, and advancements in plant-based emulsifier technologies for use across food, beverage, pharmaceutical, and personal care industries.

Recent Trends in the Cloudifier Market

  • Growing use of plant-based and citrus-derived cloudifiers in clean-label beverages.
  • Rising adoption of AI-driven platforms for discovering natural emulsifying agents.
  • Expansion of cloudifier applications into dairy alternatives and fortified drinks.
  • Strategic mergers and acquisitions among key players to diversify product offerings.
  • Increased R&D investment in sustainable and organic weighting agents.

Key Challenges in the Cloudifier Market
  • High production costs of natural cloudifiers compared to synthetic alternatives.
  • Stringent regulatory approvals slowing market entry for new formulations.
  • Limited stability of some natural cloudifiers in extreme processing conditions.
  • Inconsistent raw material quality impacting product uniformity.
  • Consumer skepticism in emerging markets toward unfamiliar additive names.

Analyzing Top Countries Supplying, Using, and Consuming CloudifiersBottom of Form

Country Wise Analysis Of Cloudifier Market

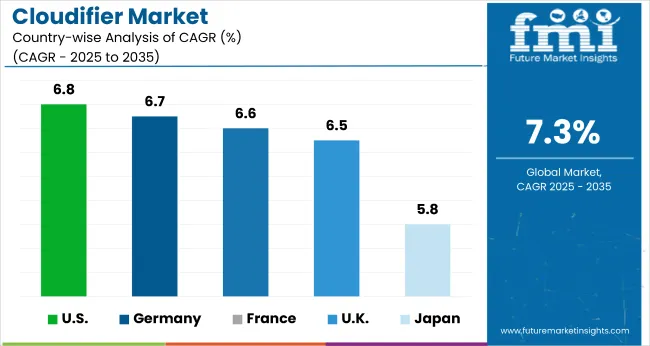
Among the top five countries, the USA leads the cloudifier market with the highest projected CAGR of 6.8% from 2025 to 2035. Growth is driven by robust demand for functional beverages, increased R&D in emulsification technologies, and a strong presence of plant-based drink manufacturers. Germany follows closely with a CAGR of 6.7%, fueled by clean-label preferences, premium juice consumption, and innovation in alcoholic beverages like beer-mix drinks and flavored spirits.

France and the UK also demonstrate strong potential with respective CAGRs of 6.6% and 6.5%, attributed to rising organic beverage adoption, regulatory approvals for natural ingredients, and demand for aesthetic clarity in wellness drinks. Japan, while comparatively moderate at 5.8% CAGR, continues to advance due to its growing focus on elderly nutrition and visually enhanced beverages for the health-conscious segment. Together, these nations represent over half of the global cloudifier consumption, shaping market direction through regulation, innovation, and evolving consumer preferences.

The report covers an in-depth analysis of 40+ countries; five top-performing OECD countries are highlighted below.
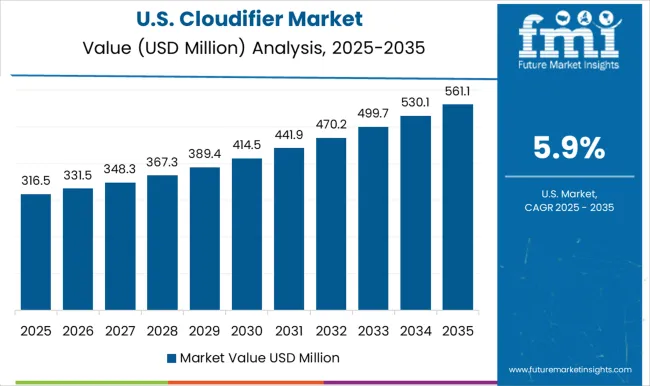
Market Outlook for Cloudifiers in the USA

The USA cloudifier market is projected to expand at a CAGR of 6.8% from 2025 to 2035, driven by high consumption of packaged and functional beverages. The country benefits from a proactive regulatory environment, with FDA approvals facilitating natural food additive use.

Major players such as Cargill and ADM continue to invest in cloud emulsion technology and beverage stabilization platforms. R\&D-driven innovation in natural emulsifiers is on the rise, targeting clean-label formats. Market growth is supported by a wide network of retail and foodservice channels seeking premium-quality clouding agents.

  • High consumption of packaged and functional beverages.
  • FDA support for natural food additive compliance.
  • Strong R\&D activity in beverage stabilization technologies.
  • Leading role of multinationals like Cargill and ADM.

Cloudifiers Demand Trends in the UK

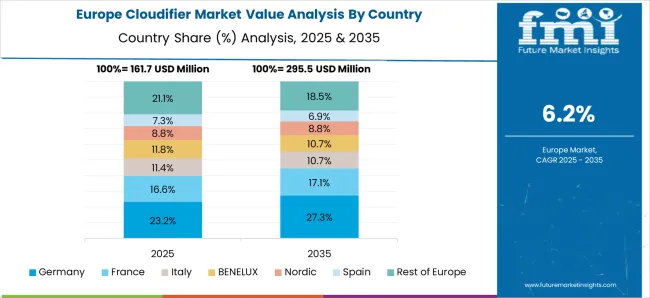
The UK cloudifier revenue is forecasted to grow at a CAGR of 6.5% between 2025 and 2035, supported by rising demand for no-/low-calorie and plant-based beverages. The market is shaped by post-Brexit regulatory alignment with EU food safety standards, encouraging natural additive use.

The growth in oat milk, almond milk, and dairy alternatives has also boosted demand for cloudifiers, especially citrus and starch-based types. Consumer interest in transparency and sustainability is guiding formulation decisions across beverage categories.
  • Surge in demand for no-/low-calorie carbonated beverages.
  • Strict regulations pushing synthetic additive replacements.
  • Growth in dairy-alternative and plant-based drinks.
  • EU-aligned food safety standards boosting trust in cloudifiers.

Growth Trajectory for Cloudifiers in Germany

Sales of cloudifiers in Germany are projected to grow at a CAGR of 6.7% from 2025 to 2035. Germany’s mature beverage sector and focus on organic, clean-label formulations support cloudifier adoption in both alcoholic and non-alcoholic products.

Cloudifiers are increasingly integrated into beers, fruit nectars, and fortified wellness drinks. German manufacturers also lead in food additive processing technology, contributing to higher stability and visual quality. Citrus-based emulsions remain highly preferred for organic certification compliance.

  • High consumption of beer and cloudy fruit beverages.
  • Emphasis on organic food and beverage formulations.
  • Technological integration in food additive processing.
  • Increasing use of citrus-based natural cloudifiers.

Cloudifier Product Demand in France

The French cloudifiers market is expected to grow at a CAGR of 6.6% from 2025 to 2035, supported by a growing appetite for natural and gourmet beverage formats. Regulatory backing for clean-label ingredients and botanical emulsifiers is helping cloudifiers gain traction across premium juice, flavored water, and herbal tea segments. French consumers are particularly responsive to food transparency and natural sourcing, which has bolstered demand for plant-based clouding agents. The rise of gourmet and fortified beverage lines is expanding the addressable market.

  • Preference for natural emulsifiers in premium beverages.
  • Expansion of organic juice and flavored water segments.
  • Regulatory support for botanical and plant-derived additives.
  • Rising application in gourmet and functional food lines.

In-depth Analysis of Cloudifier Demand in Japan

Sales of cloudifiers in Japan are forecast to grow at a CAGR of 5.8% through 2035. While growth is slightly slower than Western peers, Japan’s robust RTD segment and emphasis on aesthetic appeal in beverages remain key drivers.

Cloudifiers are widely used in nutraceutical drinks, herbal elixirs, and vitamin-enriched waters. Domestic companies are advancing formulation technologies to meet high standards of clarity, stability, and shelf life. An aging population is also boosting demand for functional beverages, further expanding the cloudifier market.
  • High demand for shelf-stable, functional beverages.
  • Advanced food tech integration in additive formulation.
  • Increasing appeal of visually enhanced drinks.
  • Use in nutraceutical and herbal drink innovations.

Leading Cloudifier Manufacturers and Suppliers

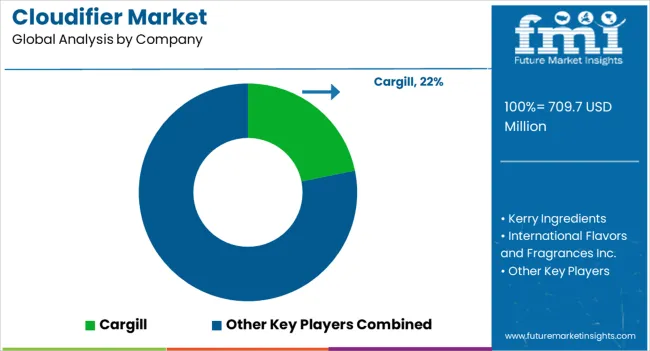
The market is moderately fragmented, with a mix of global giants and niche innovators competing through pricing strategies, innovation pipelines, strategic partnerships, and regional expansion. Top players such as Cargill, Kerry Ingredients, and International Flavors and Fragrances Inc. hold significant market shares due to their wide product portfolios and established distribution networks.

Leading companies are prioritizing natural ingredient development, expanding production capacities, and forming joint ventures to strengthen their positions in the functional beverage and additive space. For example, Cargill has actively enhanced its natural additive portfolio through acquisitions, while IFF and Chr. Hansen have invested in R&D to meet demand for high-performance emulsifiers and turbidity agents.

Recent Cloudifier Industry News

  • In March 2025, Cargill showcased innovative food solutions at AAHAR, including pectin alternatives, bake-stable fillings, and trans fat-free vanaspati, highlighting cost-saving innovations and live demos tailored to India’s evolving food landscape.

Cloudifier Market Report Scope

Report Attributes Details
Current Total Market Size (2025) USD 709.7 million
Projected Market Size (2035) USD 1,435.7 million
CAGR (2025 to 2035) 7.3%
Base Year for Estimation 2024
Historical Period 2020 to 2024
Projections Period 2025 to 2035
Market Analysis Parameters Revenue in USD million/(Volume in Metric Tons)
By Source Natural, Synthetic or Non-Natural
By Properties Neutral and Non-Neutral
By Form Powdered and Oil-based Liquid
By Application Food and Beverages, Cosmetics, and Pharmaceuticals
Regions Covered North America, Latin America, Western Europe, Eastern Europe, South Asia and Pacific, East Asia, Middle East and Africa
Countries Covered United States, United Kingdom, Germany, France, Japan, China, India, Brazil, South Korea, Australia and 40+ countries
Key Players Cargill, Kerry Ingredients, International Flavors and Fragrances Inc., Gat Foods, Chr. Hansen Holding A/S, ADM Wild Flavours, Danisco (DuPont), Eastman Chemical Company, Alano, GLCC Co., eSense Flavors & Fragrances, Chemeka
Additional Attributes Dollar sales by value, market share by country and region, competitive landscape

Key Segments

By Source:

  • Natural
  • Synthetic or Non-Natural

By Properties:

  • Neutral
  • Non-Neutral

By Form:

  • Powdered
  • Oil-based Liquid

By Application:

  • Food and Beverages
  • Cosmetics
  • Pharmaceuticals

By Region:

  • North America
  • Latin America
  • Europe
  • Asia Pacific
  • Middle East & Africa

Table of Content

  1. Executive Summary
    • Global Market Outlook
    • Demand-side Trends
    • Supply-side Trends
    • Technology Roadmap Analysis
    • Analysis and Recommendations
  2. Market Overview
    • Market Coverage/Taxonomy
    • Market Definition/Scope/Limitations
  3. Market Background
    • Market Dynamics
      • Drivers
      • Restraints
      • Opportunity
      • Trends
    • Scenario Forecast
      • Demand in Optimistic Scenario
      • Demand in Likely Scenario
      • Demand in Conservative Scenario
    • Opportunity Map Analysis
    • Product Life Cycle Analysis
    • Supply Chain Analysis
      • Supply Side Participants and their Roles
        • Producers
        • Mid-Level Participants (Traders/ Agents/ Brokers)
        • Wholesalers and Distributors
      • Value Added and Value Created at Node in the Supply Chain
      • List of Raw Material Suppliers
      • List of Existing and Potential Buyer’s
    • Investment Feasibility Matrix
    • Value Chain Analysis
      • Profit Margin Analysis
      • Wholesalers and Distributors
      • Retailers
    • PESTLE and Porter’s Analysis
    • Regulatory Landscape
      • By Key Regions
      • By Key Countries
    • Regional Parent Market Outlook
    • Production and Consumption Statistics
    • Import and Export Statistics
  4. Global Market Analysis 2020 to 2024 and Forecast, 2025 to 2035
    • Historical Market Size Value (USD Million) & Volume (Metric Tons) Analysis, 2020 to 2024
    • Current and Future Market Size Value (USD Million) & Volume (Metric Tons) Projections, 2025 to 2035
      • Y-o-Y Growth Trend Analysis
      • Absolute $ Opportunity Analysis
  5. Global Market Pricing Analysis 2020 to 2024 and Forecast 2025 to 2035
  6. Global Market Analysis 2020 to 2024 and Forecast 2025 to 2035, By Source
    • Introduction/Key Findings
    • Historical Market Size Value (USD Million) & Volume (Metric Tons) Analysis By Source, 2020 to 2024
    • Current and Future Market Size Value (USD Million) & Volume (Metric Tons) Analysis and Forecast By Source, 2025 to 2035
      • Natural
      • Synthetic or Non-Natural
    • Y-o-Y Growth Trend Analysis By Source, 2020 to 2024
    • Absolute $ Opportunity Analysis By Source, 2025 to 2035
  7. Global Market Analysis 2020 to 2024 and Forecast 2025 to 2035, By Properties
    • Introduction/Key Findings
    • Historical Market Size Value (USD Million) & Volume (Metric Tons) Analysis By Properties, 2020 to 2024
    • Current and Future Market Size Value (USD Million) & Volume (Metric Tons) Analysis and Forecast By Properties, 2025 to 2035
      • Neutral
      • Non-Neutral
    • Y-o-Y Growth Trend Analysis By Properties, 2020 to 2024
    • Absolute $ Opportunity Analysis By Properties, 2025 to 2035
  8. Global Market Analysis 2020 to 2024 and Forecast 2025 to 2035, By Form
    • Introduction/Key Findings
    • Historical Market Size Value (USD Million) & Volume (Metric Tons) Analysis By Form, 2020 to 2024
    • Current and Future Market Size Value (USD Million) & Volume (Metric Tons) Analysis and Forecast By Form, 2025 to 2035
      • Powdered
      • Oil-based Liquid
    • Y-o-Y Growth Trend Analysis By Form, 2020 to 2024
    • Absolute $ Opportunity Analysis By Form, 2025 to 2035
  9. Global Market Analysis 2020 to 2024 and Forecast 2025 to 2035, By Application
    • Introduction/Key Findings
    • Historical Market Size Value (USD Million) & Volume (Metric Tons) Analysis By Application, 2020 to 2024
    • Current and Future Market Size Value (USD Million) & Volume (Metric Tons) Analysis and Forecast By Application, 2025 to 2035
      • Food and Beverages
      • Cosmetics
      • Pharmaceuticals
    • Y-o-Y Growth Trend Analysis By Application, 2020 to 2024
    • Absolute $ Opportunity Analysis By Application, 2025 to 2035
  10. Global Market Analysis 2020 to 2024 and Forecast 2025 to 2035, By Region
    • Introduction
    • Historical Market Size Value (USD Million) & Volume (Metric Tons) Analysis By Region, 2020 to 2024
    • Current Market Size Value (USD Million) & Volume (Metric Tons) Analysis and Forecast By Region, 2025 to 2035
      • North America
      • Latin America
      • Western Europe
      • Eastern Europe
      • East Asia
      • South Asia & Pacific
      • Middle East and Africa
    • Market Attractiveness Analysis By Region
  11. North America Market Analysis 2020 to 2024 and Forecast 2025 to 2035, By Country
    • Historical Market Size Value (USD Million) & Volume (Metric Tons) Trend Analysis By Market Taxonomy, 2020 to 2024
    • Market Size Value (USD Million) & Volume (Metric Tons) Forecast By Market Taxonomy, 2025 to 2035
      • By Country
        • USA
        • Canada
        • Mexico
      • By Source
      • By Properties
      • By Form
      • By Application
    • Market Attractiveness Analysis
      • By Country
      • By Source
      • By Properties
      • By Form
      • By Application
    • Key Takeaways
  12. Latin America Market Analysis 2020 to 2024 and Forecast 2025 to 2035, By Country
    • Historical Market Size Value (USD Million) & Volume (Metric Tons) Trend Analysis By Market Taxonomy, 2020 to 2024
    • Market Size Value (USD Million) & Volume (Metric Tons) Forecast By Market Taxonomy, 2025 to 2035
      • By Country
        • Brazil
        • Argentina
        • Rest of LATAM
      • By Source
      • By Properties
      • By Form
      • By Application
    • Market Attractiveness Analysis
      • By Country
      • By Source
      • By Properties
      • By Form
      • By Application
    • Key Takeaways
  13. Western Europe Market Analysis 2020 to 2024 and Forecast 2025 to 2035, By Country
    • Historical Market Size Value (USD Million) & Volume (Metric Tons) Trend Analysis By Market Taxonomy, 2020 to 2024
    • Market Size Value (USD Million) & Volume (Metric Tons) Forecast By Market Taxonomy, 2025 to 2035
      • By Country
        • Germany
        • Italy
        • France
        • UK
        • Spain
        • BENELUX
        • Nordic
        • Rest of W.Europe
      • By Source
      • By Properties
      • By Form
      • By Application
    • Market Attractiveness Analysis
      • By Country
      • By Source
      • By Properties
      • By Form
      • By Application
    • Key Takeaways
  14. Eastern Europe Market Analysis 2020 to 2024 and Forecast 2025 to 2035, By Country
    • Historical Market Size Value (USD Million) & Volume (Metric Tons) Trend Analysis By Market Taxonomy, 2020 to 2024
    • Market Size Value (USD Million) & Volume (Metric Tons) Forecast By Market Taxonomy, 2025 to 2035
      • By Country
        • Russia
        • Hungary
        • Poland
        • Balkan & Baltics
        • Rest of E. Europe
      • By Source
      • By Properties
      • By Form
      • By Application
    • Market Attractiveness Analysis
      • By Country
      • By Source
      • By Properties
      • By Form
      • By Application
    • Key Takeaways
  15. East Asia Market Analysis 2020 to 2024 and Forecast 2025 to 2035, By Country
    • Historical Market Size Value (USD Million) & Volume (Metric Tons) Trend Analysis By Market Taxonomy, 2020 to 2024
    • Market Size Value (USD Million) & Volume (Metric Tons) Forecast By Market Taxonomy, 2025 to 2035
      • By Country
        • China
        • Japan
        • South Korea
      • By Source
      • By Properties
      • By Form
      • By Application
    • Market Attractiveness Analysis
      • By Country
      • By Source
      • By Properties
      • By Form
      • By Application
    • Key Takeaways
  16. South Asia & Pacific Market Analysis 2020 to 2024 and Forecast 2025 to 2035, By Country
    • Historical Market Size Value (USD Million) & Volume (Metric Tons) Trend Analysis By Market Taxonomy, 2020 to 2024
    • Market Size Value (USD Million) & Volume (Metric Tons) Forecast By Market Taxonomy, 2025 to 2035
      • By Country
        • India
        • Australia & New Zealand
        • ASEAN
        • Rest of SAP
      • By Source
      • By Properties
      • By Form
      • By Application
    • Market Attractiveness Analysis
      • By Country
      • By Source
      • By Properties
      • By Form
      • By Application
    • Key Takeaways
  17. Middle East and Africa Market Analysis 2020 to 2024 and Forecast 2025 to 2035, By Country
    • Historical Market Size Value (USD Million) & Volume (Metric Tons) Trend Analysis By Market Taxonomy, 2020 to 2024
    • Market Size Value (USD Million) & Volume (Metric Tons) Forecast By Market Taxonomy, 2025 to 2035
      • By Country
        • GCC Countries
        • Northern Africa
        • South Africa
        • Turkiye
        • Rest of MEA
      • By Source
      • By Properties
      • By Form
      • By Application
    • Market Attractiveness Analysis
      • By Country
      • By Source
      • By Properties
      • By Form
      • By Application
    • Key Takeaways
  18. Key Countries Market Analysis
    • USA
      • Pricing Analysis
      • Market Share Analysis, 2024
        • By Source
        • By Properties
        • By Form
        • By Application
    • Canada
      • Pricing Analysis
      • Market Share Analysis, 2024
        • By Source
        • By Properties
        • By Form
        • By Application
    • Brazil
      • Pricing Analysis
      • Market Share Analysis, 2024
        • By Source
        • By Properties
        • By Form
        • By Application
    • Mexico
      • Pricing Analysis
      • Market Share Analysis, 2024
        • By Source
        • By Properties
        • By Form
        • By Application
    • Argentina
      • Pricing Analysis
      • Market Share Analysis, 2024
        • By Source
        • By Properties
        • By Form
        • By Application
  19. Market Structure Analysis
    • Competition Dashboard
    • Competition Benchmarking
    • Market Share Analysis of Top Players
      • By Regional
      • By Source
      • By Properties
      • By Form
      • By Application
  20. Competition Analysis
    • Competition Deep Dive
      • Cargill
        • Overview
        • Product Portfolio
        • Profitability by Market Segments (Product/Age /Sales Channel/Region)
        • Sales Footprint
        • Strategy Overview
          • Marketing Strategy
          • Product Strategy
          • Channel Strategy
      • Alano
        • Overview
        • Product Portfolio
        • Profitability by Market Segments (Product/Age /Sales Channel/Region)
        • Sales Footprint
        • Strategy Overview
          • Marketing Strategy
          • Product Strategy
          • Channel Strategy
      • Gat Foods
        • Overview
        • Product Portfolio
        • Profitability by Market Segments (Product/Age /Sales Channel/Region)
        • Sales Footprint
        • Strategy Overview
          • Marketing Strategy
          • Product Strategy
          • Channel Strategy
      • GLCC Co.
        • Overview
        • Product Portfolio
        • Profitability by Market Segments (Product/Age /Sales Channel/Region)
        • Sales Footprint
        • Strategy Overview
          • Marketing Strategy
          • Product Strategy
          • Channel Strategy
      • eSense Flavors & Fragrances
        • Overview
        • Product Portfolio
        • Profitability by Market Segments (Product/Age /Sales Channel/Region)
        • Sales Footprint
        • Strategy Overview
          • Marketing Strategy
          • Product Strategy
          • Channel Strategy
      • International Flavors and Fragrances Inc.
        • Overview
        • Product Portfolio
        • Profitability by Market Segments (Product/Age /Sales Channel/Region)
        • Sales Footprint
        • Strategy Overview
          • Marketing Strategy
          • Product Strategy
          • Channel Strategy
      • Kerry Ingredients
        • Overview
        • Product Portfolio
        • Profitability by Market Segments (Product/Age /Sales Channel/Region)
        • Sales Footprint
        • Strategy Overview
          • Marketing Strategy
          • Product Strategy
          • Channel Strategy
      • Danisco (DuPont)
        • Overview
        • Product Portfolio
        • Profitability by Market Segments (Product/Age /Sales Channel/Region)
        • Sales Footprint
        • Strategy Overview
          • Marketing Strategy
          • Product Strategy
          • Channel Strategy
      • Eastman Chemical Company
        • Overview
        • Product Portfolio
        • Profitability by Market Segments (Product/Age /Sales Channel/Region)
        • Sales Footprint
        • Strategy Overview
          • Marketing Strategy
          • Product Strategy
          • Channel Strategy
      • ADM Wild Flavours
        • Overview
        • Product Portfolio
        • Profitability by Market Segments (Product/Age /Sales Channel/Region)
        • Sales Footprint
        • Strategy Overview
          • Marketing Strategy
          • Product Strategy
          • Channel Strategy
      • Chemeka
        • Overview
        • Product Portfolio
        • Profitability by Market Segments (Product/Age /Sales Channel/Region)
        • Sales Footprint
        • Strategy Overview
          • Marketing Strategy
          • Product Strategy
          • Channel Strategy
      • Chr. Hansen Holding A/S
        • Overview
        • Product Portfolio
        • Profitability by Market Segments (Product/Age /Sales Channel/Region)
        • Sales Footprint
        • Strategy Overview
          • Marketing Strategy
          • Product Strategy
          • Channel Strategy
  21. Assumptions & Acronyms Used
  22. Research Methodology

List of Tables

  • Table 1: Global Market Value (USD Million) Forecast by Region, 2020-2035
  • Table 2: Global Market Volume (Metric Tons) Forecast by Region, 2020-2035
  • Table 3: Global Market Value (USD Million) Forecast by Source, 2020-2035
  • Table 4: Global Market Volume (Metric Tons) Forecast by Source, 2020-2035
  • Table 5: Global Market Value (USD Million) Forecast by Properties, 2020-2035
  • Table 6: Global Market Volume (Metric Tons) Forecast by Properties, 2020-2035
  • Table 7: Global Market Value (USD Million) Forecast by Form, 2020-2035
  • Table 8: Global Market Volume (Metric Tons) Forecast by Form, 2020-2035
  • Table 9: Global Market Value (USD Million) Forecast by Application, 2020-2035
  • Table 10: Global Market Volume (Metric Tons) Forecast by Application, 2020-2035
  • Table 11: North America Market Value (USD Million) Forecast by Country, 2020-2035
  • Table 12: North America Market Volume (Metric Tons) Forecast by Country, 2020-2035
  • Table 13: North America Market Value (USD Million) Forecast by Source, 2020-2035
  • Table 14: North America Market Volume (Metric Tons) Forecast by Source, 2020-2035
  • Table 15: North America Market Value (USD Million) Forecast by Properties, 2020-2035
  • Table 16: North America Market Volume (Metric Tons) Forecast by Properties, 2020-2035
  • Table 17: North America Market Value (USD Million) Forecast by Form, 2020-2035
  • Table 18: North America Market Volume (Metric Tons) Forecast by Form, 2020-2035
  • Table 19: North America Market Value (USD Million) Forecast by Application, 2020-2035
  • Table 20: North America Market Volume (Metric Tons) Forecast by Application, 2020-2035
  • Table 21: Latin America Market Value (USD Million) Forecast by Country, 2020-2035
  • Table 22: Latin America Market Volume (Metric Tons) Forecast by Country, 2020-2035
  • Table 23: Latin America Market Value (USD Million) Forecast by Source, 2020-2035
  • Table 24: Latin America Market Volume (Metric Tons) Forecast by Source, 2020-2035
  • Table 25: Latin America Market Value (USD Million) Forecast by Properties, 2020-2035
  • Table 26: Latin America Market Volume (Metric Tons) Forecast by Properties, 2020-2035
  • Table 27: Latin America Market Value (USD Million) Forecast by Form, 2020-2035
  • Table 28: Latin America Market Volume (Metric Tons) Forecast by Form, 2020-2035
  • Table 29: Latin America Market Value (USD Million) Forecast by Application, 2020-2035
  • Table 30: Latin America Market Volume (Metric Tons) Forecast by Application, 2020-2035
  • Table 31: Western Europe Market Value (USD Million) Forecast by Country, 2020-2035
  • Table 32: Western Europe Market Volume (Metric Tons) Forecast by Country, 2020-2035
  • Table 33: Western Europe Market Value (USD Million) Forecast by Source, 2020-2035
  • Table 34: Western Europe Market Volume (Metric Tons) Forecast by Source, 2020-2035
  • Table 35: Western Europe Market Value (USD Million) Forecast by Properties, 2020-2035
  • Table 36: Western Europe Market Volume (Metric Tons) Forecast by Properties, 2020-2035
  • Table 37: Western Europe Market Value (USD Million) Forecast by Form, 2020-2035
  • Table 38: Western Europe Market Volume (Metric Tons) Forecast by Form, 2020-2035
  • Table 39: Western Europe Market Value (USD Million) Forecast by Application, 2020-2035
  • Table 40: Western Europe Market Volume (Metric Tons) Forecast by Application, 2020-2035
  • Table 41: Eastern Europe Market Value (USD Million) Forecast by Country, 2020-2035
  • Table 42: Eastern Europe Market Volume (Metric Tons) Forecast by Country, 2020-2035
  • Table 43: Eastern Europe Market Value (USD Million) Forecast by Source, 2020-2035
  • Table 44: Eastern Europe Market Volume (Metric Tons) Forecast by Source, 2020-2035
  • Table 45: Eastern Europe Market Value (USD Million) Forecast by Properties, 2020-2035
  • Table 46: Eastern Europe Market Volume (Metric Tons) Forecast by Properties, 2020-2035
  • Table 47: Eastern Europe Market Value (USD Million) Forecast by Form, 2020-2035
  • Table 48: Eastern Europe Market Volume (Metric Tons) Forecast by Form, 2020-2035
  • Table 49: Eastern Europe Market Value (USD Million) Forecast by Application, 2020-2035
  • Table 50: Eastern Europe Market Volume (Metric Tons) Forecast by Application, 2020-2035
  • Table 51: East Asia Market Value (USD Million) Forecast by Country, 2020-2035
  • Table 52: East Asia Market Volume (Metric Tons) Forecast by Country, 2020-2035
  • Table 53: East Asia Market Value (USD Million) Forecast by Source, 2020-2035
  • Table 54: East Asia Market Volume (Metric Tons) Forecast by Source, 2020-2035
  • Table 55: East Asia Market Value (USD Million) Forecast by Properties, 2020-2035
  • Table 56: East Asia Market Volume (Metric Tons) Forecast by Properties, 2020-2035
  • Table 57: East Asia Market Value (USD Million) Forecast by Form, 2020-2035
  • Table 58: East Asia Market Volume (Metric Tons) Forecast by Form, 2020-2035
  • Table 59: East Asia Market Value (USD Million) Forecast by Application, 2020-2035
  • Table 60: East Asia Market Volume (Metric Tons) Forecast by Application, 2020-2035
  • Table 61: South Asia & Pacific Market Value (USD Million) Forecast by Country, 2020-2035
  • Table 62: South Asia & Pacific Market Volume (Metric Tons) Forecast by Country, 2020-2035
  • Table 63: South Asia & Pacific Market Value (USD Million) Forecast by Source, 2020-2035
  • Table 64: South Asia & Pacific Market Volume (Metric Tons) Forecast by Source, 2020-2035
  • Table 65: South Asia & Pacific Market Value (USD Million) Forecast by Properties, 2020-2035
  • Table 66: South Asia & Pacific Market Volume (Metric Tons) Forecast by Properties, 2020-2035
  • Table 67: South Asia & Pacific Market Value (USD Million) Forecast by Form, 2020-2035
  • Table 68: South Asia & Pacific Market Volume (Metric Tons) Forecast by Form, 2020-2035
  • Table 69: South Asia & Pacific Market Value (USD Million) Forecast by Application, 2020-2035
  • Table 70: South Asia & Pacific Market Volume (Metric Tons) Forecast by Application, 2020-2035
  • Table 71: Middle East and Africa Market Value (USD Million) Forecast by Country, 2020-2035
  • Table 72: Middle East and Africa Market Volume (Metric Tons) Forecast by Country, 2020-2035
  • Table 73: Middle East and Africa Market Value (USD Million) Forecast by Source, 2020-2035
  • Table 74: Middle East and Africa Market Volume (Metric Tons) Forecast by Source, 2020-2035
  • Table 75: Middle East and Africa Market Value (USD Million) Forecast by Properties, 2020-2035
  • Table 76: Middle East and Africa Market Volume (Metric Tons) Forecast by Properties, 2020-2035
  • Table 77: Middle East and Africa Market Value (USD Million) Forecast by Form, 2020-2035
  • Table 78: Middle East and Africa Market Volume (Metric Tons) Forecast by Form, 2020-2035
  • Table 79: Middle East and Africa Market Value (USD Million) Forecast by Application, 2020-2035
  • Table 80: Middle East and Africa Market Volume (Metric Tons) Forecast by Application, 2020-2035

List of Figures

  • Figure 1: Global Market Volume (Metric Tons) Forecast 2020-2035
  • Figure 2: Global Market Pricing Analysis
  • Figure 3: Global Market Value (USD Million) Forecast 2020-2035
  • Figure 4: Global Market Value Share and BPS Analysis by Source, 2025 and 2035
  • Figure 5: Global Market Y-o-Y Growth Comparison by Source, 2025-2035
  • Figure 6: Global Market Attractiveness Analysis by Source
  • Figure 7: Global Market Value Share and BPS Analysis by Properties, 2025 and 2035
  • Figure 8: Global Market Y-o-Y Growth Comparison by Properties, 2025-2035
  • Figure 9: Global Market Attractiveness Analysis by Properties
  • Figure 10: Global Market Value Share and BPS Analysis by Form, 2025 and 2035
  • Figure 11: Global Market Y-o-Y Growth Comparison by Form, 2025-2035
  • Figure 12: Global Market Attractiveness Analysis by Form
  • Figure 13: Global Market Value Share and BPS Analysis by Application, 2025 and 2035
  • Figure 14: Global Market Y-o-Y Growth Comparison by Application, 2025-2035
  • Figure 15: Global Market Attractiveness Analysis by Application
  • Figure 16: Global Market Value (USD Million) Share and BPS Analysis by Region, 2025 and 2035
  • Figure 17: Global Market Y-o-Y Growth Comparison by Region, 2025-2035
  • Figure 18: Global Market Attractiveness Analysis by Region
  • Figure 19: North America Market Incremental $ Opportunity, 2025-2035
  • Figure 20: Latin America Market Incremental $ Opportunity, 2025-2035
  • Figure 21: Western Europe Market Incremental $ Opportunity, 2025-2035
  • Figure 22: Eastern Europe Market Incremental $ Opportunity, 2025-2035
  • Figure 23: East Asia Market Incremental $ Opportunity, 2025-2035
  • Figure 24: South Asia & Pacific Market Incremental $ Opportunity, 2025-2035
  • Figure 25: Middle East and Africa Market Incremental $ Opportunity, 2025-2035
  • Figure 26: North America Market Value Share and BPS Analysis by Country, 2025 and 2035
  • Figure 27: North America Market Value Share and BPS Analysis by Source, 2025 and 2035
  • Figure 28: North America Market Y-o-Y Growth Comparison by Source, 2025-2035
  • Figure 29: North America Market Attractiveness Analysis by Source
  • Figure 30: North America Market Value Share and BPS Analysis by Properties, 2025 and 2035
  • Figure 31: North America Market Y-o-Y Growth Comparison by Properties, 2025-2035
  • Figure 32: North America Market Attractiveness Analysis by Properties
  • Figure 33: North America Market Value Share and BPS Analysis by Form, 2025 and 2035
  • Figure 34: North America Market Y-o-Y Growth Comparison by Form, 2025-2035
  • Figure 35: North America Market Attractiveness Analysis by Form
  • Figure 36: North America Market Value Share and BPS Analysis by Application, 2025 and 2035
  • Figure 37: North America Market Y-o-Y Growth Comparison by Application, 2025-2035
  • Figure 38: North America Market Attractiveness Analysis by Application
  • Figure 39: Latin America Market Value Share and BPS Analysis by Country, 2025 and 2035
  • Figure 40: Latin America Market Value Share and BPS Analysis by Source, 2025 and 2035
  • Figure 41: Latin America Market Y-o-Y Growth Comparison by Source, 2025-2035
  • Figure 42: Latin America Market Attractiveness Analysis by Source
  • Figure 43: Latin America Market Value Share and BPS Analysis by Properties, 2025 and 2035
  • Figure 44: Latin America Market Y-o-Y Growth Comparison by Properties, 2025-2035
  • Figure 45: Latin America Market Attractiveness Analysis by Properties
  • Figure 46: Latin America Market Value Share and BPS Analysis by Form, 2025 and 2035
  • Figure 47: Latin America Market Y-o-Y Growth Comparison by Form, 2025-2035
  • Figure 48: Latin America Market Attractiveness Analysis by Form
  • Figure 49: Latin America Market Value Share and BPS Analysis by Application, 2025 and 2035
  • Figure 50: Latin America Market Y-o-Y Growth Comparison by Application, 2025-2035
  • Figure 51: Latin America Market Attractiveness Analysis by Application
  • Figure 52: Western Europe Market Value Share and BPS Analysis by Country, 2025 and 2035
  • Figure 53: Western Europe Market Value Share and BPS Analysis by Source, 2025 and 2035
  • Figure 54: Western Europe Market Y-o-Y Growth Comparison by Source, 2025-2035
  • Figure 55: Western Europe Market Attractiveness Analysis by Source
  • Figure 56: Western Europe Market Value Share and BPS Analysis by Properties, 2025 and 2035
  • Figure 57: Western Europe Market Y-o-Y Growth Comparison by Properties, 2025-2035
  • Figure 58: Western Europe Market Attractiveness Analysis by Properties
  • Figure 59: Western Europe Market Value Share and BPS Analysis by Form, 2025 and 2035
  • Figure 60: Western Europe Market Y-o-Y Growth Comparison by Form, 2025-2035
  • Figure 61: Western Europe Market Attractiveness Analysis by Form
  • Figure 62: Western Europe Market Value Share and BPS Analysis by Application, 2025 and 2035
  • Figure 63: Western Europe Market Y-o-Y Growth Comparison by Application, 2025-2035
  • Figure 64: Western Europe Market Attractiveness Analysis by Application
  • Figure 65: Eastern Europe Market Value Share and BPS Analysis by Country, 2025 and 2035
  • Figure 66: Eastern Europe Market Value Share and BPS Analysis by Source, 2025 and 2035
  • Figure 67: Eastern Europe Market Y-o-Y Growth Comparison by Source, 2025-2035
  • Figure 68: Eastern Europe Market Attractiveness Analysis by Source
  • Figure 69: Eastern Europe Market Value Share and BPS Analysis by Properties, 2025 and 2035
  • Figure 70: Eastern Europe Market Y-o-Y Growth Comparison by Properties, 2025-2035
  • Figure 71: Eastern Europe Market Attractiveness Analysis by Properties
  • Figure 72: Eastern Europe Market Value Share and BPS Analysis by Form, 2025 and 2035
  • Figure 73: Eastern Europe Market Y-o-Y Growth Comparison by Form, 2025-2035
  • Figure 74: Eastern Europe Market Attractiveness Analysis by Form
  • Figure 75: Eastern Europe Market Value Share and BPS Analysis by Application, 2025 and 2035
  • Figure 76: Eastern Europe Market Y-o-Y Growth Comparison by Application, 2025-2035
  • Figure 77: Eastern Europe Market Attractiveness Analysis by Application
  • Figure 78: East Asia Market Value Share and BPS Analysis by Country, 2025 and 2035
  • Figure 79: East Asia Market Value Share and BPS Analysis by Source, 2025 and 2035
  • Figure 80: East Asia Market Y-o-Y Growth Comparison by Source, 2025-2035
  • Figure 81: East Asia Market Attractiveness Analysis by Source
  • Figure 82: East Asia Market Value Share and BPS Analysis by Properties, 2025 and 2035
  • Figure 83: East Asia Market Y-o-Y Growth Comparison by Properties, 2025-2035
  • Figure 84: East Asia Market Attractiveness Analysis by Properties
  • Figure 85: East Asia Market Value Share and BPS Analysis by Form, 2025 and 2035
  • Figure 86: East Asia Market Y-o-Y Growth Comparison by Form, 2025-2035
  • Figure 87: East Asia Market Attractiveness Analysis by Form
  • Figure 88: East Asia Market Value Share and BPS Analysis by Application, 2025 and 2035
  • Figure 89: East Asia Market Y-o-Y Growth Comparison by Application, 2025-2035
  • Figure 90: East Asia Market Attractiveness Analysis by Application
  • Figure 91: South Asia & Pacific Market Value Share and BPS Analysis by Country, 2025 and 2035
  • Figure 92: South Asia & Pacific Market Value Share and BPS Analysis by Source, 2025 and 2035
  • Figure 93: South Asia & Pacific Market Y-o-Y Growth Comparison by Source, 2025-2035
  • Figure 94: South Asia & Pacific Market Attractiveness Analysis by Source
  • Figure 95: South Asia & Pacific Market Value Share and BPS Analysis by Properties, 2025 and 2035
  • Figure 96: South Asia & Pacific Market Y-o-Y Growth Comparison by Properties, 2025-2035
  • Figure 97: South Asia & Pacific Market Attractiveness Analysis by Properties
  • Figure 98: South Asia & Pacific Market Value Share and BPS Analysis by Form, 2025 and 2035
  • Figure 99: South Asia & Pacific Market Y-o-Y Growth Comparison by Form, 2025-2035
  • Figure 100: South Asia & Pacific Market Attractiveness Analysis by Form
  • Figure 101: South Asia & Pacific Market Value Share and BPS Analysis by Application, 2025 and 2035
  • Figure 102: South Asia & Pacific Market Y-o-Y Growth Comparison by Application, 2025-2035
  • Figure 103: South Asia & Pacific Market Attractiveness Analysis by Application
  • Figure 104: Middle East and Africa Market Value Share and BPS Analysis by Country, 2025 and 2035
  • Figure 105: Middle East and Africa Market Value Share and BPS Analysis by Source, 2025 and 2035
  • Figure 106: Middle East and Africa Market Y-o-Y Growth Comparison by Source, 2025-2035
  • Figure 107: Middle East and Africa Market Attractiveness Analysis by Source
  • Figure 108: Middle East and Africa Market Value Share and BPS Analysis by Properties, 2025 and 2035
  • Figure 109: Middle East and Africa Market Y-o-Y Growth Comparison by Properties, 2025-2035
  • Figure 110: Middle East and Africa Market Attractiveness Analysis by Properties
  • Figure 111: Middle East and Africa Market Value Share and BPS Analysis by Form, 2025 and 2035
  • Figure 112: Middle East and Africa Market Y-o-Y Growth Comparison by Form, 2025-2035
  • Figure 113: Middle East and Africa Market Attractiveness Analysis by Form
  • Figure 114: Middle East and Africa Market Value Share and BPS Analysis by Application, 2025 and 2035
  • Figure 115: Middle East and Africa Market Y-o-Y Growth Comparison by Application, 2025-2035
  • Figure 116: Middle East and Africa Market Attractiveness Analysis by Application
  • Figure 117: Global Market - Tier Structure Analysis
  • Figure 118: Global Market - Company Share Analysis

Frequently Asked Questions

What is the projected size of the cloudifier market in 2025?

The market is valued at USD 709.7 million in 2025.

What is the outlook on cloudifier demand by 2035?

The market is forecasted to reach USD 1,435.7 million by 2035, reflecting a CAGR of 7.3%.

Which segment leads the cloudifier market by application in 2025?

Food and beverages will lead the application segment, accounting for 78% of the global market share in 2025.

Which form type dominates the cloudifier market in 2025?

Neutral cloudifiers will dominate the form type segment, holding around 60% of the global market share in 2025.

Which region is projected to have the fastest-growing cloudifier market?

North America is projected to grow at the fastest rate, with a CAGR of 6.8% from 2025 to 2035.

Future Market Insights

Cloudifier Market