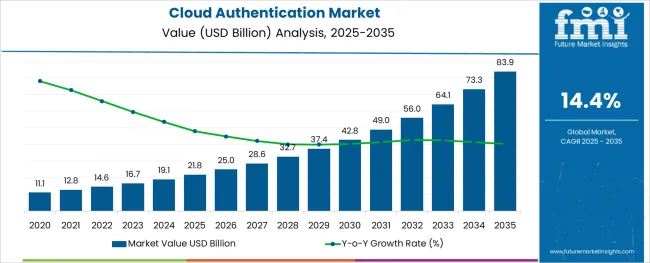
The Cloud Authentication Market is estimated to be valued at USD 21.8 billion in 2025 and is projected to reach USD 83.9 billion by 2035, registering a compound annual growth rate (CAGR) of 14.4% over the forecast period.
The alginic acid market is undergoing consistent growth, propelled by rising demand from food processing, pharmaceutical formulations, and cosmetic applications. A growing focus on natural and sustainable ingredients in manufacturing processes has positioned alginic acid as a preferred biopolymer across industries.
The market is further supported by its diverse functional benefits, including water retention, gelling, and stabilizing properties, which make it indispensable in high-performance formulations. Increased regulatory acceptance of alginates as safe additives and the push towards cleaner labeling in food and personal care products have reinforced their adoption.
Ongoing innovation in extraction technologies and the utilization of algae as a renewable resource are paving the way for cost-effective production and expanded applications, ensuring sustained market expansion in the coming years.
The market is segmented by Type, Enterprise Size, and Industry and region. By Type, the market is divided into Single and Multifactor. In terms of Enterprise Size, the market is classified into Small Offices (1-9 employees), Small Enterprises (10-99 employees), Medium-sized enterprise (100-499 employees), Large Enterprises (500-999 employees), and Very Large Enterprises (1000+ employees).
Based on Industry, the market is segmented into Service, Distribution Services, Public Sector, Finance, Manufacturing Resources, and Infrastructure. Regionally, the market is classified into North America, Latin America, Western Europe, Eastern Europe, Balkan & Baltic Countries, Russia & Belarus, Central Asia, East Asia, South Asia & Pacific, and the Middle East & Africa.
When segmented by salts, sodium alginate is expected to command 27.5 % of the market revenue in 2025, marking it as the leading subsegment in this category. This leadership has been driven by its superior solubility, ease of incorporation into formulations, and versatility in a wide range of applications.
Its ability to form stable gels and maintain viscosity under varying conditions has made it highly sought after in both food and pharmaceutical sectors. Manufacturers have prioritized sodium alginate due to its consistent performance, cost-effectiveness, and regulatory acceptance, which have collectively strengthened its position.
The segment’s prominence has also been enhanced by its adaptability to evolving consumer preferences for plant-derived and sustainable ingredients, reinforcing its market share.
Segmented by end user industry, the food industry is projected to hold 33.0 % of the market revenue in 2025, positioning it as the most prominent sector. This dominance has been shaped by the industry’s increasing reliance on alginic acid and its derivatives to deliver desirable textures, stabilize emulsions, and improve shelf life of processed foods.
As consumer demand for clean label and natural additives has intensified, the food sector has responded by integrating alginates into bakery, dairy, and confectionery products. Enhanced production efficiency and compliance with food safety standards have further encouraged widespread use.
The segment’s leadership has also been supported by product differentiation strategies where alginates contribute to premium quality and innovation, securing their role in modern food formulations.
When analyzed by functionality, thickening agents are forecast to account for 29.0 % of the market revenue in 2025, establishing themselves as the dominant functional category. This preeminence has been underpinned by the growing need for consistent texture and viscosity in a wide array of end products.
Alginic acid’s natural origin and high efficiency in creating uniform, stable thickness without altering taste or color have solidified its appeal. The demand for thickeners in both edible and topical applications has expanded, with manufacturers leveraging its rheological properties to meet performance and regulatory requirements.
The functionality’s leading share has also been reinforced by the ability to deliver cost savings through lower dosages and its compatibility with other ingredients, securing its position as an indispensable component in formulation strategies.
As per FMI, in the span of 2020 and 2024, the market witnessed the growth of 12.6% CAGR while during the forecasted period, the market is posed to grow at 14.4% CAGR. On the basis of short-term growth, by 2029, the market is expected to be worth USD 18,769.41 million.
The cloud authentication market share is showing tremendous growth over the years due to high-security demand.
With rising number of companies shifting their data to the cloud, the cyber-attacks and breaches are only expected to rise. In order to tackle these types of incidents, the intense need of cloud authentication is imminent. As authentication factors enhances the security features, ensuring the access of critical information and systems to only those who have authorization.
During the forecast period, the e-commerce sector is anticipated to expand at the fastest rate. The vertical sell consumer goods and services to its customers through a variety of channels.
Moreover, due to the potential for payments and the enormous volume of financial transactions carried out using credit and debit cards, e-commerce is one of the most cost-conscious sectors and one of the businesses that hackers target the most. As a result, the adoption of cloud authentication is considered the safest option for businesses.
Additionally, it is projected that merchants would be more likely to use cloud authentication services as the supply chain, labor, distribution partners, and customers become more complex.
Although MFA solutions help to improve the security of the firm, they also have some drawbacks and some hazards. First of all, a multi-factor authentication setup can be demanding, expensive, and time-consuming.
The time required to accomplish a single activity grows as the number of authentication factors does as well. Additionally, fraudsters may utilize techniques like sim swapping or switching to gain quick access to a user's physical sim card and access IDs. These elements are predicted to impede the cloud authentication market expansion.
Cloud authentication as a service share of 68% was held by multi-factor authentication in 2024, and it is anticipated that this market would expand further during the forecast period.
The multi-factor service enables the replacement of several passwords with stronger ones. Additionally, it can offer the possibility to increase output while lowering operating costs.
Remote fingerprint scanning, facial recognition, and document verification are all made possible by cloud-integrated MFA solutions. The demand for cloud authentication is expected to grow as a result of improvements in biometrics, software, and hardware, as well as positive government initiatives to improve national security.
With the market share of 26% in the year 2024, the very large enterprise segment lead the market in the enterprise size. Meanwhile, the small offices segment is poised to witness the high CAGR of 22.7% between 2025 and 2035.
Cloud authentication has mostly been employed by both large corporations and SMEs during the past ten years. Large businesses can benefit from features like automatic user account provisioning, workflow and self-service management, Single Sign-On (SSO), password management, and access governance.
Companies can enjoy opportunities in the cloud authentication market due to role-Based Access Control (RBAC), audit, and compliance, among others. So, in 2025, large organizations are likely to have the greatest market share and are anticipated to expand at a respectable CAGR.
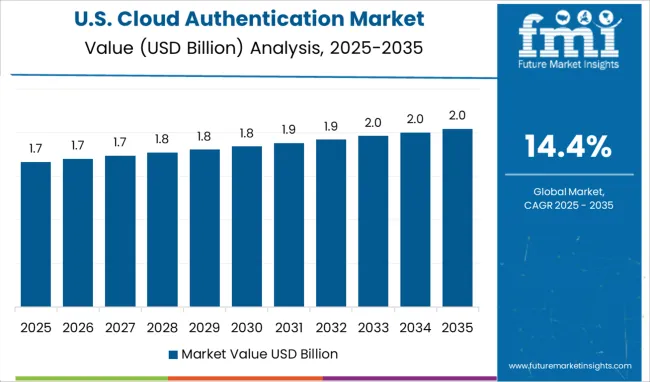
The USA dominated the cloud authentication market with a share of 23.4% in 2024. On the other hand, demand is continuously growing with the CAGR of 13.8%
North America dominated the cloud authentication market with holding the market share of 32.9% in the year 2024. This is owing to the high presence of major players including RSA Security, Symantec Corporation, Gemalto N.V. and Entrust Datacard.
Symantec corporation have the quite diverse and strong portfolio of cloud authentication solutions, which includes features such as anti-malware, anti-spam, anti-hacking as well as anti-ransomware. This makes company the significant player in the market.
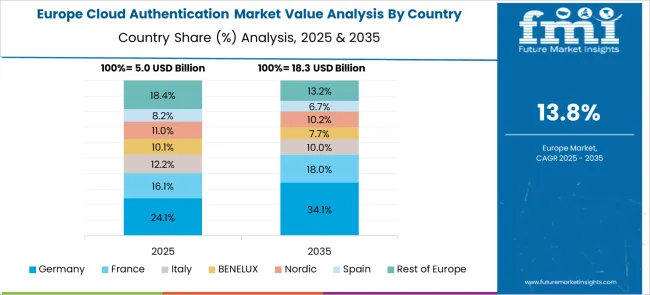
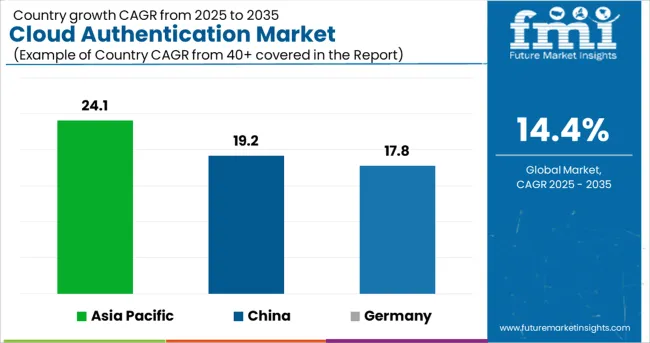
Germany shows significant growth in the cloud authentication market, with a share of 12.5% in 2024. Demand is continuously growing, with a CAGR of 17.8%
The market in the European region is expected to witness the growth of a CAGR of 16.4%. The primary factors being the emergence of preventing cyber-attacks, breaches and online frauds. On the other hand, the necessity of regulations compliance is also fueling the market growth.
The rising demand of access management services as well as cloud based identity are primarily the factors behind the market growth while the rising focus on cloud-based applications are also supporting the market growth. Although, the market is still unsure about the concerns regarding data privacy and governance.
India is expanding rapidly, at a CAGR of 24.1%. It is anticipated that government programs like Make-in-India and the Digital India Program are likely to open up new business prospects for cloud authentication providers. A major element fueling new opportunities in the cloud authentication market in this region is the enormous population of the region.
Within a few years, Asia Pacific (APAC) nations including China, Japan, and South Korea are predicted to surpass North American nations as the biggest internet retail market.
China and Japan are likely to have a CAGR of 19.2% and 21.9%. As a result, policymakers and other businesses have shown a particular interest in the rise of online payments in APAC nations.
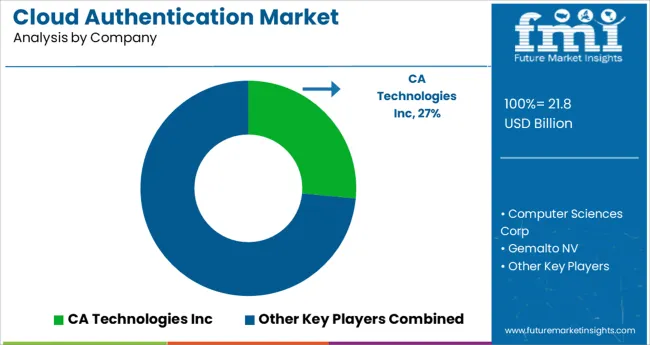
To have the best class opportunities, cloud authentication market players need to overcome digital and automation challenges.
Many manufacturers have used sales automation or enablement systems in some capacity. Time-to-market is still slowed down by manual operations, such as monitoring inventories or orders, when the remainder of the value chain is ignored.
Additionally, a lack of communication might prevent manufacturers and their partners from taking advantage of chances for cloud authentication growth.
Therefore, manufacturers must concentrate on developing connected manufacturing methods that can enable them to identify areas for development and generate new sources of income.
| Areas of Development | Resolution |
|---|---|
| Lack of transparency about partner channels' effectiveness and quality | Companies’ partnerships can be strengthened, and more opportunities become apparent by improving how customers connect with one another. This can be done by:
|
| Inability to adapt quickly to change | Manufacturers can integrate many teams on a single platform and make real-time changes and insights available to all by using cloud-based customer relationship management (CRM) software. By doing this, manufacturers may gather more data and give teams the knowledge they need to work more effectively. In accordance, the cloud authentication market share reveals a sizable area of development. |
Moreover, strategic alliances and standards are contributing to the high demand for cloud authentication. For instance,
Businesses are required by the growing trend of digitization to implement effective, secure, and trustworthy preventive solutions. At the same time, digitization is revolutionizing authenticating methods in ways that have never been possible before. During the anticipated time frame, these improvements are anticipated to drive the cloud authentication market forward.
Recent Developments
The global cloud authentication market is estimated to be valued at USD 21.8 billion in 2025.
It is projected to reach USD 83.9 billion by 2035.
The market is expected to grow at a 14.4% CAGR between 2025 and 2035.
The key product types are single and multifactor.
small offices (1-9 employees) segment is expected to dominate with a 41.3% industry share in 2025.


Our Research Products

The "Full Research Suite" delivers actionable market intel, deep dives on markets or technologies, so clients act faster, cut risk, and unlock growth.

The Leaderboard benchmarks and ranks top vendors, classifying them as Established Leaders, Leading Challengers, or Disruptors & Challengers.

Locates where complements amplify value and substitutes erode it, forecasting net impact by horizon

We deliver granular, decision-grade intel: market sizing, 5-year forecasts, pricing, adoption, usage, revenue, and operational KPIs—plus competitor tracking, regulation, and value chains—across 60 countries broadly.

Spot the shifts before they hit your P&L. We track inflection points, adoption curves, pricing moves, and ecosystem plays to show where demand is heading, why it is changing, and what to do next across high-growth markets and disruptive tech

Real-time reads of user behavior. We track shifting priorities, perceptions of today’s and next-gen services, and provider experience, then pace how fast tech moves from trial to adoption, blending buyer, consumer, and channel inputs with social signals (#WhySwitch, #UX).

Partner with our analyst team to build a custom report designed around your business priorities. From analysing market trends to assessing competitors or crafting bespoke datasets, we tailor insights to your needs.
Supplier Intelligence
Discovery & Profiling
Capacity & Footprint
Performance & Risk
Compliance & Governance
Commercial Readiness
Who Supplies Whom
Scorecards & Shortlists
Playbooks & Docs
Category Intelligence
Definition & Scope
Demand & Use Cases
Cost Drivers
Market Structure
Supply Chain Map
Trade & Policy
Operating Norms
Deliverables
Buyer Intelligence
Account Basics
Spend & Scope
Procurement Model
Vendor Requirements
Terms & Policies
Entry Strategy
Pain Points & Triggers
Outputs
Pricing Analysis
Benchmarks
Trends
Should-Cost
Indexation
Landed Cost
Commercial Terms
Deliverables
Brand Analysis
Positioning & Value Prop
Share & Presence
Customer Evidence
Go-to-Market
Digital & Reputation
Compliance & Trust
KPIs & Gaps
Outputs
Full Research Suite comprises of:
Market outlook & trends analysis
Interviews & case studies
Strategic recommendations
Vendor profiles & capabilities analysis
5-year forecasts
8 regions and 60+ country-level data splits
Market segment data splits
12 months of continuous data updates
DELIVERED AS:
PDF EXCEL ONLINE
Cloud Data Encryption Solutions Market Size and Share Forecast Outlook 2025 to 2035
Cloud Service Market Size and Share Forecast Outlook 2025 to 2035
Cloud Analytics Market Size and Share Forecast Outlook 2025 to 2035
Cloud ERP Industry Analysis in Latin America Forecast Outlook 2025 to 2035
Cloud Backup Service Industry Analysis in Latin America Size and Share Forecast Outlook 2025 to 2035
Cloud Compliance Market Size and Share Forecast Outlook 2025 to 2035
Cloud-Based ITSM Market Size and Share Forecast Outlook 2025 to 2035
Cloud IT Infrastructure Hardware Market Size and Share Forecast Outlook 2025 to 2035
Cloud POS Market Size and Share Forecast Outlook 2025 to 2035
Cloud Systems Management Software Market Size and Share Forecast Outlook 2025 to 2035
Cloud Telephony Services Market Size and Share Forecast Outlook 2025 to 2035
Cloud Field Service Management (FSM) Market Size and Share Forecast Outlook 2025 to 2035
Cloud Seeding System Market Size and Share Forecast Outlook 2025 to 2035
Cloud Professional Services Market Size and Share Forecast Outlook 2025 to 2035
Cloud Based Collaboration Software Market Size and Share Forecast Outlook 2025 to 2035
Cloud Printing Services Market Size and Share Forecast Outlook 2025 to 2035
Cloud Migration Service Market Size and Share Forecast Outlook 2025 to 2035
Cloudifier Market Size and Share Forecast Outlook 2025 to 2035
Cloud Database and DBaaS Market Size and Share Forecast Outlook 2025 to 2035
Cloud ERP Market Size and Share Forecast Outlook 2025 to 2035

Thank you!
You will receive an email from our Business Development Manager. Please be sure to check your SPAM/JUNK folder too.
Chat With
MaRIA