The global citrus pulp fiber market is worth USD 197.6 million in 2025 and is expected to reach USD 381.5 million by 2035, reflecting a CAGR of 6.8%. Factors driving this growth include rising demand for clean-label and plant-based ingredients, increasing use of citrus pulp fiber in bakery, beverages, dairy alternatives, and nutraceuticals, and the growing preference for natural dietary fibers. Additionally, the expansion of health-focused retail infrastructure and increasing consumer awareness of sustainable, eco-friendly ingredients are contributing to the market’s expansion.
By 2030, the citrus pulp fiber market is forecasted to reach USD 285.0 million, reflecting steady growth throughout the forecast period. The absolute dollar growth between 2025 and 2035 is expected to be around USD 183.9 million, indicating consistent and reliable expansion. Market growth is anticipated to accelerate in the latter half of the timeline, driven by increased adoption in gluten-free bakery, plant-based dairy substitutes, functional beverages, premium supplements, and personal care formulations. This growth is further supported by rising consumer demand for fiber-rich, natural, and sustainable food and non-food products across global markets.
Companies such as Fiberstar Inc., CP Kelco USA Inc., and Ceamsa,are strengthening their competitive positions through investments in advanced fiber processing technologies and scalable production systems. Innovation-driven procurement models are enabling expansion into nutraceuticals, personal care, and eco-friendly packaging applications utilizing citrus pulp fiber. The market’s performance will continue to be anchored by strict regulatory compliance, high quality standards, and commitments to sustainable sourcing practices across the global citrus fiber supply chain.
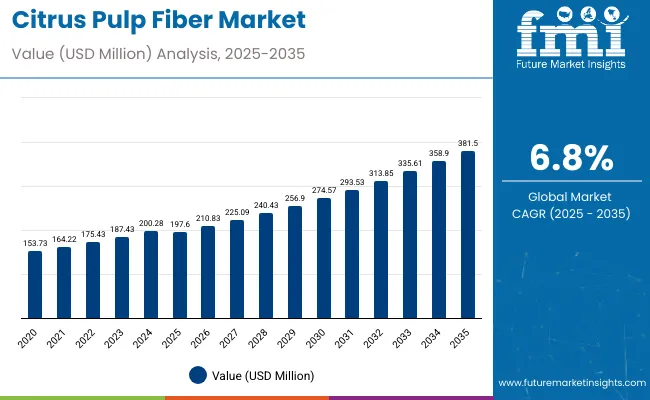
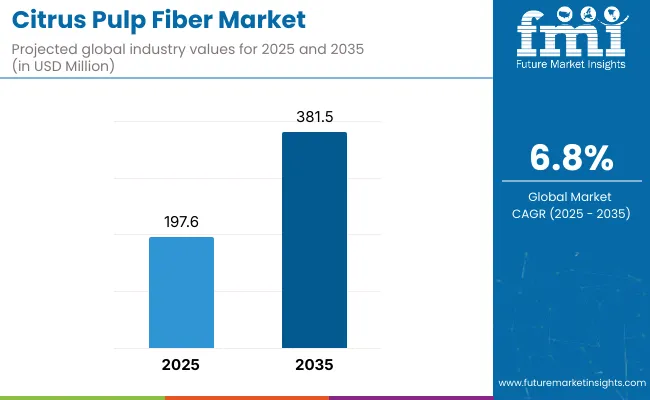
| Metric | Value |
|---|---|
| Estimated Size (2025E) | USD 197.6 million |
| Projected Value (2035F) | USD 381.5 million |
| CAGR (2025 to 2035) | 6.8% |
The market holds a significant share across multiple parent segments. It accounts for 30% of the dietary fiber ingredients market, driven by its natural fiber enrichment and functional properties in bakery, beverages, and dairy alternatives. The market contributes about 25% to the clean-label and plant-based food ingredients sector, supported by adoption in gluten-free bakery, protein bars, and nutraceutical formulations. Citrus pulp fiber also holds close to 20% of the natural stabilizers and texturizers market, valued for its emulsifying and water-holding properties. In functional beverages, it captures around 15% of the market share, favored for fiber fortification and clean-label positioning.
The market is evolving with rising demand for clean-label, plant-based, and functional ingredients. Innovations in extraction and processing technologies are enhancing solubility, texture, and nutritional properties, enabling broader applications in bakery, beverages, dairy alternatives, and nutraceuticals. Growing consumer awareness of dietary fiber benefits, coupled with the rise of gluten-free, vegan, and fortified product lines, is reshaping market dynamics and accelerating adoption across global food and personal care industries.
The market is growing strongly due to several key factors. A major driver is the rising consumer demand for clean-label, plant-based, and functional food ingredients. Citrus pulp fiber is valued for its natural dietary fiber enrichment, water-holding capacity, and emulsifying properties, making it a preferred choice in bakery, beverages, dairy alternatives, and nutraceuticals. This aligns with increasing health consciousness globally, including consumers seeking gluten-free, vegan, and fiber-fortified products.
Additionally, the trend toward sustainable and minimally processed ingredients encourages adoption of citrus pulp fiber across food and personal care applications. It is increasingly used as a fat replacer, texture enhancer, and fortification agent in clean-label snacks, beverages, and supplements.
Geographically, growth is strongest in Asia-Pacific, Europe, and North America, supported by rising disposable incomes, urbanization, and expanding retail and e-commerce infrastructure. Innovations in processing technologies, organic and fortified variants, and sustainable sourcing practices further boost market penetration, enhancing appeal to health-focused and environmentally conscious consumers.
The market is segmented by nature, grade, source, and region. By grade, the market is bifurcated into food and pharma. By nature, the market is segmented into organic and conventional. Based on source, the market is divided into orange, tangerines/mandarins, grapefruit, lemon, and lime. Regionally, the market is classified into North America, Latin America, Western Europe, Eastern Europe, South Asia and Pacific, East Asia, Middle East and Africa.
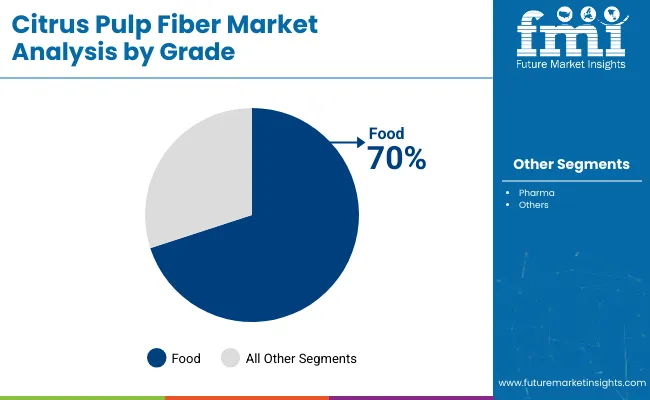
Food grade citrus pulp fiber is expected to dominate the grade segment in 2025, holding a 70% market share. Its widespread use in bakery, beverages, and dairy alternative products is driven by its functional benefits such as water retention, emulsification, and fiber enrichment, which improve texture, stability, and nutritional value. This grade is highly versatile and suitable for both mass-market and premium formulations, making it attractive to manufacturers targeting clean-label, gluten-free, and fiber-fortified products.
These are particularly favored for bakery and beverage applications due to their ease of incorporation and consistency in performance. Additionally, food grade citrus pulp fiber offers cost-efficiency and scalability, enabling bulk production while maintaining product quality. The rising demand for functional, plant-based, and fiber-enriched foods in regions like Asia-Pacific, North America, and Europe further strengthens the segment’s market share. Its widespread adoption across retail, foodservice, and e-commerce channels ensures steady growth throughout the forecast period.
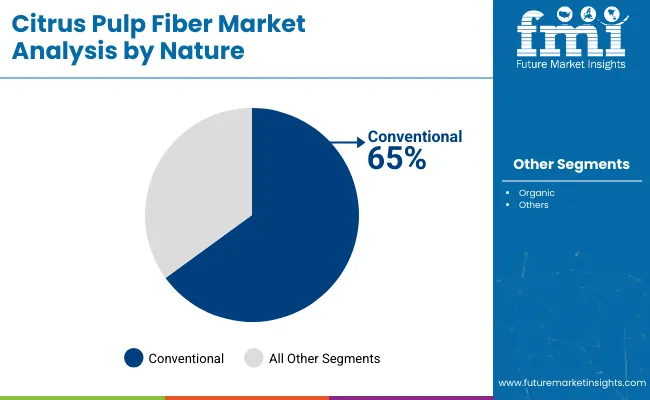
Conventional citrus pulp fiber leads the nature segment in 2025, capturing a 65% share, primarily due to its wide availability, cost-effectiveness, and versatility across bakery, beverages, dairy alternatives, and nutraceutical applications. Conventional fibers are preferred in high-volume production where consistent quality, functional performance, and affordability are critical for manufacturers.
The segment is driven by adoption in large-scale food processing and beverage industries, where conventional fibers are used for water-binding, emulsification, and texture enhancement. Manufacturers are improving functionality through optimized extraction and processing technologies to meet industry requirements.
From 2025 to 2035, growing consumer demand for clean-label, plant-based, and functional food and beverage products is driving significant growth in the citrus pulp fiber market. Increasing awareness of dietary fiber benefits and rising adoption of gluten-free, vegan, and fiber-fortified products are encouraging manufacturers to invest in advanced extraction and processing technologies, expanding product portfolios and enhancing functional performance across bakery, beverages, dairy alternatives, and nutraceutical applications.
Rising Health-Conscious Consumption Fuels Market Growth
A steady increase in consumer focus on health, wellness, and nutrition is a primary growth driver. Consumers increasingly prefer foods and beverages enriched with natural fiber to support digestive health, weight management, and overall wellness. Foodservice brands and retail manufacturers are incorporating citrus pulp fiber into bakery items, beverages, protein bars, and functional snacks, ensuring high quality and consistent functional benefits to meet evolving health-conscious consumer expectations.
Innovation in Processing and Product Development Expands Market Opportunities
Technological advancements in citrus fiber extraction, solubility enhancement, and formulation stability are improving shelf life, texture, and nutritional profile of end products. Development of organic, fortified, and sustainably sourced citrus pulp fiber products, along with certifications, appeals to environmentally conscious and health-driven consumers. Additionally, integration into personal care, pet food, and clean-label food products is broadening application areas. These innovations, coupled with sustainable sourcing initiatives and expanding retail and e-commerce channels, are creating new opportunities for premium and functional products, fueling steady market expansion over the forecast period.
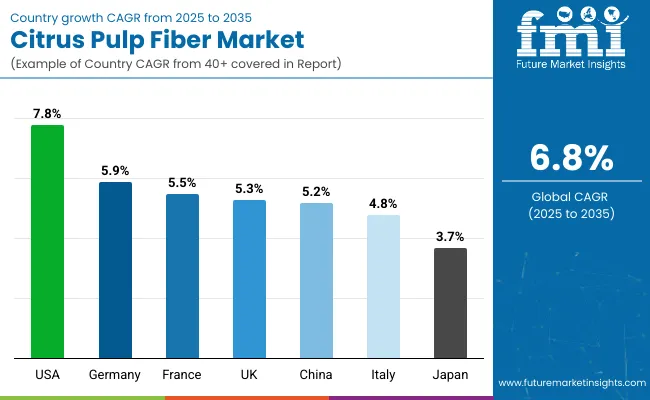
| Country | CAGR (2025 to 2035) |
| United States | 7.8% |
| Germany | 5.9% |
| France | 5.5% |
| United Kingdom | 5.3% |
| China | 5.2% |
| Italy | 4.8% |
| Japan | 3.7% |
The United States leads the citrus pulp fiber market with a strong CAGR of 7.8%, driven by rising demand for fiber-fortified bakery, beverages, and dairy alternatives, along with clean-label and plant-based food trends. Germany follows at 5.9%, supported by functional bakery products and allergen-free fortified foods. France records 5.5%, fueled by plant-based diet adoption and fiber-enriched product innovations. The UK’s 5.3% CAGR reflects growing vegan and allergen-free consumption trends. China achieves 5.2%, propelled by investments in processing technologies and e-commerce expansion. Italy shows moderate growth at 4.8%, leveraging traditional culinary uses, while Japan grows steadily at 3.7% through niche health-focused applications.
The report covers an in-depth analysis of 40+ countries; seven top-performing OECD countries are highlighted below.
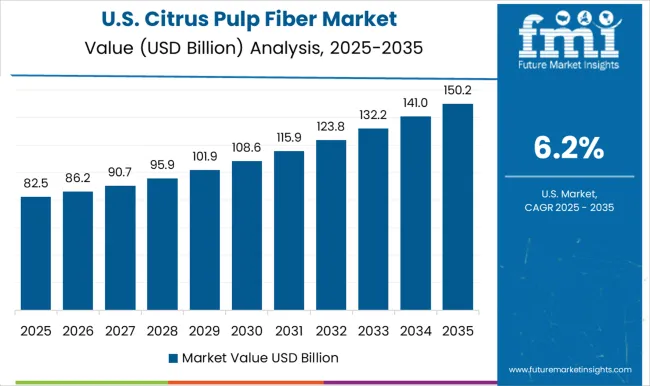
Revenue from citrus pulp fiber in the USA is projected to grow at a CAGR of 7.8% from 2025 to 2035, driven by rising demand for fiber-fortified bakery, beverage, and dairy alternative products. Growth is supported by clean-label and plant-based food trends, along with the expansion of retail, e-commerce, and foodservice channels. Advanced extraction and processing technologies enhance functional properties and shelf life. Sustainability initiatives and organic certifications further strengthen market credibility. The USA market sets a benchmark for product innovation and consumer adoption globally.
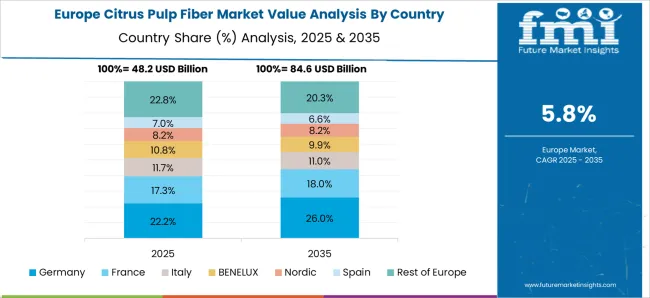
Sales of citrus pulp fiber in Germany are projected to grow at a CAGR of 5.9% from 2025 to 2035, driven by consumer preference for natural, clean-label, and fiber-enriched foods. Citrus pulp fiber is increasingly used in bakery, beverages, and dietary supplement applications. Retailers expand offerings with fortified and organic fiber products. Manufacturers invest in advanced processing to improve texture, solubility, and functional performance. Sustainability and quality certifications support market trust.
Demand for citrus pulp fiber in France is projected to grow at a CAGR of 5.5% from 2025 to 2035, supported by trends toward fiber-enriched functional foods and plant-based diets. Citrus pulp fiber is increasingly integrated into bakery, dairy alternatives, and beverage applications. Retail and online channels facilitate broader product availability. Product innovation in fortified and organic fiber enhances consumer adoption. Health-conscious and flexitarian consumers drive market demand, while sustainable sourcing practices strengthen market credibility.
The citrus pulp fiber market in UK is projected to grow at a CAGR of 5.3% from 2025 to 2035, fueled by rising demand for vegan, allergen-free, and fiber-fortified products. Citrus pulp fiber is widely used in beverages, bakery, and dairy alternative formulations. Retailers and e-commerce platforms are expanding distribution, while manufacturers focus on functional improvements and clean-label certification. Growing consumer awareness of health and wellness strengthens adoption.
Revenue from citrus pulp fiber in China is expected to expand at a CAGR of 5.2% during 2025 to 2035, fueled by increasing consumer interest in plant-based nutrition and functional foods. Investment in large-scale extraction and processing facilities improves product quality and consistency. The growth of online retail channels makes citrus pulp fiber more accessible in beverages, bakery products, and dietary supplements. Government initiatives promoting healthier diets are driving adoption. Sustainable sourcing and organic certifications are gaining importance.
Demand for citrus pulp fiber in Italy is projected to grow at a CAGR of 4.8% from 2025 to 2035, supported by traditional culinary uses and growing consumer preference for natural, fiber-enriched foods. Citrus pulp fiber is used in bakery, beverages, and dessert applications. Regional producers emphasize quality and organic certifications. Retailers and e-commerce platforms are expanding reach, while manufacturers improve solubility and functional performance. Sustainability initiatives and clean-label products further enhance market adoption.
Sales of citrus pulp fiber in Japan are expected to grow at a CAGR of 3.7% from 2025 to 2035, driven by niche demand for fiber-enriched functional foods, nutraceuticals, and beverages. Citrus pulp fiber is incorporated into supplements and bakery items targeting digestive health. Premium pricing strategies, clean-label preferences, and product innovation support adoption. Consumer awareness of health benefits and functional ingredients fuels market growth, despite slower overall expansion compared with other countries.
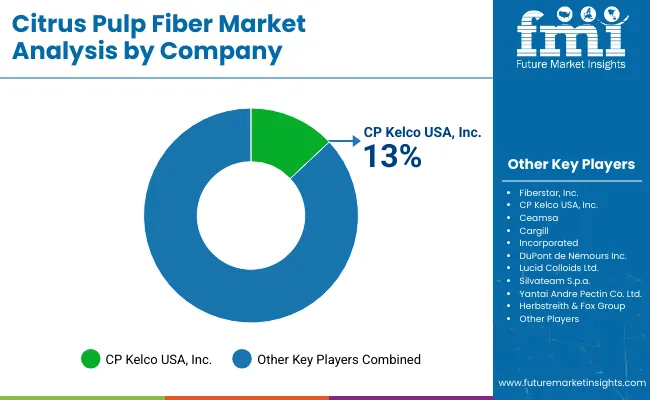
The market is moderately fragmented, comprising global leaders and regional players that together create a diversified supply chain. Key companies such as CP Kelco USA, Fiberstar, Inc., Cargill, Incorporated, DuPont de Nemours Inc., and Lucid Colloids Ltd. compete on product functionality, purity, and sustainability. Citrus pulp fiber is increasingly used as a plant-based ingredient for fiber fortification in bakery, beverages, dairy alternatives, and nutritional supplements, driven by rising consumer awareness of dietary fiber benefits and clean-label trends. North America, Europe, and Asia Pacific remain the primary growth regions, with manufacturers focusing on premium and specialty product offerings to cater to health-conscious and environmentally aware consumers.
Leading firms are emphasizing vertical integration, advanced extraction technologies, and processing innovations to improve solubility, texture, and functional properties. CP Kelco USA and Fiberstar, Inc. invest in scalable processing systems and sustainable sourcing, while Cargill and DuPont de Nemours develop customized fiber solutions for beverages, bakery, and dietary supplements, maintaining high-quality, non-GMO, and clean-label compliance. Companies such as Silva team S.p.a., Ceamsa, and Yantai Andre Pectin Co. Ltd. target niche applications in nutraceuticals, fortified beverages, and eco-friendly packaging. Sustainability, regulatory compliance, and product differentiation through organic certification and functional enhancements remain central to competitive strategies, enabling firms to capture growing global demand for citrus pulp fiber across diverse industrial applications.
| Items | Values |
| Quantitative Units (2025) | USD 197.6 million |
| Nature | Organic and Conventional |
| Grade | Food and Pharma |
| Source | Oranges, Tangerines/Mandarins, Grapefruit, Lemon, and Lime |
| Regions Covered | North America, Latin America, Western Europe, Eastern Europe, South Asia, Pacific, East Asia, and the Middle East and Africa |
| Countries Covered | United States, Canada, United Kingdom, Germany, France, China, Japan, South Korea, Brazil, Australia, and 40+ countries |
| Key Players | Fiberstar , Inc., CP Kelco USA, Inc., Ceamsa , Cargill, Incorporated, DuPont de Nemours Inc., Lucid Colloids Ltd., Silvateam S.p.a ., Yantai Andre Pectin Co. Ltd., Herbstreith & Fox Group, Herbafood Ingredients GmbH, Carolina Ingredients, UNIPEKTIN Ingredients AG |
| Additional Attributes | Dollar sales and growth by nature, grade, and source; segment-wise market share analysis; country-wise market analysis; consumer preference for clean-label and sustainable citrus ingredients; innovations in fiber processing; and global quality standardization |
The global citrus pulp fiber market is estimated to be valued at USD 197.6 billion in 2025.
The market size for the citrus pulp fiber market is projected to reach USD 370.8 billion by 2035.
The citrus pulp fiber market is expected to grow at a 6.5% CAGR between 2025 and 2035.
The key product types in citrus pulp fiber market are organic and conventional.
In terms of grade, food segment to command 62.7% share in the citrus pulp fiber market in 2025.


Full Research Suite comprises of:
Market outlook & trends analysis
Interviews & case studies
Strategic recommendations
Vendor profiles & capabilities analysis
5-year forecasts
8 regions and 60+ country-level data splits
Market segment data splits
12 months of continuous data updates
DELIVERED AS:
PDF EXCEL ONLINE
Citrus Molasses Market Size and Share Forecast Outlook 2025 to 2035
Citrus Seeds Market Size and Share Forecast Outlook 2025 to 2035
Citrus Oil Market Analysis - Size, Share, and Forecast Outlook 2025 to 2035
Citrus Gummies Market Analysis - Flavor Trends & Growth 2025 to 2035
Citrus Pectin Market Size, Growth, and Forecast for 2025 to 2035
Citrus Crop Nutrition Market Analysis by Product Type, Application, Sustainability Practices, and Regional Forecast from 2025 to 2035
Citrus Water Market Trends – Growth & Consumer Insights 2025 to 2035
Citrus Yogurt Market Insights – Flavor Trends & Consumer Demand 2025 to 2035
Citrus Flavors Market Report – Trends & Innovations 2025 to 2035
Citrus Alcohol Market Trends - Flavor Innovations & Demand 2025 to 2035
Citrus Solvents Market Insights Trends & Forecast 2025 to 2035
Citrus Powder Market Outlook – Growth, Demand & Forecast 2024 to 2034
Citrus Aurantium Extract Market – Growth, Applications & Industry Trends
Citrus bioflavonoid Market
Citrus Fiber Market Trends - Functional Applications & Growth 2025 to 2035
Citrus Pulp Market Analysis - Trends & Growth Forecast 2025 to 2035
Demand for Citrus Oil in EU Size and Share Forecast Outlook 2025 to 2035
Pulp Roll Cradle Market Forecast and Outlook 2025 to 2035
Pulp Molding Tooling Market Size and Share Forecast Outlook 2025 to 2035
Pulp Liner Market Analysis - Size and Share Forecast Outlook 2025 to 2035

Thank you!
You will receive an email from our Business Development Manager. Please be sure to check your SPAM/JUNK folder too.
Chat With
MaRIA