The Cellular IoT Module Market is estimated to be valued at USD 25.7 billion in 2025 and is projected to reach USD 210.4 billion by 2035, registering a compound annual growth rate (CAGR) of 23.4% over the forecast period.
| Metric | Value |
|---|---|
| Cellular IoT Module Market Estimated Value in (2025 E) | USD 25.7 billion |
| Cellular IoT Module Market Forecast Value in (2035 F) | USD 210.4 billion |
| Forecast CAGR (2025 to 2035) | 23.4% |
The cellular IoT module market is experiencing consistent growth driven by rising deployment of connected devices, expanding machine to machine communication, and the global shift toward smart infrastructure. Enhanced cellular network coverage and declining costs of modules have facilitated broad scale adoption across industries seeking real time data transmission and remote monitoring.
The demand for higher bandwidth, low latency, and secure connections has positioned cellular technologies as critical enablers for IoT ecosystems. Governments and enterprises are investing in IoT to improve efficiency, sustainability, and automation across sectors including transportation, agriculture, utilities, and manufacturing.
With the introduction of next generation network standards and stronger cybersecurity frameworks, the market outlook remains strong as more devices and systems become interconnected and reliant on mobile connectivity for seamless operations..
The market is segmented by Component, Cellular Technology, and End Use Industry and region. By Component, the market is divided into Hardware and Software. In terms of Cellular Technology, the market is classified into 3G, 4G, 5G, LTE-M, NB-Iot, and Others. Based on End Use Industry, the market is segmented into Agriculture, Healthcare, Retail, Energy, Automotive & Transportation, Infrastructure, and Others. Regionally, the market is classified into North America, Latin America, Western Europe, Eastern Europe, Balkan & Baltic Countries, Russia & Belarus, Central Asia, East Asia, South Asia & Pacific, and the Middle East & Africa.
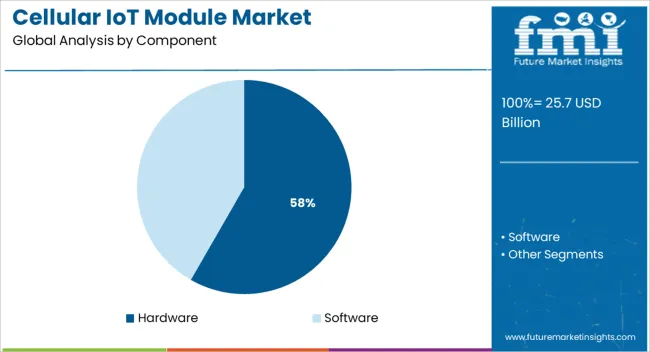
The hardware segment is anticipated to contribute 58.30% of the total market revenue by 2025, making it the most dominant within the component category. This segment includes essential physical modules, chipsets, and antenna systems required for enabling cellular connectivity in IoT devices.
Its leadership position is reinforced by the growing scale of device deployment and the need for reliable, durable, and scalable hardware solutions. Manufacturers are focusing on miniaturization, energy efficiency, and enhanced compatibility across multiple networks.
Hardware investment continues to account for the majority of implementation costs, particularly in industrial and large scale applications. As IoT devices are increasingly embedded across diverse environments from agriculture to automotive, the foundational role of hardware in connectivity infrastructure continues to sustain its dominance.
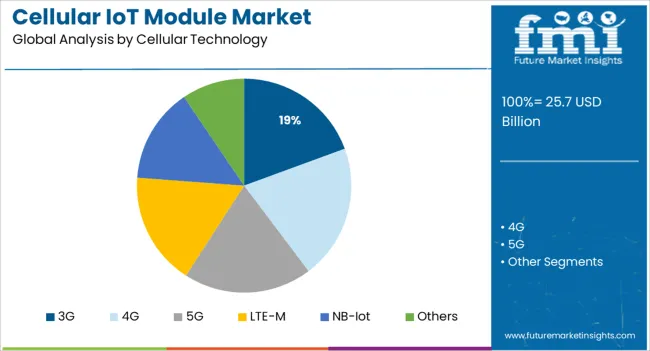
The 3G segment is projected to represent 19.40% of total market share by 2025 within the cellular technology category. While newer technologies are emerging, 3G remains relevant due to its widespread global infrastructure, particularly in developing regions where it serves as a stable and cost effective solution for IoT connectivity.
Applications with moderate bandwidth requirements, such as tracking systems, asset monitoring, and smart meters, still rely on 3G networks. Its continued use is also supported by the extended transition timelines in areas where LTE and 5G rollouts are slower.
The reliability, broad coverage, and legacy integration capabilities of 3G ensure its persistent adoption, especially for low to medium complexity IoT applications.
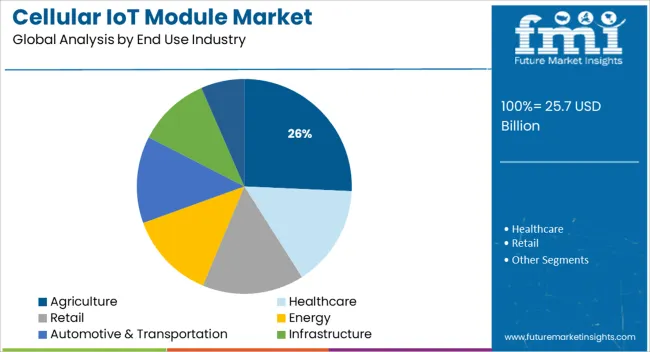
The agriculture segment is expected to hold 25.70% of the total market by 2025, making it the leading end use industry. The growth of this segment is driven by the need for precision farming, real time crop monitoring, livestock tracking, and irrigation management.
Cellular IoT modules provide farmers and agribusinesses with actionable data that supports improved yield, resource optimization, and predictive analytics. As rural areas become increasingly connected and technology penetration deepens, cellular based solutions offer reliable communication channels that enable scalable smart agriculture practices.
Government incentives, sustainability mandates, and the push for food security further strengthen adoption. The agriculture industry’s growing dependence on remote sensors and data driven decision making has firmly positioned it at the forefront of cellular IoT module integration.
The adoption trends for cellular IoT modules in healthcare facilities are driven by the growing demand for interconnected healthcare systems, as well as the need to reduce hospital admissions, medical errors, and rising healthcare costs.
Government programs to support IoT in healthcare and the rising popularity of mHealth services are also anticipated to fuel the market's expansion. The rising number of healthcare facilities and the rising demand for healthcare services are affecting the overall cellular IoT module market share.
Due to the rising demand for connected vehicles, the cellular IoT module market in the automotive sector is anticipated to expand significantly throughout the forecast period. Given that they allow vehicles to communicate with one another and with external entities, connected cars are predicted to bring about significant changes in the automotive industry.
This is likely to increase security, ease road congestion, and make transportation more effective. Firstly, in response to the rising demand for connected cars, there is a significant need for cellular IoT modules in automotive applications.
Secondly, the need for cellular IoT modules in automotive applications is anticipated to increase, along with the demand for advanced driver assistance systems (ADAS). Lastly, it is anticipated that the rising need for telematics and infotainment systems would further propel the cellular IoT module market expansion.
The adoption of cellular IoT modules in the logistics industry is anticipated to rise in response to the growing necessity for real-time tracking of shipments. Furthermore, the market is anticipated to increase as a result of the rising trends in automation and remote monitoring.
The logistics industry's growing applications of modules are predicted to present a wide range of opportunities for cellular IoT module market participants. In addition, efforts made by various governments to encourage applications in the logistics industry are anticipated to assist market expansion.
5G networks are the trending revolution in the market. It gives cellular IoT module market players a larger scope during the forecast period. Moreover, sales revenue in the cellular IoT module market industry expanded at a 17% CAGR from 2020 to 2025. According to FMI, by 2035, the market CAGR is likely to rise by 23.4%.
Currently, the telecom sector enhances the cellular IoT module market outlook. The rise of the market is also supported by speedy digitization and rising automation across sectors. Many medium-sized and large-scale organizations are implementing solutions for the Narrowband Internet of Things (NB-IoT) and Long-Term Evolution for Machines (LTE-M).
Moreover, these technologies can be incorporated with the present mobile networks to provide enhanced end-to-end security, device-level access and authentication, and encrypted data transport.
The components and tools required for the cellular IoT module are contained in a connected ecosystem. They assist in streamlining applications for numerous crucial businesses, however, they are susceptible to hackers.
It has become simpler for hackers to launch cyberattacks utilizing cellular and IoT vulnerabilities as a result of the growth of IoT devices on cellular networks. Most cellular IoT devices depend on cloud networks to function properly.
Additionally, cellular IoT security strategy must include cloud-based security since unsecured cloud infrastructure increases the risk of data theft and device piracy. For instance, a drone used for delivery or surveillance can process information like navigational directions and imaging data on its own. However, it might send any recorded videos or logs to a cloud server. There may be a threat to the network or other devices.
During the projected period, a CAGR of 26.5% is anticipated for the hardware segment.
The largest portion of the global cellular IoT market is owned by the hardware sector. Hardware components like chipsets and cellular IoT modules serve as the framework for the complete cellular IoT ecosystem.
Additionally, the use of cellular IoT modules in wearables, connected healthcare devices, smart city infrastructure, and building automation projects is expected to increase, which fuels the expansion further.
During the forecast period, the energy industry is anticipated to increase and had the highest CAGR of 28.1%. It is projected that cellular technologies would become more popular in applications needing large deployments and dense endpoint connections.
Therefore, the sectors of manufacturing, utilities, and energy stand to benefit the most. The technology is being used in smarter city applications, which is expanding the opportunities in the market.
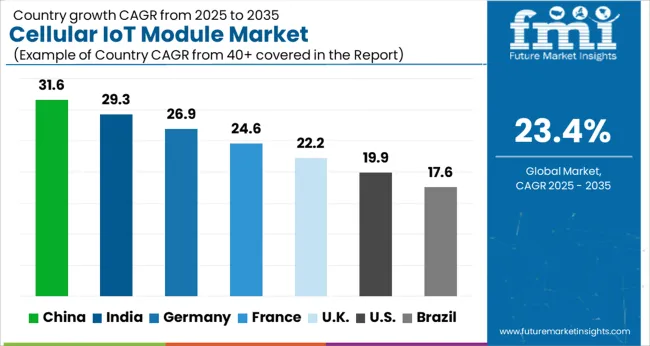
Despite the lockdowns, China remained the largest IoT market in the world, accounting for more than half of the demand. Sales of cellular IoT modules in the nation slightly increased from earlier months this year, propelled by lockdown-triggered applications like smart locks, security cameras, and routers.
The Chinese companies have gotten bigger, making it very difficult for international brands to grow in silos. This is a vital phase for the IoT module market. Again, despite growing from a lower base, India's IoT module market experienced the fastest growth (+264% YoY), driven by smart meters, telematics, POS, and automotive applications.
By providing for its enormous customer base of current and potential customers, as well as its extensive cellular network, China Mobile maintained its fourth place in the global cellular IoT module market.
The operator and Xinyi Semiconductor collaborated to concentrate on lower-end applications. Both have benefited from being able to target 2G to 4G IoT applications in transition.
Moreover, the world's largest operator is able to scale its end-to-end 5G IoT solutions quickly over the coming quarters due to China Mobile's expanding 5G footprint and partnerships with companies across the value chain.
Due to the strong pursuit of IoT implementation projects by solution vendors and component manufacturers, North America now holds the greatest share of the worldwide cellular IoT module market.
The ability of industries to quickly adopt smart and connected devices, as well as the frequently changing nature of the technology landscape, are key growth drivers for the area.
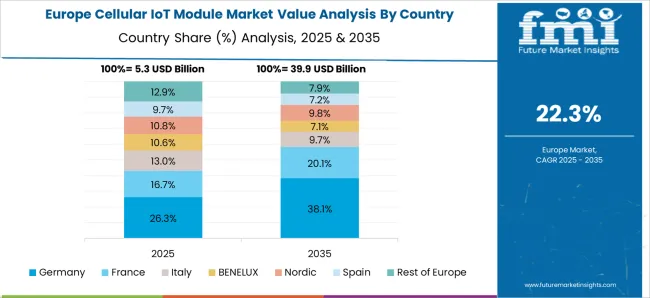
Over the course of the projected period, Europe's market for cellular IoT modules is anticipated to rise impressively. This is mostly due to the region's growing demand for practical and affordable IoT solutions.
The region's expanding use of 5G technology is anticipated to fuel additional market expansion. High data rates, better latency, and higher coverage provided by 5G technology are projected to increase demand for cellular IoT modules.
Additionally, the presence of a sizable population of tech-savvy consumers and the growing trend of digitization in a number of the region's countries are anticipated to fuel market growth. The demand for cellular IoT modules in Europe is anticipated to grow at a faster rate due to the rising demand for connected products.
Key Players Count on Telematics and Smart Grid to Have a Competitive Advantage
Telematics solution providers now include cellular IoT modules in their product lines, making it simpler for fleet managers and OEMs of off-highway vehicles to collect and analyze data to spot important trends and problems in the field's instrumentation usage.
Additionally, it is anticipated that a number of factors, including strong security, ubiquitous quality, and resilient networks, energize the industry over the ensuing many years.
Due to their extensive investments in the telecommunications industry and pertinent smart grid connectivity, major players in the cellular IoT module market have a sizable position.
The global cellular IoT module market is estimated to be valued at USD 25.7 billion in 2025.
The market size for the cellular IoT module market is projected to reach USD 210.4 billion by 2035.
The cellular IoT module market is expected to grow at a 23.4% CAGR between 2025 and 2035.
The key product types in cellular IoT module market are hardware and software.
In terms of cellular technology, 3g segment to command 19.4% share in the cellular IoT module market in 2025.


Full Research Suite comprises of:
Market outlook & trends analysis
Interviews & case studies
Strategic recommendations
Vendor profiles & capabilities analysis
5-year forecasts
8 regions and 60+ country-level data splits
Market segment data splits
12 months of continuous data updates
DELIVERED AS:
PDF EXCEL ONLINE
Cellular Push-to-talk Market Size and Share Forecast Outlook 2025 to 2035
Cellular Modem Market Size and Share Forecast Outlook 2025 to 2035
Cellular M2M Market Size and Share Forecast Outlook 2025 to 2035
Cellular Renewal Actives Market Analysis - Size and Share Forecast Outlook 2025 to 2035
Cellular Vehicle-To-Everything (C-V2X) Market Size and Share Forecast Outlook 2025 to 2035
Cellular Blinds & Shades Market Size and Share Forecast Outlook 2025 to 2035
Cellular Health Supplement Market Size and Share Forecast Outlook 2025 to 2035
Cellular Rubber Market Growth - Trends & Forecast 2025 to 2035
Cellular Pathology Market Analysis – Size, Share & Forecast 2025 to 2035
Cellular M2M Connections and Services Market - Trends & Forecast 2025 to 2035
Cellular Nutrition Market Analysis by Product Type, End User, Form, Function, Sales Channel and Region from 2025 to 2035
Cellular Reprogramming Tools Market – Demand & Forecast 2025 to 2035
Cellular Epigenetics Market
Cellular IoT Market Size and Share Forecast Outlook 2025 to 2035
Microcellular Foam Market Size and Share Forecast Outlook 2025 to 2035
Extracellular Matrix Proteins Market
Hepatocellular Carcinoma HCC Treatment Market Size and Share Forecast Outlook 2025 to 2035
Repeaters for Cellular Network Market Forecast and Outlook 2025 to 2035
Unresectable Hepatocellular Carcinoma Market - Growth & Outlook 2025 to 2035
IoT Network Management Market Size and Share Forecast Outlook 2025 to 2035

Thank you!
You will receive an email from our Business Development Manager. Please be sure to check your SPAM/JUNK folder too.
Chat With
MaRIA