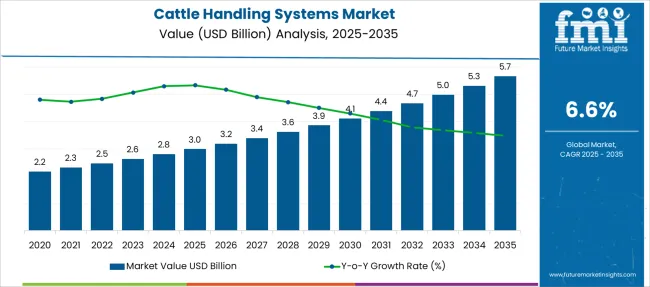
The Cattle Handling Systems Market is estimated to be valued at USD 3.0 billion in 2025 and is projected to reach USD 5.7 billion by 2035, registering a compound annual growth rate (CAGR) of 6.6% over the forecast period.
| Metric | Value |
|---|---|
| Cattle Handling Systems Market Estimated Value in (2025 E) | USD 3.0 billion |
| Cattle Handling Systems Market Forecast Value in (2035 F) | USD 5.7 billion |
| Forecast CAGR (2025 to 2035) | 6.6% |
The Cattle Handling Systems market is experiencing stable expansion, driven by rising livestock populations, greater emphasis on animal welfare, and increasing mechanization in agriculture. The current market landscape reflects growing demand for efficient and safe handling systems that reduce labor intensity while ensuring livestock safety and operator protection.
Governmental focus on livestock productivity and disease control, along with rising consumer demand for traceable and ethically handled meat products, is shaping the future trajectory of this market. Technology providers are increasingly integrating digital features and automated controls to align with modern livestock management practices, which is enhancing operational outcomes and sustainability.
Investor presentations and equipment manufacturer briefings highlight the growing role of durable and customizable materials in boosting equipment longevity and lowering total cost of ownership These developments, combined with favorable agricultural support policies in various regions, are expected to pave the way for continued adoption and evolution of cattle handling infrastructure worldwide.
The market is segmented by Type and Application and region. By Type, the market is divided into Steel and Wood. In terms of Application, the market is classified into Cattle, Sheep, and Others. Regionally, the market is classified into North America, Latin America, Western Europe, Eastern Europe, Balkan & Baltic Countries, Russia & Belarus, Central Asia, East Asia, South Asia & Pacific, and the Middle East & Africa.
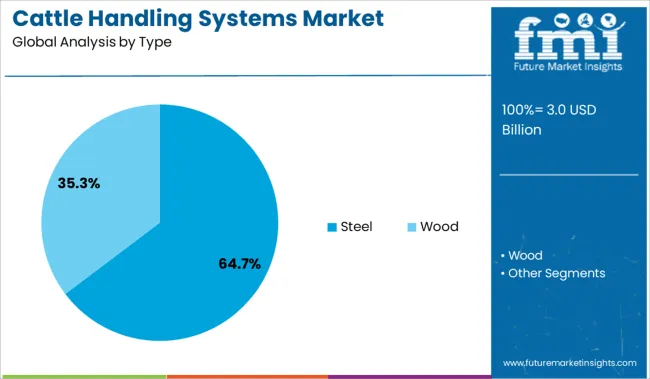
The steel segment is projected to account for 64.7% of the Cattle Handling Systems market revenue share in 2025, establishing it as the leading type segment. This leadership has been driven by the material’s inherent durability, strength, and resistance to environmental degradation, which make it ideal for heavy-duty agricultural applications.
Steel-based systems have been widely adopted across both small and large-scale livestock operations due to their long life cycle and ability to withstand harsh weather conditions and high physical impact. Manufacturers have emphasized in product briefings that the versatility of steel allows for modular and custom designs, enabling tailored solutions for diverse farm requirements.
Additionally, the lower maintenance demands and improved safety for both animals and handlers have contributed to its widespread preference These advantages, combined with increasing availability of galvanized and powder-coated options, have supported the dominant market share of the steel segment within the broader cattle handling systems landscape.
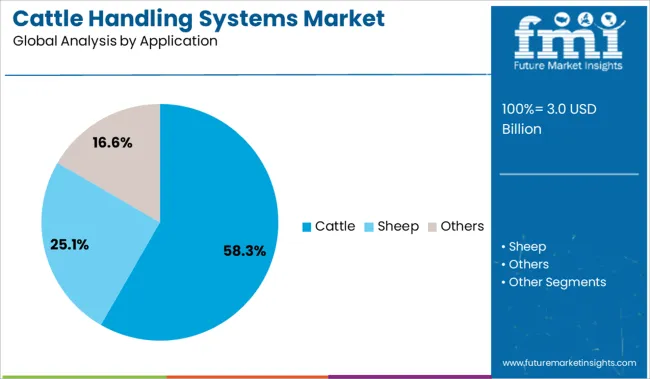
The cattle application segment is expected to represent 58.3% of the overall market revenue in 2025, reinforcing its position as the most prominent application area in the Cattle Handling Systems market. This segment’s growth has been reinforced by the global dominance of cattle farming in the livestock sector and the high frequency of cattle movement within agricultural operations.
Industry communications and producer insights highlight that cattle require more robust and specialized handling systems due to their size, temperament, and the operational scale of cattle-based agribusinesses. Adoption has also been driven by the need to minimize stress during handling, which directly impacts meat and milk productivity.
The increasing focus on biosecurity, vaccination routines, and animal welfare compliance has led to strong demand for systems that provide precision control and operator safety These combined factors have ensured the continued relevance and expansion of cattle-focused handling systems in both developed and developing livestock economies.
Animals have a distinct perspective on the world. They require additional time to comprehend what they have seen because they are unable to perceive the world as clearly and sharply as humans do. Cattle only have a blind spot right behind their heads and have 360-degree panoramic vision. Cattle have an almost infinite range of vision.
Nonetheless, they have a poor depth perception of surrounding objects and only a small amount of vertical vision. They can't concentrate rapidly and have limited vertical vision, so to them, a shadow on the ground looks like a three-mile-deep abyss. By taking these restrictions into account and employing a solid-sided working alley, handling systems can aid in lowering distractions and shadowing.
Recent years have seen a substantial improvement in the designs of cattle handling systems. The primary factor behind this is the development of research on cattle behavior and the industry's shift toward low-stress cattle handling. According to experts, utilizing livestock instinct could be extremely helpful for easing the flow of a handling system and reducing the stress that cattle feel when confined.
The key driver of the market expansion is the rise in the number of dairy plants and the herd population. The cattle handling system is becoming more significant to dairy farmers as a result of the development of dairy businesses. The market is also developing as a result of the increased global demand for dairy products. Over the forecast period, an increase in population is also predicted to raise demand for milk products, which would in turn fuel the growth of the cattle handling systems market.
Preference for cattle handling systems is growing as this help to preserve the health of the animals through observation of cattle behavior, environmental control, and disease detection. In the approaching years, agriculture-based economies are likely to present cattle handling systems with profitable chances.
For improved production, larger farms need a strategy for caring for each livestock. Reduced animal care costs were one of the major advantages of implementing smart farming technology for improved management of farm animals, and this is likely to lead to increased demand for cattle handling systems.
Throughout the forecast period, ongoing activities to protect dairy cows from unethical management techniques are anticipated to fuel market expansion. Additionally, it is anticipated that the lack of skilled dairy practitioners would lead to a rise in the adoption of cattle handling systems.
More public-private financing, investments, and developments in dairy farming and technology are projected to expand market potential. An increase in the trend of government funding for dairy farm efficiency programs and expansions would also create market opportunities. On the other hand, there is an increased awareness of technological advancements among farm owners. The employment of technology in the livestock handling system is also anticipated to create new business opportunities.
The market participants have recognized this emphasis and are capitalizing on it by providing cattle handling systems that are enhanced by a variety of applications for managing cattle. The application of programmed machinery is widely used in the dairy business in economies dependent on agriculture. This phenomenon is expected to be proven as essential to the market's expansion in the next years
The cattle handling systems market is projected to expand at 6.6% CAGR between 2025 and 2035. Historically, the market value of cattle handling systems presented slow-paced development from 2020 to 2025, registering a CAGR of 5.9%.
The indoor livestock handling system was built by cattle specialists at North Dakota State University's Carrington Research Extension center. Its primary focus was to make the job easier for laborers to drive cattle from holding facilities into a scale and/or the squeeze tube,
Demand for cattle handling systems is surging as the design has been proven to be less stressful on the cattle since they move in a more natural flow pattern. Since it takes less effort to move the cattle down the chute, it is also less stressful for the cattle handlers. The fact that it makes the handlers' jobs safer is the third benefit.
| Historical CAGR (2020 to 2025) | 5.9% |
|---|---|
| Forecast CAGR (2025 to 2035) | 6.6% |
On the back of these aspects, the cattle handling systems market is expected to grow 1.9X between 2025 and 2035. As per the FMI analysts, a valuation of USD 4,983 Million by 2035 end is estimated for the market.
| 2020 | USD 1,748.2 Million |
|---|---|
| 2024 | USD 2,329.5 Million |
| 2025 | USD 2,467.2 Million |
| 2025 | USD 2,630 Million |
| 2035 | USD 4,983 Million |
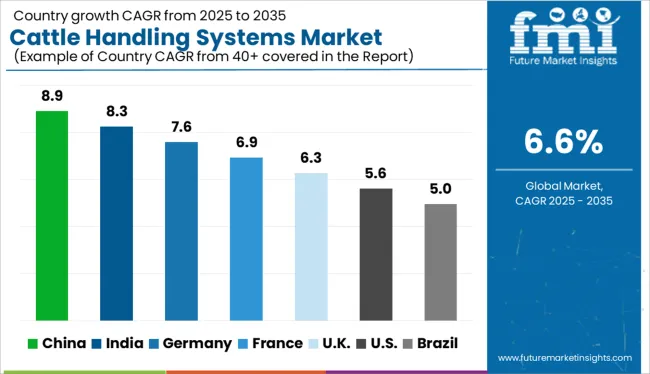
The market for cattle handling systems in North America had the largest share in 2025. During the foreseeable term, it is predicted that the region will remain the dominant one. The expansion of the regional market is a result of high product adoption rates and the existence of key market players. The Asia Pacific region is expected to see the fastest market development as a result of the expansion of dairy farms in developing countries.
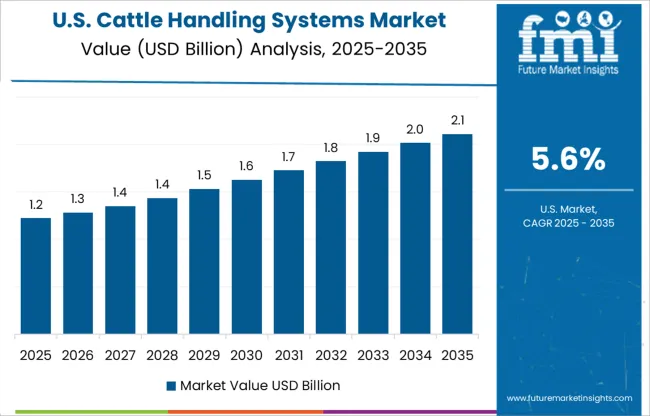
The USA is one of the world's top producers of livestock and other animal-derived goods. The development of dairy farms and rising labor costs in the USA have both had a positive impact on the adoption of cattle handling systems. The country's understanding of the use of cattle management techniques has expanded quickly in recent years coupled with increased practical experience. It is projected that the USA cattle handling systems market would develop because of the extensive adoption of cutting-edge machinery and the urgent need to reduce the cost of livestock management.
| Country | USA |
|---|---|
| Market Share (2025) | 26.4% |
| Market Value (2025) | USD 650.4 Million |
In the USA, the consumption of animal food and byproducts has grown more quickly in recent years. Moreover, the country has the growing significance of the dairy sector, the volume of dairy cows, and the scale of the dairy export sector in the nation. Also, there are so many key market players operating in this region. For instance, Real Industries Ltd. has been offering farmers in the country a variety of manufactured livestock handling systems since 1977.
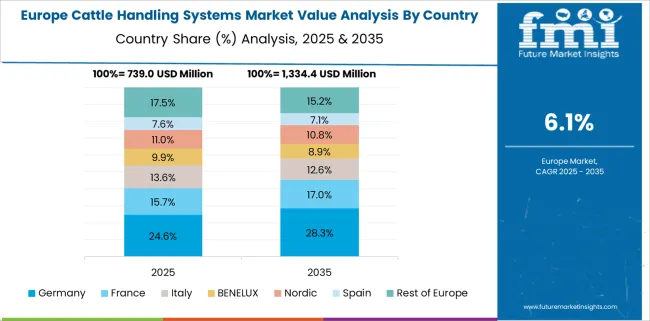
In Europe, Germany has the second-biggest population of cattle and the largest herd of dairy cattle. In this country, dairy cows are raised on around one in four farms. The principal industry is animal husbandry in Germany. 60% of the country's agricultural income is generated by the sale of products from livestock operations, which account for 50% of all farms in Germany.
| Country | Germany |
|---|---|
| Market Share (2025) | 15.8% |
| Market Value (2025) | USD 389.5 Million |
Modifications in production systems and geographical shifts in livestock production are projected to take place in the future in Germany. The primary reason behind this is the considerable changes in the framework conditions for agriculture. Some notable players are also present in Germany, such as GSF Livestock Equipment. To create a very effective and "friendly" system on the farm, they offer handling systems to reduce stress, time, and injury without spending a fortune. Moreover, Germany has a successful livestock protection infrastructure. Therefore, the German cattle handling systems market is indeed profitable for market players.
With herds of up to 3,000 cattle placed in grassless cages for long periods rather than being grazed or raised in barns, the United Kingdom is now home to several industrial-scale rearing facilities. Hence, in the United Kingdom, farms adopt advanced infrastructures to manage this huge volume of cattle. Therefore, the United Kingdom is predicted to hold a significant proportion of the market during the forecast period.
| Country | United Kingdom |
|---|---|
| CAGR (2025 to 2035) | 7.1% |
| Market Share (2025) | 9.4% |
| Market Value (2025) | USD 231.6 Million |
| Market Value (2035) | USD 459.0 Million |
It is anticipated that the United Kingdom cattle handling systems market would expand as a result of the existence of significant companies in addition to expanding agricultural machinery import and export volumes. To build a significant presence, the nation's manufacturers are concentrating on fresh discoveries. Nowadays, major corporations like IAE manufacture em>Any Hand Crowding Pen with a completely coated stock board. Its racing panels are completely covered to a height of 1560 mm to minimize distractions and improve flow.
The global South is home to various countries that have increased their cattle raising in recent decades and are known for having largely agricultural economies. India is no different from other emerging nations that have benefited from the very lucrative industry. This is mostly because of the introduction of industrialized agricultural techniques to increase output at the expense of moral and sustainable raising standards. Milk and other dairy products with added value appear to have permanently etched themselves into the local culinary terrain, with the dairy industry accounting for 26% of the nation's agriculture GDP.
| Country | India |
|---|---|
| CAGR (2025 to 2035) | 7.8% |
| Market Share (2025) | 4.2% |
| Market Value (2025) | USD 103.2 Million |
| Market Value (2035) | USD 217.7 Million |
India is currently the largest milk producer in the world and plays a crucial role in the supply chains of its neighbors who lack access to milk. Given this, the sector is crucial both economically and culturally. Dairy producers therefore always strive to upgrade their facilities. Owing to the growing need for agricultural mechanization and government support for it, the Indian cattle handling systems market growth is anticipated to expand.
Statistics show that dairy farms in China that are classified as large-scale, or those that have thousands of cows, have the highest output. China has seen a considerable improvement in the cattle industry. Technological innovation, government assistance, and both supply and demand for new animals all influenced trends.
| Country | China |
|---|---|
| CAGR (2025 to 2035) | 5.3% |
| Market Share (2025) | 9.5% |
| Market Value (2025) | USD 234.11 Million |
| Market Value (2035) | USD 392.0 Million |
Within only a few decades because of agricultural modernization, Chinese farms go from having low-yielding cattle to having high-yielding calves. Farmers and farm managers in the country devote attention to methodical regulated management. They focus on the potential improvements of the handling process along with the management or relevant metrics. Hence, opportunities for market participants abound in the Chinese cattle handling systems market.
Raising cattle for meat has become a significant part of Japanese agriculture ever since the 1960s. Cattle were referred to as an agricultural treasure in Japan. The Matsuzaka region in Mie is the most well-known beef-producing area in Japan. Cattle are currently the only domestic farm animals contributing to actual meat production.
| Country | Japan |
|---|---|
| Market Share (2025) | 4.8% |
| Market Value (2025) | USD 117.3 Million |
Every farmer constructs their own complex process to raise cows till they are the appropriate size and shape after giving them the proper care. As a consequence, businesses will probably discover that there are plenty of business chances in the Japanese cattle handling systems market.
The global market for cattle handling systems is segmented based on type, application, and region.
Steel is the best and safest material for a system for managing cattle. Due to the significant benefits it offers, farmers are favoring steel cattle handling more and more. Stainless steel offers the ideal blend of attributes. Since it can be readily cleaned with soap and water, it is sanitary, which means that no germs will grow on its surface.
It is also quite strong. Another benefit is the steel's adequate resistance against corrosion. It is more durable than wood, which is needed for the handling system. Furthermore, wood cannot compare to its ability to withstand heat and fire. Steel cattle handling systems are getting more and more popular since they are long-lasting and beneficial.
Although keeping cattle comfortable could be a never-ending effort, it is essential for the survival of the farm. When caring for their animals, cattle producers deal with several important challenges, including heat, water, and shelter. All of these issues are partially connected. Among other livestock, cattle are most at risk. Farmers need to ensure that cattle have access to shade and protection. Cattle will be more comfortable if a handling system in the pasture is combined with a steel shed.
With the aid of cattle handling equipment, farmers can modify their facilities to suit their demands. Each component of these systems is modular in design and has a distinct function. By rearranging the parts as needed, the farmer can select a configuration for every condition they could encounter.
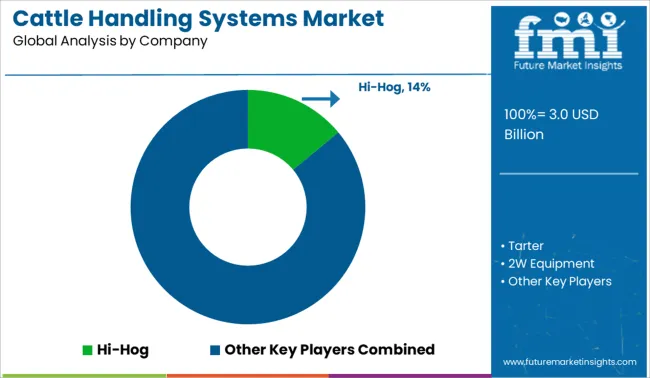
The market for cattle handling systems appears to be quite fragmented. A wide range of active producers demonstrates how fiercely competitive the industry is. Businesses in this industry are employing a range of techniques to survive the fierce competition. Along with developing new models, producers work to make the cattle handling systems they now offer on the market better.
Hi-Hog
Their cattle and horse equipment saw a sharp increase in demand. Hi-Hog chose to discontinue its line of hog panels and concentrate on cattle and horse equipment to guarantee that it could continue to provide top-notch goods and services. Hi-Hog extended its product line to include rodeo equipment, bison equipment, wellhead fence, bleacher seating, and more as a result of having larger production facilities.
Tarter Farm and Ranch
In 1945, Tarter Farm and Ranch was established as the Tarter Gate Company, and it started clearing land and harvesting wood to make wooden gates. Steel gates and other agricultural and ranch equipment were added to the company's product line. Tarter Gate Company became Tarter Farm and Ranch Equipment in 2008 as the company's product offering expanded.
IAE
IAE, which was founded in 1969, is currently a privately held company. IAE is now the top producer of livestock handling equipment in the United Kingdom with over 50 years of expertise. IAE has established an unmatched reputation for excellence. We can maintain our efficiency and competitiveness by consistently investing in the newest technologies.
D-S Livestock Equipment
Since 1982, the fully-owned company D-S Livestock Equipment has designed and sold top-notch livestock handling equipment. It sells cattle equipment both domestically and abroad. It focuses on offering quick service so that clients may acquire the necessary equipment as soon as feasible.
Zeitlow Distributing Company
In 1961, Zeitlow Distributing Company was established in a remote area of Kansas to meet the demand for high-quality livestock equipment on his farm and ranch. The first need for livestock equipment that a farmer/rancher saw gradually evolved into Leonard making "on-the-farm" sales calls to other farmers during the day while farming & ranching in the mornings, nights, and weekends. The Cattle, Swine, Equine, and Poultry Industries use a variety of items from Zeitlow Distributing Company.
The global cattle handling systems market is estimated to be valued at USD 3.0 billion in 2025.
The market size for the cattle handling systems market is projected to reach USD 5.7 billion by 2035.
The cattle handling systems market is expected to grow at a 6.6% CAGR between 2025 and 2035.
The key product types in cattle handling systems market are steel and wood.
In terms of application, cattle segment to command 58.3% share in the cattle handling systems market in 2025.


Our Research Products

The "Full Research Suite" delivers actionable market intel, deep dives on markets or technologies, so clients act faster, cut risk, and unlock growth.

The Leaderboard benchmarks and ranks top vendors, classifying them as Established Leaders, Leading Challengers, or Disruptors & Challengers.

Locates where complements amplify value and substitutes erode it, forecasting net impact by horizon

We deliver granular, decision-grade intel: market sizing, 5-year forecasts, pricing, adoption, usage, revenue, and operational KPIs—plus competitor tracking, regulation, and value chains—across 60 countries broadly.

Spot the shifts before they hit your P&L. We track inflection points, adoption curves, pricing moves, and ecosystem plays to show where demand is heading, why it is changing, and what to do next across high-growth markets and disruptive tech

Real-time reads of user behavior. We track shifting priorities, perceptions of today’s and next-gen services, and provider experience, then pace how fast tech moves from trial to adoption, blending buyer, consumer, and channel inputs with social signals (#WhySwitch, #UX).

Partner with our analyst team to build a custom report designed around your business priorities. From analysing market trends to assessing competitors or crafting bespoke datasets, we tailor insights to your needs.
Supplier Intelligence
Discovery & Profiling
Capacity & Footprint
Performance & Risk
Compliance & Governance
Commercial Readiness
Who Supplies Whom
Scorecards & Shortlists
Playbooks & Docs
Category Intelligence
Definition & Scope
Demand & Use Cases
Cost Drivers
Market Structure
Supply Chain Map
Trade & Policy
Operating Norms
Deliverables
Buyer Intelligence
Account Basics
Spend & Scope
Procurement Model
Vendor Requirements
Terms & Policies
Entry Strategy
Pain Points & Triggers
Outputs
Pricing Analysis
Benchmarks
Trends
Should-Cost
Indexation
Landed Cost
Commercial Terms
Deliverables
Brand Analysis
Positioning & Value Prop
Share & Presence
Customer Evidence
Go-to-Market
Digital & Reputation
Compliance & Trust
KPIs & Gaps
Outputs
Full Research Suite comprises of:
Market outlook & trends analysis
Interviews & case studies
Strategic recommendations
Vendor profiles & capabilities analysis
5-year forecasts
8 regions and 60+ country-level data splits
Market segment data splits
12 months of continuous data updates
DELIVERED AS:
PDF EXCEL ONLINE
BOP Handling Systems Market Growth - Trends & Forecast 2025 to 2035
Crate Handling Systems Market Size and Share Forecast Outlook 2025 to 2035
Sachet and Pouch Handling Systems Market
Automated Liquid Handling Systems Market
Automated Material Handling Systems Market - Market Outlook 2025 to 2035
Automated Microplate Handling Systems Market Size and Share Forecast Outlook 2025 to 2035
Cattle and Sheep Disease Diagnostic Kits Market Size and Share Forecast Outlook 2025 to 2035
Cattle Feed Market Analysis - Size, Share, and Forecast Outlook 2025 to 2035
Cattle Squeeze Market Size and Share Forecast Outlook 2025 to 2035
Cattle Feeder Panels Market Size and Share Forecast Outlook 2025 to 2035
Cattle Head Catch Market Size and Share Forecast Outlook 2025 to 2035
Cattle Grooming Chute Market Size and Share Forecast Outlook 2025 to 2035
Cattle Blower Market Size and Share Forecast Outlook 2025 to 2035
Cattle Mineral Feeder Market Size and Share Forecast Outlook 2025 to 2035
Cattle Feeder Market Size and Share Forecast Outlook 2025 to 2035
Cattle Management Software Market Size and Share Forecast Outlook 2025 to 2035
Systems Administration Management Tools Market Size and Share Forecast Outlook 2025 to 2035
Cattle Supplies Market Analysis & Forecast for 2025 to 2035
Cattle Nutrition Market Analysis by Cattle Type, Nutrition Type, Application, Life Stage Through 2025 to 2035
Air Handling Unit Market Size and Share Forecast Outlook 2025 to 2035

Thank you!
You will receive an email from our Business Development Manager. Please be sure to check your SPAM/JUNK folder too.
Chat With
MaRIA