The catering services market is estimated to be worth USD 674.1 million by 2025. It is anticipated to reach USD 1.04 billion by 2035, reflecting a CAGR of 4.5% over the assessment period 2025 to 2035.
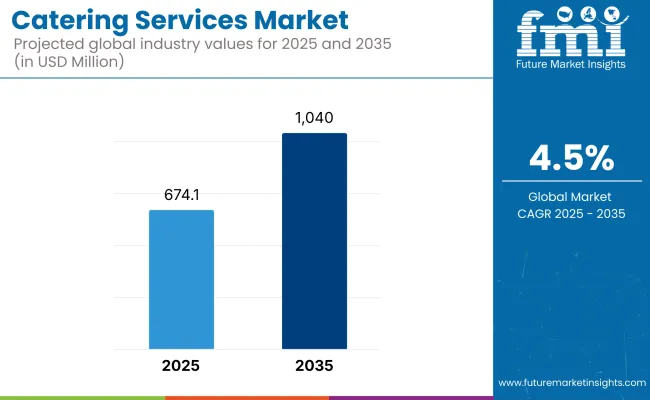
The industry is flourishing, where the increasing need for food service solutions in the corporate events, weddings, social gatherings, and institutional facilities, is a major factor propelling the demand.
They are the ones that provide personalized meal choices, professional food table arrangements, and full event management, which is the reason they are the most popular option among people and businesses seeking exquisite dining experiences. Moreover, the growing popularity of gourmet and specialty catering contributes significantly to the industry's expansion.
The growth in the catering sector is mainly due to the robust corporate sector, where the businesses often utilize the services of caterers for the meetings, employee lunch, and corporate events.
The increase in the hospitality and tourism sectors is also a factor in the demand in hotels, resorts, and cruising lines. Moreover, the headway of personal events such as social parties, destination weddings, and theme parties along with the need for exclusive catering are the backers of this trend.
The shift to healthier, organic, and customized menus is the primary trend setting force in the industry. Customers are turning to catering services that provide dietary-specific meals, such as gluten-free, vegan, and other allergen friendly choices.
The trend towards sustainable catering, with the utilization of locally sourced ingredients and the elimination of all harmful materials in food packaging, is also capturing the attention of the masses along with the associated environmental influences.
Emerging technologies in the areas of food preparation, delivery, and event management are, in addition to, the major drivers of the innovation of the catering industry.
The adoption of AI-based menu planning, online ordering platforms, and cloud kitchen management system is making the entire catering process faster and more customer-friendly. Furthermore, the growth of virtual and hybrid events has led to the demand for packaged and delivered tailored for remote gatherings and online meetings.
Among the challenges that the industry has to contend with, there exists a high operational cost, inconsistent food prices, and labor shortages in the hospitality sector. On top of that, the in-house food service providers along with meal delivery services are the competitors who can restrict the conventional catering businesses from developing.
Even so, the challenges only point out the vast opportunities that the industry can reach. More utilization of corporate catering services based on the subscription plan, meal-prep service for busy career folks, and eco-friendly event catering options will pave the way for the new avenues of growth.
Moreover, the popularity of digital marketing and social media promotion are the key ingredients that will help catering companies engage more customers and find new markets. The changes in customer choices and the industry will go hand in hand for quite some time.
The industry is witnessing continuous growth, fueled by growing corporate events, social events, and institutional food service requirements. Corporate catering continues to be a major source of revenue, with companies ordering customized, nutritious, and sustainable foods. Wedding and social event catering remains strong, focusing on luxury experience, thematic menus, and premium presentation.
Cost sensitivity is higher in this segment, with customers balancing cost against premium. Health care and institutional foodservice focus on healthy, diet-limited meal programs, particularly in hospitals, schools, and aged care. Following food safety standards is a vital aspect in this category.
Travel and airline catering post-pandemic are back on the upswing with an emphasis on pre-packed, high-quality, and multicultural food. Online food ordering sites and cloud kitchens also are revolutionizing the marketplace, with catering available just a click away and at lower costs.
In terms of the percentage difference in CAGR in half a year between the base year (2024) and current year (2025) in the industry, the following table provides a comparative output.
The analysis found the most significant performance changes and shows revenue realization trends, providing a better understanding of the trajectory stakeholders can expect for the year. H1 is January to June, the first half. H2: The second half, July through December
| Particular | Value CAGR |
|---|---|
| H1 | 3.6% (2024 to 2034) |
| H2 | 4.3% (2024 to 2034) |
| H1 | 4.1% (2025 to 2035) |
| H2 | 5.6% (2025 to 2035) |
The company will grow at a 4.1% CAGR during H1 2025 to 2035, and at a higher CAGR of 5.6% during the H2 2025 to 2035. Then moving on to the next phase, H1 2024 to H2 2034, the CAGR only gets larger, 3.6% for the first half and remains at a pretty high 4.3% for the second half. The industry growth for the H1 was positive at 12 BPS while for the H2 there was a decline to the tune of 8 BPS.
Between 2020 to 2024, paradigm shifts in the global catering industry were driven by changes in consumer behavior and evolving business needs. It was a year of high demand for adaptable and flexible catering models as businesses and social events transitioned to new business environments.
Corporate catering was still the dominant category, with more focus on employee motivation and in-workplace dining facilities being involved. Social and private event catering also rose as lockdown measures relaxed and demand for bespoke and experiential products grew.
Virtual and hybrid events also played their part in service development and meant that caterers now provide digital ordering technology and streamlined delivery systems. Competitive landscape was additionally fragmented as niche markets were leveraged by medium and small-sized caterers while conventional players diversified service portfolios in order to avert industry share erosion.
Growth between 2025 and 2035 of the industry will be defined by poly-angled and dynamic growth with new business models and service innovation redefining industry trajectories. The corporate application segment is likely to continue its industry dominance as businesses increasingly focus on workplace dining solutions as a way of driving employee satisfaction and productivity.
Changing consumer behavior towards unique experiences will propel heightened demand for thematic and interactive catering options across corporate and social spaces. Online channels are expected to become even more critical in terms of influencing customer interaction, as real-time customization, virtual event support, and integrated delivery are set to be the norm.
Comparative Market Shift Analysis (2020 to 2024 vs. 2025 to 2035)
| 2020 to 2024 | 2025 to 2035 |
|---|---|
| Increased demand for themed, diet-specific, and personalized catering. | Menu customization via AI driven by dietary needs and health information. |
| Increased use of eco-friendly packaging and local ingredients. | Carbon-zero catering with zero-waste practices and regenerative supply. |
| Cloud ordering, AI chatbots, and cloud-based kitchen management. | Robotic kitchens and AI-powered demand forecasting. |
| Post-pandemic cloud kitchen and hybrid catering business models expansion. | Food experience in the metaverse and fully virtual event dining. |
| Growing demand for organic, gluten-free, and plant-based food catering. | Nutritional and nutraceutical catering for personalized health benefits. |
| Implementation of kitchen automation and real-time inventory tracking. | Logistics optimization using AI to source ingredients and optimize delivery routes. |
| Pop-up restaurants, interactive food stalls, and chef experiences with live action. | Virtual dining experiences that utilize AR/VR presentations. |
The industry is flourishing due to the increasing popularity of event based dining and corporate meal solutions. Conversely, unstable food prices, mainly due to the effects of inflation and supply chain disruptions, stand as a major financial threat.
Therefore, catering service providers should implement the tactics of supply chain management, adaptable menu planning, and cost-control measures in order to achieve the set objectives.
Implementation of strictly maintained food safety and hygiene rules complicates compliance for the catering industry. Any minor neglects of the health and safety policies can result in adverse effects on their reputation and the companies may face punitive actions.
Training employees, enforcing strict quality control, and using innovative methods of cleaning are integral to the management of food safety and the compliance with regulations.
The consumer trend is currently shifting towards fresher options, organic foods, and dishes prepared using environmentally friendly ingredients. Therefore, conventional catering businesses can struggle to cope with the quick evolution of the industry.
To remain in operation and attract a diverse clientele, companies need to think creatively and provide flexible menus, vegan products, and eco-friendly packaging that ensure a safe environment.
Persistent unavailability of the labor force and high turnovers that come along with employee shortages cause inefficiencies in operations and impact service quality. The task of recruiting trained cooks and service staff while balancing labor costs is complicated.
One of the solutions to the gap is; carrying out the strategies for retaining their workforce, the provision of wages that are fair to all, and introducing automated solutions in all their business activities.
Recession and general industry apprehension can have an adverse impact on the spending decisions that corporates make with regard to catering and related facilities. Businesses can withstand the hardships and cut financial risks by such approaches as diversification of revenue streams, meal subscripts and aiming of concession eating for the remote workers.
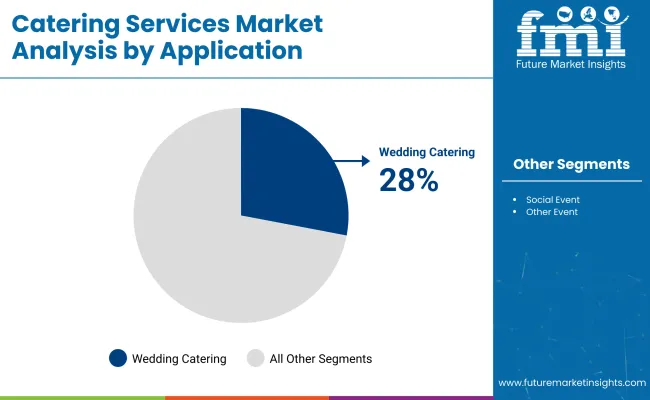
| Segment | Value Share (2025) |
|---|---|
| Wedding Catering | 28% |
Wedding catering is the most profitable type of service, and it is expected to have a value share of 28.0% in 2025 in the industry. It is increasingly common in developing economies such as India, China, and Brazil as demand for wedding catering services grows in line with the trend for large-scale customized celebrations.
Couples are looking for thematic menus, gourmet items, and tailored experiences, and that’s sending catering providers on a mission to broaden their services.
Event catering portfolios have been expanded by the likes of Sodexo, Compass Group, and regional players such as Taj SATS Air Catering in India to include high-end wedding services. The increasing number of destination weddings and luxury venue bookings further boosts this segment.
The Corporate catering segment is estimated to have approx. 25.0% in industry share (2025) and has been seeing strong demand driven by the renewal of in-person events, conferences, and daily office catering post-pandemic. With businesses back in hybrid work schedules, there is growing demand for it on a contract basis for meetings, employee meals, and client events.
Aramark and Elior Group are among the major companies that provide corporations across the globe with customized meal solutions. For example, Aramark’s attention to healthy, sustainable menus ties into corporate wellness programs, which have expanded its client reach in North America and Europe.
From the app-based ordering of a meal to customizing it in real-time, tech integrated with hospitality is helping increase customer engagement. Wedding catering offers its advantages through peaks in seasonality and high per-event revenue; however, corporate catering provides continuous, repeating income. These two segments are set to thrive on the back of consumer preference for convenience, quality, and personalized service experiences.
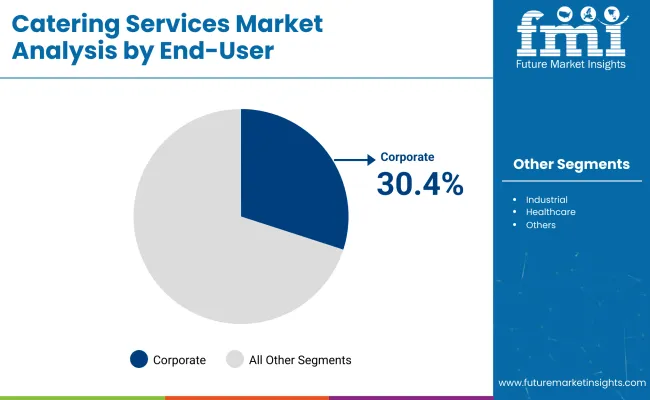
| Segment | Value Share (2025) |
|---|---|
| Corporate (End User) | 30.4% |
In 2025, the corporate segment dominates the industry with an estimated value share of 30.4%. This comes on the back of a renewed driver of office operations, in-person meetings and corporate events globally shifting back to hybrid work models.
Companies have made growing investments in employee wellness and engagement, leading to a greater demand for high-quality on-site meals as well as daily and event-based corporate catering.
Sodexo, Aramark, and Compass Group lead this segment with customized offerings such as healthier menus, sustainable sourcing, and tech-enabled ordering systems. For example, Sodexo’s B2B meal programs in North America and Europe are centered on customized nutrition and flexibility to support corporate wellness strategies.
The educational institutions segment accounts for 18.0% of the dollar value share of the industry in 2025, driven by schools, colleges, and universities in search of reliable and nutritionist meal services for students as well as staff. This increased awareness about food and health for students is resulting in more institutions entering partnerships with professional caterers to create balanced meal programs that are cost-effective.
Elior Group and Chartwells (part of Compass Group) are among the companies at the top of their game, offering tailored meal programs to educational customers around the world. Chartwells aims to provide allergen-free and sustainably sourced meals to USA universities, helping to improve student satisfaction and retention.
Both segments involve increasing the use of technology to streamline operations - contactless ordering, instant feedback, and more. Corporate catering provides high volume and consistent revenue streams, while educational catering benefits from long-term contracts and consistent demand; both segments are some growth areas in the industry.
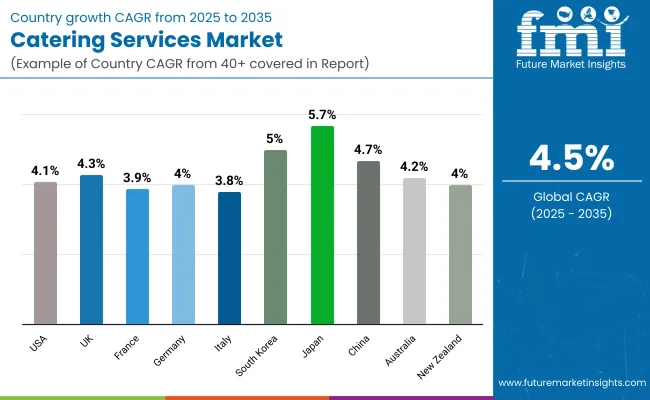
| Countries | CAGR (2025 to 2035) |
|---|---|
| USA | 4.1% |
| UK | 4.3% |
| France | 3.9% |
| Germany | 4% |
| Italy | 3.8% |
| South Korea | 5% |
| Japan | 5.7% |
| China | 4.7% |
| Australia | 4.2% |
| New Zealand | 4% |
The USA industry will keep on expanding gradually with investment in corporate catering, increased demand for value-added meal service, and greater use of technology in food service.
Aramark and Sodexo are adopting digital ordering systems, menu personalization with the aid of AI, and automation to simplify mass-scale catering services. The increasing need for virtual catering solutions, especially with the move to remote work, has beckoned investment in hybrid catering solutions.
Its growing industry for corporate clients' customized meal subscription services also offers the potential for top-line growth. Moreover, green and healthy catering is growing with growing demand, and suppliers highlight organic and local foods to address changing palates among consumers.
The UK industry is seeing spectacular growth due to the construction of humongous culinary hubs and sci-fi dining enclaves. Multi-purpose food catering unit development in London and Manchester allows businesses to combine food preparation, storage, and delivery capabilities to serve business and event customers efficiently. Pop-up and mobile food concepts are now hip, particularly when there are events and festivals and events in private areas.
As customers pay closer attention to plant-based and sustainable food, caterers are expanding their menus with more sustainable meals. Corporate customers also need more specialist catering solutions, which inspires joint ventures among catering firms and hospitality operators.
Upmarket gastronomic dining is reshaping the operations of catering businesses in France, supplemented by rising demand for gourmet-level dining experiences to be enjoyed at corporate gatherings as well as social gatherings.
The trend towards premiumization triggered by Michelin-starred chefs hosting event catering involves businesses spending more on ingredient quality and carefully designed menu experiences.
The corporate catering industry is witnessing increased demand for healthier, tailor-made meal programs, leading to caterers implementing AI-driven menu planning software. Apart from this, the growth of cloud kitchens and ordering portals is changing the industry situation, enabling companies to increase their catering business efficiently without massive physical establishment.
The robust corporate culture of the nation and the growing demand for high-efficiency support Germany's industry. The increase in canteens in corporate centers, together with the expanding use of robot-based kitchen automation, is also streamlining the preparation of meals in bulk.
Additionally, companies are increasingly using environmentally friendly strategies like zero-waste catering and carbon-free meals. Electronic ordering and artificial intelligence-enabled supply chain management are also on the rise, allowing them to cater to corporate clients with no wastefulness and to the environment as well.
Italy's catering industry is growing steadily, with both corporate and event catering seeing demand growth. Increased popularity for experiential food at business functions and private parties is causing caterers to innovate by trying new local and artisan food.
Spending on outdoor and mobile catering is on the rise, particularly in tourist areas, where demand for high-quality, locally inspired catering continues to be strong. The industry is also seeing the emergence of tech-enabled catering solutions, wherein customers can make meal plans and event menu changes online. As Italian corporations emphasize going green, organic and farm-to-table catering is becoming a top trend.
The South Korean industry is growing steadily with a vibrant corporate dining culture and increasing global popularity for K-food in the catering business. Major companies are investing in innovative catering solutions such as meal personalization using AI and robotics-assisted food preparation.
Increasing consumer needs for healthy and functional foods in the catering sector are driving businesses to innovate plant-based and superfood-enhanced meal solutions. Furthermore, the introduction of smart vending systems and automated food dispensing machines in corporate environments is transforming the catering sector by promoting efficiency, as well as customization, in terms of service.
Japan's catering industry sector will expand exponentially, with a significant focus on precision, efficiency, and quality food content. The nation's sophisticated food technology sector leads the way in implementing AI-based meal planning and robotized catering systems.
Additionally, the increasing corporate orders for bento-fared company lunches and personalized dining experiences also keep influencing companies to invest in high-end, customized catering complexes.
Increased use of robotics in food preparation is also expanding operations, lowering costs, and enhancing the speed of service. Green catering demand, such as plant-based and low-waste meal options, is also driving industry expansion.
China's industry is growing rapidly, driven by rapid urbanization, increased disposable incomes, and corporate and large-event catering. Cloud kitchens and central food units are helping catering companies increase business without impacting quality.
Menu optimization using artificial intelligence and online payment solutions is improving customer experience and enhancing the availability and efficiency of them. In addition, corporate function and social event catering demand is on the rise, driving investment in high-end and international cuisine options.
The Australian industry is growing, notably in corporate dining and outdoor food event spaces. Consumers are turning more towards healthy, organic, and sustainable eating options, which is exerting pressure on the innovation of them. Building technology-based platforms for catering services is streamlining order management and meal customization, making the process of service less complicated.
With event catering becoming an industry, mobile and pop-up catering are in vogue, and scalable and adaptable services that corporate and private clients can access are available. To this, collaboration with organic food producers and neighborhood farms is driving the nation's growing demand for green catering services.
The catering service sector in New Zealand is changing, with a growing demand for sustainable and tailored catering solutions. The corporate sector is leading the investment in meal subscription plans and artificial intelligence-based catering management platforms. Focusing on locally sourced and organic food, catering businesses are turning their attention to farm-to-table concepts driven by customer demand.
The shift towards remote and hybrid offices is also changing corporate catering requirements. Thus, easy-to-consume and delivery-focused meal options are gaining traction. As the industry grows, technology and sustainability-driven methods will keep defining the future of the industry.
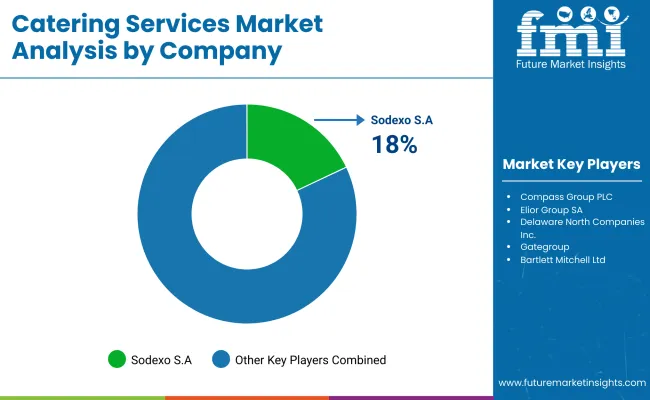
The marketplace is rapidly transforming, propelled by the emergence of new consumer behaviors, trends in corporate hospitality, and advances in food service logistics.
The industry remains monopolized by a few industry heavyweights like Sodexo, Compass Group, Elior Group, and Delaware North by taking advantage of the economies of scale offered through diversified service lines and contracts operated across corporate, healthcare, educational, and event catering segments.
Such firms have centralized kitchen operations that run on technology for menu planning and sustainability initiatives to boost efficiency and ingratiate themselves with the competition.
Innovation in menu personalization, dietary inclusion, and technology integration are becoming the new industry differentiators. Along with this, the demand for healthy, plant-based, and allergen-conscious meal options is growing, and the suppliers are rightly investing in nutrition-based menus alongside farm-to-table sourcing.
Besides this, the other competitive parameters that shall be indispensable include automation in food preparation, AI-led demand forecasting, and digital ordering platforms that enable firms to optimize food production, minimize wastage, and uplift customer experience.
On the other hand, small niche players, by providing bespoke offerings like luxury event catering, gourmet meal preparation, and cloud kitchens, are disrupting catering markets to meet new consumer demands for convenience, quality, and sustainability.
Regulatory compliance with food safety and hygiene standards and sustainability reporting have made the operational model more favorable, forcing companies to ensure traceable sourcing, waste reduction practices, and eco-friendly packaging.
The Outlook for corporate contracts, private events, and institutional dining looks good, and catering firms that focus on operational efficiency, digitalization, and sustainability-driven innovation stand poised to win industry share and drive longer-term growth.
Market Share Analysis by Company
| Company Name | Estimated Market Share (%) |
|---|---|
| Sodexo S.A. | 18-22% |
| Compass Group PLC | 16-20% |
| Elior Group SA | 10-14% |
| Delaware North Companies Inc. | 8-12% |
| Gategroup | 6-10% |
| Other Companies (Combined) | 25-35% |
| Company Name | Key Offerings & Market Focus |
|---|---|
| Sodexo S.A. | A global leader in contract catering specializing in corporate, healthcare, as well as education food services, with strong digital innovation in meal planning. |
| Compass Group PLC | A major provider of corporate and institutional catering, focusing on sustainability, AI-driven food services, and nutrition-based meal solutions. |
| Elior Group SA | European catering leader offering customized food solutions with an emphasis on premium quality as well as dietary-specific menus. |
| Delaware North Companies Inc. | It specializes in catering for sports venues, entertainment centers, and hospitality businesses, with a focus on large-scale event food management. |
| Gategroup | Leading airline catering provider, serving international airlines with in-flight meal solutions and premium aviation catering services. |
Key Company Insights
Sodexo S.A. (18-22%)
Sodexo exercises a commanding stature in contract catering, directing its forward thrusts toward food-service technologies, personalized nutrition, and waste management.
Compass Group PLC (16-20%)
Compass Group is comparably strong in institutional and corporate catering, integrating AI meal customization with plant-based food trends into its service offerings.
Elior Group S.A. (10-14%)
In Europe, Elior Group remains a fierce contender, specializing in servicing high-quality restaurants that are environmentally viable and nutritionally aware.
Delaware North Companies Inc. (8-12%)
Delaware North is a frontrunner in catering at entertainment, hospitality, and sports venues, with a keen focus on guest experience in managing high-traffic food operations.
Gategroup (6-10%)
Gategroup is a dominant player within the aviation catering industry, providing cutting-edge in-flight meal solutions and extending global airline partnerships.
Other Key Players
By service type, the industry is segmented into contractual, non-contractual, and others.
By application, the industry is segmented into wedding, corporate, social events, and other events.
By end user, the industry is segmented into industrial, hospitality, educational, healthcare, in-flight sector, and others.
By region, the industry is analyzed across North America, Latin America, Western Europe, Eastern Europe, East Asia, South Asia & Pacific, Central Asia, Russia and Belarus, Balkan & Baltic Countries, and the Middle East & Africa.
The industry is expected to reach USD 674.1 million in 2025.
The industry is projected to grow to USD 1.04 billion by 2035.
Key companies include Sodexo S.A, Compass Group PLC, Bartlett Mitchell Ltd., CH and Co Catering Group Ltd., Delaware North Companies Inc., Newrest Group Services SAS, Deutsche Lufthansa AG, Dine Contract Catering Ltd., Gategroup, and Elior Group SA.
Japan, with a projected CAGR of 5.7% during the forecast period, is expected to witness the fastest growth.
The wedding catering segment is among the most widely used in the industry.


Our Research Products

The "Full Research Suite" delivers actionable market intel, deep dives on markets or technologies, so clients act faster, cut risk, and unlock growth.

The Leaderboard benchmarks and ranks top vendors, classifying them as Established Leaders, Leading Challengers, or Disruptors & Challengers.

Locates where complements amplify value and substitutes erode it, forecasting net impact by horizon

We deliver granular, decision-grade intel: market sizing, 5-year forecasts, pricing, adoption, usage, revenue, and operational KPIs—plus competitor tracking, regulation, and value chains—across 60 countries broadly.

Spot the shifts before they hit your P&L. We track inflection points, adoption curves, pricing moves, and ecosystem plays to show where demand is heading, why it is changing, and what to do next across high-growth markets and disruptive tech

Real-time reads of user behavior. We track shifting priorities, perceptions of today’s and next-gen services, and provider experience, then pace how fast tech moves from trial to adoption, blending buyer, consumer, and channel inputs with social signals (#WhySwitch, #UX).

Partner with our analyst team to build a custom report designed around your business priorities. From analysing market trends to assessing competitors or crafting bespoke datasets, we tailor insights to your needs.
Supplier Intelligence
Discovery & Profiling
Capacity & Footprint
Performance & Risk
Compliance & Governance
Commercial Readiness
Who Supplies Whom
Scorecards & Shortlists
Playbooks & Docs
Category Intelligence
Definition & Scope
Demand & Use Cases
Cost Drivers
Market Structure
Supply Chain Map
Trade & Policy
Operating Norms
Deliverables
Buyer Intelligence
Account Basics
Spend & Scope
Procurement Model
Vendor Requirements
Terms & Policies
Entry Strategy
Pain Points & Triggers
Outputs
Pricing Analysis
Benchmarks
Trends
Should-Cost
Indexation
Landed Cost
Commercial Terms
Deliverables
Brand Analysis
Positioning & Value Prop
Share & Presence
Customer Evidence
Go-to-Market
Digital & Reputation
Compliance & Trust
KPIs & Gaps
Outputs
Full Research Suite comprises of:
Market outlook & trends analysis
Interviews & case studies
Strategic recommendations
Vendor profiles & capabilities analysis
5-year forecasts
8 regions and 60+ country-level data splits
Market segment data splits
12 months of continuous data updates
DELIVERED AS:
PDF EXCEL ONLINE
Catering Management Market Size and Share Forecast Outlook 2025 to 2035
Catering Food Warmers Market Analysis by Product Type, End Use, Sales Channel, and Region Forecast Through 2035
Online Catering Marketplace Size and Share Forecast Outlook 2025 to 2035
Commercial Catering Equipment Market Size and Share Forecast Outlook 2025 to 2035
M2M Services Market Size and Share Forecast Outlook 2025 to 2035
B2B Services Review Platforms Market Size and Share Forecast Outlook 2025 to 2035
Bot Services Market Size and Share Forecast Outlook 2025 to 2035
Spa Services Market Size and Share Forecast Outlook 2025 to 2035
Microservices Orchestration Market Growth - Trends & Forecast 2025 to 2035
VOIP Services Market Analysis - Trends, Growth & Forecast through 2034
Global AI HR Services Market Size and Share Forecast Outlook 2025 to 2035
Legal Services Market Size and Share Forecast Outlook 2025 to 2035
Oracle Services Market Analysis – Trends & Forecast 2024-2034
Seismic Services Market Size and Share Forecast Outlook 2025 to 2035
AR Tour Services Market Analysis - Size and Share Forecast Outlook 2025 to 2035
Tableau Services Market Size and Share Forecast Outlook 2025 to 2035
Managed Services Market Analysis - Size, Share, and Forecast Outlook 2025 to 2035
Walk-in Services Market Growth – Trends & Forecast 2024-2034
The AI Legal Services Market Analysis - Size and Share Forecast Outlook 2025 to 2035
Podiatry Services Market Analysis - Size, Share, and Forecast Outlook 2025 to 2035

Thank you!
You will receive an email from our Business Development Manager. Please be sure to check your SPAM/JUNK folder too.
Chat With
MaRIA