The Carpet and Rug Market is estimated to be valued at USD 99.3 billion in 2025 and is projected to reach USD 181.2 billion by 2035, registering a compound annual growth rate (CAGR) of 6.1% over the forecast period.
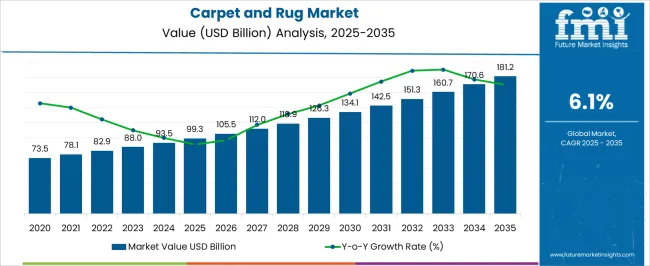
| Metric | Value |
|---|---|
| Carpet and Rug Market Estimated Value in (2025 E) | USD 99.3 billion |
| Carpet and Rug Market Forecast Value in (2035 F) | USD 181.2 billion |
| Forecast CAGR (2025 to 2035) | 6.1% |
The carpet and rug market is experiencing stable expansion, supported by growing demand in both residential and commercial construction. Increasing urbanization, rising disposable incomes, and the emphasis on interior aesthetics are driving product adoption globally. The current scenario is characterized by strong demand for cost-effective, durable, and customizable flooring solutions, with tufted products dominating due to their versatility and production efficiency.
Material innovations such as stain-resistant fibers and eco-friendly alternatives have further enhanced consumer preference. Market players are focusing on advanced manufacturing technologies, sustainable sourcing, and product differentiation to capture emerging opportunities.
Looking forward, the market is expected to benefit from infrastructure development, rising renovation activities, and the growing adoption of carpets in premium housing projects. With strong penetration in residential use and expanding application in hospitality and office spaces, the carpet and rug market is positioned for consistent growth in the coming years.
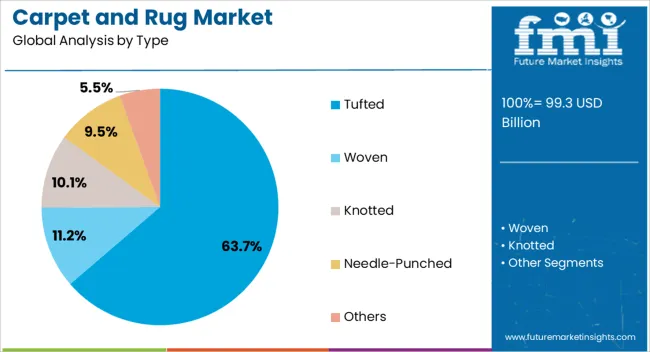
The tufted segment dominates the type category, holding approximately 63.7% share of the carpet and rug market. This segment’s growth is supported by its cost efficiency, rapid production capability, and adaptability to a wide variety of design patterns.
Tufted carpets provide durability and comfort, making them suitable for both residential and commercial applications. The availability of tufted products in a range of styles, colors, and textures has reinforced their demand among consumers seeking affordable yet aesthetically pleasing options.
Manufacturers have invested in automated tufting technologies to enhance precision and production scalability, ensuring consistent quality. With their widespread acceptance in developed and emerging markets alike, tufted carpets are expected to remain the dominant product category throughout the forecast period.
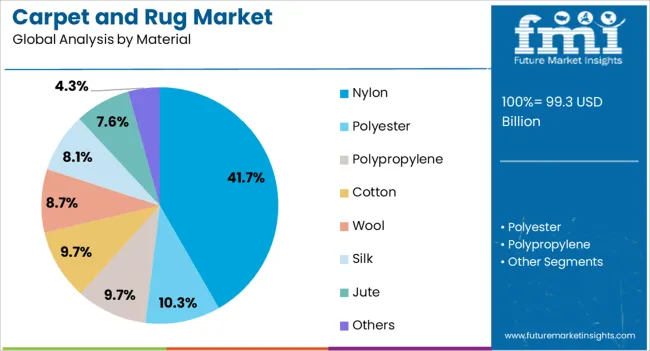
The nylon segment leads the material category, accounting for approximately 41.7% share. Nylon carpets are recognized for their resilience, stain resistance, and long lifespan, making them popular in both high-traffic residential and commercial spaces.
The segment benefits from continuous technological advancements in fiber engineering, resulting in improved softness and eco-friendly formulations. Nylon’s recyclability and its compatibility with dyeing processes allow for a wide array of designs, strengthening its market presence.
Cost-effectiveness, coupled with performance advantages, positions nylon as a preferred choice in global markets. With ongoing innovation in sustainable nylon production and the growing demand for durable flooring solutions, this material segment is expected to maintain its leadership in the coming years.
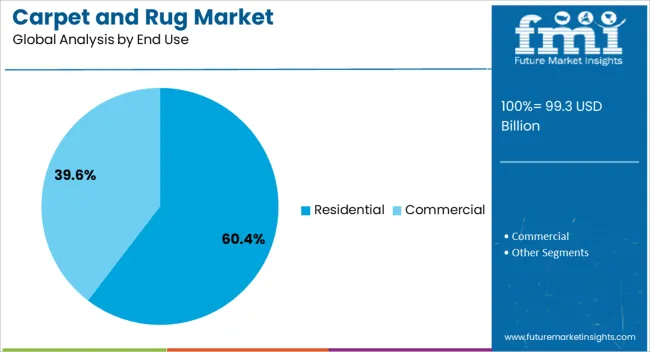
The residential segment holds approximately 60.4% share in the end-use category, underscoring its central role in driving market demand. Homeowners increasingly opt for carpets and rugs to enhance interior comfort, insulation, and aesthetics.
Rising urban housing projects and home renovation trends have strengthened this segment’s performance. The availability of a wide range of styles and price points caters to diverse consumer preferences, boosting penetration in both premium and budget housing.
Tufted and nylon-based products are particularly favored in residential applications due to their durability and ease of maintenance. With sustained demand from the housing sector and ongoing focus on lifestyle-driven interiors, the residential segment is projected to retain its strong dominance in the global carpet and rug market.
From 2020 to 2025, the carpet and rug industry experienced a CAGR of 7.9% in market value. The growth of the carpet and rug market is fueled by the ongoing trends of urbanization and robust housing construction. Consumers' preferences are notably inclined towards affordable yet aesthetically pleasing flooring options.
The heightened awareness of environmental concerns has catalyzed a surge in demand for sustainable carpet and rug materials. In response, manufacturers are actively integrating recycled and eco-friendly materials into their product offerings, effectively aligning their strategies with the prevailing trends in the carpet and rug market.
Increasingly, consumers seek carpets and rugs that can be customized to suit their preferences. The industry has responded with a variety of customization options, allowing consumers to choose colors, patterns, and sizes according to their tastes. Projections indicate that the global carpet and rug market is expected to experience a CAGR of 6.2% from 2025 to 2035.
| Historical CAGR from 2020 to 2025 | 7.9% |
|---|---|
| Forecast CAGR from 2025 to 2035 | 6.2% |
The following table shows the top five countries by revenue, led by Japan and South Korea. The growth of e-commerce and online retail platforms provides Japanese consumers with convenient access to a variety of carpet and rug options.
The ease of online shopping contributes to market accessibility and may influence consumer purchasing behavior in Japan. Ongoing real estate and construction projects, both residential and commercial, contribute to the demand for flooring solutions in South Korea.
| Countries | Forecast CAGRs from 2025 to 2035 |
|---|---|
| United States | 6.5% |
| United Kingdom | 7.3% |
| China | 6.9% |
| Japan | 7.7% |
| South Korea | 8.0% |
The carpet and rug market in the United States is expected to grow with a CAGR of 6.5% from 2025 to 2035. The carpets and rug market in the United States is growing owing to the robust housing sector and a pronounced shift toward home renovations and remodeling. This surge in home improvement projects reflects a growing inclination among homeowners to enhance their living spaces.
As individuals invest in upgrading their residences, the market witnesses an upswing, driven by the desire for innovative and aesthetically pleasing carpet and rug solutions.
Changing design trends and a focus on interior aesthetics influence consumer choices in flooring. The desire for stylish and customizable flooring options has driven interest in a variety of carpet and rug designs.
The carpet and rug market in the United Kingdom is expected to grow with a CAGR of 7.3% from 2025 to 2035. The performance of the housing market in the United Kingdom plays a significant role in the demand for carpets and rugs.
Growth in new home constructions, home renovations, and real estate trends can influence the market positively. Changing consumer preferences and evolving interior design trends contribute to the demand for carpets and rugs.
The carpet and rug market in China is expected to grow with a CAGR of 6.9% from 2025 to 2035. China's growing middle class has led to increased consumer spending on home furnishings, including carpets and rugs. As more people seek to enhance the aesthetics and comfort of their homes, the demand for quality flooring solutions has risen.
Ongoing urbanization in China has led to increased construction activities, both in the residential and commercial sectors. The demand for carpets and rugs has grown alongside the development of new buildings and spaces, contributing to market expansion.
Evolving lifestyles and changing consumer preferences have influenced the demand for interior design and home decor. Carpets and rugs are seen as essential elements in creating aesthetically pleasing and comfortable living spaces.
The carpet and rug market in Japan is expected to grow with a CAGR of 7.7% from 2025 to 2035. Japan has experienced various housing trends, including renovations and new constructions, which impact the demand for carpets and rugs. As homeowners seek to personalize and enhance their living spaces, the market for flooring solutions sees growth.
Changes in lifestyle and a growing emphasis on home aesthetics have led to increased interest in interior design and home decor. Carpets and rugs are considered essential elements in creating comfortable and visually appealing living spaces.
The carpet and rug industry has seen innovations in design, materials, and manufacturing processes. Products that offer unique designs, patterns, and sustainable materials may attract Japanese consumers seeking modern and environmentally friendly options.
The carpet and rug market in Korea is expected to grow with a CAGR of 8.0% from 2025 to 2035. The growth of the market in the country is mainly attributed to urbanization and the development of new residential and commercial spaces. As urban areas expand and housing construction projects increase, there may be a corresponding growth in the carpet and rug market.
Evolving lifestyles and changing design preferences influence the demand for interior decor, including carpets and rugs. As consumers seek to create comfortable and aesthetically pleasing living spaces, the demand for stylish and functional carpets and rugs remains high.
The below section shows the leading segment. The woven segment accounts for a CAGR of 6.0% from 2025 to 2035. Based on material, the nylon segment is anticipated to hold a dominant share through 2035. It is set to exhibit a CAGR of 5.8% from 2025 to 2035.
| Category | CAGR from 2025 to 2035 |
|---|---|
| Woven | 6.0% |
| Nylon | 5.8% |
Based on product type, the woven segment is anticipated to account for a CAGR of 6.0% from 2025 to 2035. Woven carpets offer a wide range of designs and patterns, from traditional and classic motifs to modern and contemporary styles. This versatility allows consumers to find a woven carpet that complements their overall interior design aesthetic and personal preferences.
Woven carpets can be customized with specific patterns, colors, and designs to meet individual preferences. This customization option allows consumers to create a unique and personalized look for their homes, contributing to the growing popularity of woven-type carpets.
Consumers are increasingly willing to invest in quality home furnishings that offer long-term value. Woven carpets, known for their durability and aesthetic appeal, are viewed as an investment in the overall ambiance and value of a home.
Based on material, the nylon segment is anticipated to advance at a CAGR of 5.8% from 2025 to 2035. Nylon is renowned for its outstanding durability and resilience, making it a highly sought-after material known for its ability to withstand wear and maintain structural integrity over time. It can withstand heavy foot traffic, making it suitable for high-traffic areas in residential and commercial spaces.
The durability of nylon carpets contributes to their long lifespan and the ability to maintain their appearance over time.
Nylon fibers often have a natural resistance to stains, and manufacturers can enhance this feature further through treatments and coatings. Stain-resistant nylon carpets are easier to clean and maintain, making them a practical choice for households with children, and pets, or in areas prone to spills.
Nylon fibers are resilient and elastic, allowing them to bounce back to their original shape even after being subjected to pressure. This resilience contributes to the carpet's ability to recover from compression caused by furniture or foot traffic.
Nylon carpets can be manufactured to have a soft and comfortable feel underfoot. This makes them a popular choice for bedrooms and other areas where comfort is a priority.
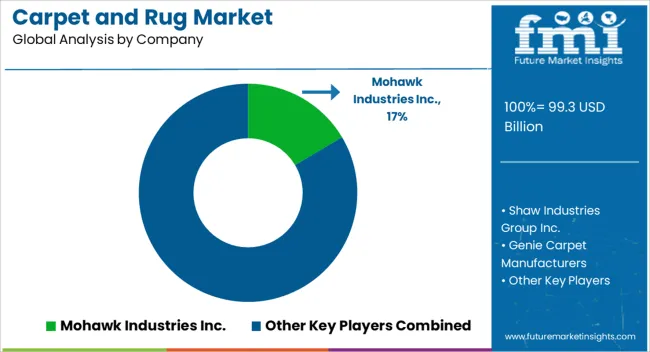
Prominent players in the carpet and rug market are significantly investing in research and development endeavors to diversify their product portfolios, contributing to the continued expansion of the market.
These industry leaders are adopting various strategic measures to enhance their global presence, such as introducing new products, entering into contractual agreements, pursuing mergers and acquisitions, increasing financial investments, and fostering collaborations with other organizations.
| Attributes | Details |
|---|---|
| Estimated Market Size in 2025 | USD 99.3 billion |
| Projected Market Valuation in 2035 | USD 181.2 billion |
| Value-based CAGR 2025 to 2035 | 6.1% |
| Forecast Period | 2025 to 2035 |
| Historical Data Available for | 2020 to 2025 |
| Market Analysis | Value in USD billion |
| Key Regions Covered | North America; Latin America; Western Europe; Eastern Europe; South Asia and Pacific; East Asia; Middle East and Africa |
| Key Market Segments Covered | Product Type, Material, End-use, Region |
| Key Countries Profiled | The United States, Canada, Brazil, Mexico, Germany, The United Kingdom, France, Spain, Italy, Russia, Poland, Czech Republic, Romania, India, Bangladesh, Australia, New Zealand, China, Japan, South Korea, GCC countries, South Africa, Israel |
| Key Companies Profiled | Mohawk Industries Inc.; Shaw Industries Group Inc.; Genie Carpet Manufacturers; Beaulieu International Group; Lowe's; Taekett; Interface, Inc.; Dixie Group Inc.; Tai Ping; Victoria PLC |
The global carpet and rug market is estimated to be valued at USD 99.3 billion in 2025.
The market size for the carpet and rug market is projected to reach USD 181.2 billion by 2035.
The carpet and rug market is expected to grow at a 6.1% CAGR between 2025 and 2035.
The key product types in carpet and rug market are tufted, woven, knotted, needle-punched and others.
In terms of material, nylon segment to command 41.7% share in the carpet and rug market in 2025.


Our Research Products

The "Full Research Suite" delivers actionable market intel, deep dives on markets or technologies, so clients act faster, cut risk, and unlock growth.

The Leaderboard benchmarks and ranks top vendors, classifying them as Established Leaders, Leading Challengers, or Disruptors & Challengers.

Locates where complements amplify value and substitutes erode it, forecasting net impact by horizon

We deliver granular, decision-grade intel: market sizing, 5-year forecasts, pricing, adoption, usage, revenue, and operational KPIs—plus competitor tracking, regulation, and value chains—across 60 countries broadly.

Spot the shifts before they hit your P&L. We track inflection points, adoption curves, pricing moves, and ecosystem plays to show where demand is heading, why it is changing, and what to do next across high-growth markets and disruptive tech

Real-time reads of user behavior. We track shifting priorities, perceptions of today’s and next-gen services, and provider experience, then pace how fast tech moves from trial to adoption, blending buyer, consumer, and channel inputs with social signals (#WhySwitch, #UX).

Partner with our analyst team to build a custom report designed around your business priorities. From analysing market trends to assessing competitors or crafting bespoke datasets, we tailor insights to your needs.
Supplier Intelligence
Discovery & Profiling
Capacity & Footprint
Performance & Risk
Compliance & Governance
Commercial Readiness
Who Supplies Whom
Scorecards & Shortlists
Playbooks & Docs
Category Intelligence
Definition & Scope
Demand & Use Cases
Cost Drivers
Market Structure
Supply Chain Map
Trade & Policy
Operating Norms
Deliverables
Buyer Intelligence
Account Basics
Spend & Scope
Procurement Model
Vendor Requirements
Terms & Policies
Entry Strategy
Pain Points & Triggers
Outputs
Pricing Analysis
Benchmarks
Trends
Should-Cost
Indexation
Landed Cost
Commercial Terms
Deliverables
Brand Analysis
Positioning & Value Prop
Share & Presence
Customer Evidence
Go-to-Market
Digital & Reputation
Compliance & Trust
KPIs & Gaps
Outputs
Full Research Suite comprises of:
Market outlook & trends analysis
Interviews & case studies
Strategic recommendations
Vendor profiles & capabilities analysis
5-year forecasts
8 regions and 60+ country-level data splits
Market segment data splits
12 months of continuous data updates
DELIVERED AS:
PDF EXCEL ONLINE
Carpet and Rug Shampoo Market Analysis – Trends, Growth & Forecast 2025-2035
Carpet Spot Remover Market Size and Share Forecast Outlook 2025 to 2035
The Carpet & Upholstery Cleaning Services Market is segmented by service type and application from 2025 to 2035.
Carpet Extraction Cleaner Market Analysis- Trends, Growth & Forecast 2025 to 2035
Residential Carpet Roll Market Size and Share Forecast Outlook 2025 to 2035
Flooring and Carpets Market - Trends, Growth & Forecast 2025 to 2035
Middle East Flooring and Carpet Industry Analysis Size and Share Forecast Outlook 2025 to 2035
Android Automotive OS (AAOS) Market Size and Share Forecast Outlook 2025 to 2035
Anderson Cascade Impactor Market Size and Share Forecast Outlook 2025 to 2035
Andersen-Tawil Syndrome Treatment Market Trends - Growth & Future Prospects 2025 to 2035
Andro Supplements Market
Candle Filter Cartridges Market Size and Share Forecast Outlook 2025 to 2035
Handheld Electrostatic Meter Market Size and Share Forecast Outlook 2025 to 2035
Hand Towel Automatic Folding Machine Market Size and Share Forecast Outlook 2025 to 2035
Handheld Ultrasound Scanner Market Size and Share Forecast Outlook 2025 to 2035
Handheld Tagging Gun Market Forecast and Outlook 2025 to 2035
Handheld Imaging Systems Market Size and Share Forecast Outlook 2025 to 2035
Sandwich Panel System Market Size and Share Forecast Outlook 2025 to 2035
Hand Tools Market Size and Share Forecast Outlook 2025 to 2035
Land Survey Equipment Market Size and Share Forecast Outlook 2025 to 2035

Thank you!
You will receive an email from our Business Development Manager. Please be sure to check your SPAM/JUNK folder too.
Chat With
MaRIA