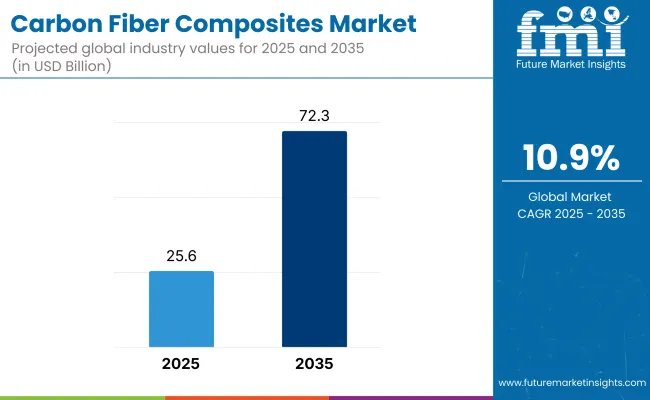
The carbon fiber composites market is valued at USD 25.6 billion in 2025 and is forecast to reach USD 72.3 billion by 2035, growing at a strong CAGR of 10.9% during the assessment period. The United States remains the most lucrative market, driven by long-standing aerospace programs and EV innovation. Meanwhile, China is expected to be the fastest-growing market between 2025 and 2035, supported by a boom in wind energy, automotive light-weighting, and domestic aircraft production.
Growth in the market is driven by surging demand for lightweight, corrosion-resistant, and high-performance materials across aerospace, automotive, wind energy, and industrial sectors. Aerospace and defense dominate carbon fiber usage due to their structural performance benefits and regulatory pressure to reduce emissions via fuel efficiency.
Meanwhile, automotive OEMs are increasingly using carbon fiber composites in high-performance EVs and body structures to reduce weight. The market is also benefiting from increased deployment of carbon fiber turbine blades in onshore and offshore wind projects. However, high production costs, energy-intensive manufacturing, and limited recycling infrastructure continue to challenge widespread adoption, particularly in price-sensitive applications.
Between 2025 and 2035, the market is expected to transition toward mass-scale application of carbon fiber composites in mainstream mobility, infrastructure, and energy systems. As resin matrix technology advances and process automation reduces unit costs, demand will rise across new sectors such as hydrogen storage, rail transport, sporting goods, and construction. Suppliers will focus on supply chain localization, waste reduction, and hybrid material development to remain competitive.
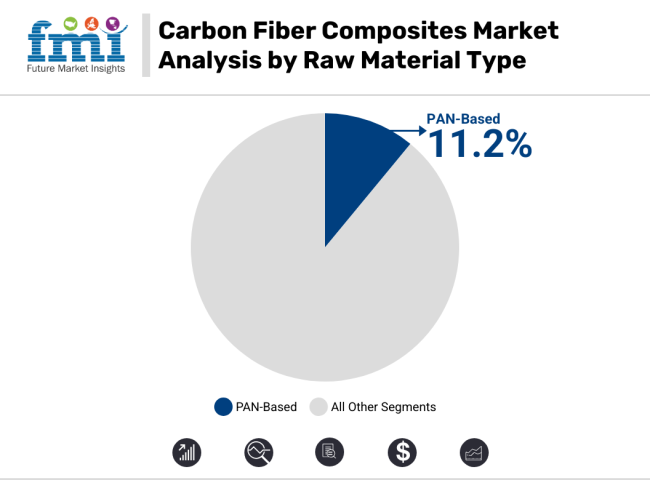
Polyacrylonitrile (PAN)-based carbon fiber composites account for the largest share due to their high tensile strength, low density, and superior thermal stability. They are preferred across aerospace, automotive, and energy sectors. PAN-based fibers are expected to maintain their lead, supported by ongoing investments in high-quality precursor processing and cost-reduction efforts.
Pitch-based carbon fibers, while offering superior thermal conductivity, see limited use in niche applications like aerospace brakes and electronics due to higher costs. Rayon-based fibers remain the smallest segment, mostly used in military and specialty applications.
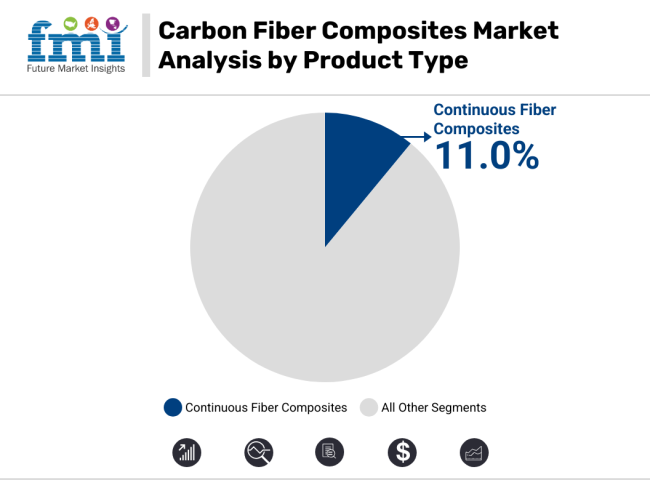
Continuous carbon fiber composites dominate the market, driven by demand in aerospace fuselage structures, wind turbine blades, and automotive chassis. Their superior strength-to-weight ratio and load-bearing capacity make them indispensable in high-performance applications.
Long and short carbon fiber composites are used where manufacturing ease, flexibility, and cost control are prioritized-especially in consumer goods and mid-range automotive components. However, their mechanical properties are lower than continuous fibers.
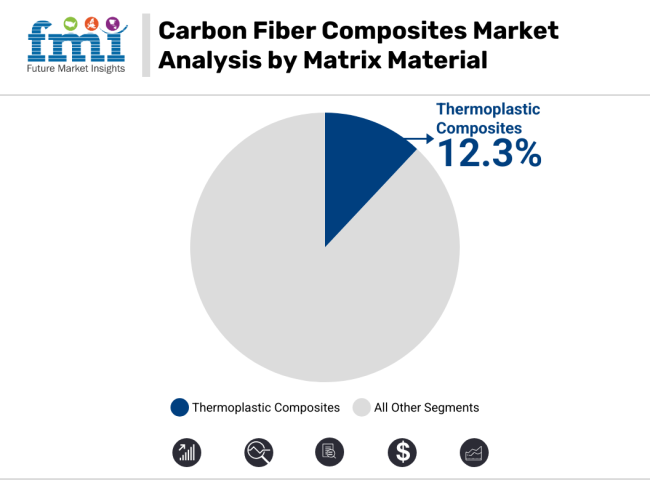
Thermoset composites currently dominate, especially in aerospace and wind applications, due to their mechanical rigidity and temperature tolerance. However, thermoplastic composites are projected to grow at the fastest pace owing to their recyclability, shorter cycle times, and suitability for automated mass production-particularly in automotive and electronics.
Thermoplastics also support design flexibility, which is crucial for evolving component architecture in EVs and IoT devices.
Aerospace & defense remains the dominant application in 2025, accounting for over one-third of global revenue. The segment benefits from stringent fuel efficiency norms, lightweighting mandates, and long product development cycles. Wind energy is another key application, with carbon fiber blades enabling higher turbine efficiency.
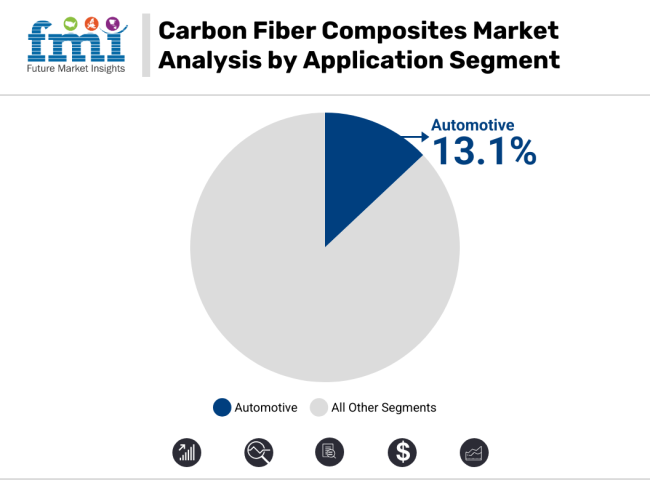
The automotive segment is projected to grow the fastest between 2025 and 2035, with carbon composites being integrated into EVs, body panels, and structural reinforcements. Demand is amplified by rising adoption of electric mobility and government incentives for lightweight, fuel-saving materials.
The carbon fiber composites market has grown to a good extent from 2020 to 2024. There is a high need from the aerospace, automotive, and wind energy sectors. Need for strong yet lightweight material that is durable too has urged manufacturers to spend on sophisticated technology. Additionally, increased interest in recycling and biobased materials is on the agenda. The industry will only grow as carbon fiber composites are used pervasively across new markets such as hydrogen storage, 3D printing, and future mobility.
Between 2025 and 2035, the industry is likely to observe significant changes with the thrust as automation has accelerated and AI is being applied to manufacturing. The developments will bring production more cost-effective and efficient, making carbon fiber composites affordable for a large number of industries. Self-healing, smart-sensing, high-performance, and multifunctional composites will open new possibilities in defense, healthcare, and robotics.
Sustainability issues will promote the use of low-energy manufacturing processes and closed-loop recycling chains. Geopolitical tensions and local production needs will shape the global carbon fiber composites market toward regionalized supply chains.
| 2020 to 2024 | 2025 to 2035 |
|---|---|
| Stricter environmental regulations drove lightweight materials for fuel efficiency. | Sustainability mandates push recycling initiatives & bio-based carbon fiber. |
| AFP & RTM improved manufacturing efficiency. | AI-driven material optimization, 3D printing, & self-healing composites emerge. |
| Aerospace, automotive, & wind energy dominated demand. | Hydrogen storage, urban air mobility, & next-gen sporting goods expand. |
| Pilot programs for carbon fiber recycling gained traction. | Circular economy models scale with full recycling & closed-loop supply chains. |
| COVID-19 caused supply chain disruptions & material shortages. | Localization & robotic automation enhance efficiency & cost-effectiveness. |
| Weight reduction & fuel efficiency drove industry adoption. | Electrification, renewable energy, & composite-based infrastructure accelerate growth. |
Beyond the traditional aerospace and sporting goods domains, these composites are finding new high-growth applications. In the renewable energy sector, carbon fiber is increasingly used in wind turbine blades - especially as turbines grow in size - because carbon fiber can reduce blade weight by ~30% versus fiberglass, allowing longer, and more efficient blades.
The push for clean energy (e.g. China’s “double carbon” goals for 2030/2060) has significantly boosted demand for carbon fibers in wind power, with carbon gradually replacing fiberglass in critical blade structures
Another booming area is hydrogen storage-carbon fiber composite pressure vessels (Type IV hydrogen tanks) are needed for fuel cell vehicles and industrial hydrogen storage, and this segment is growing explosively (the hydrogen composite tank market is projected to grow ~30% annually this decade). Urban Air Mobility and Drones represent a nascent but promising application - air taxis, UAVs, and drones require ultra-light high-strength materials, making carbon fiber essential for frames and rotors.
In the medical field, these composites are used for imaging equipment (radiolucent patient tables in X-ray/MRI machines), prosthetics and orthotics (lightweight, durable limbs/braces), and high-end wheelchairs and implants.Sporting goods is also a steady market, with high-performance bicycles, golf clubs, tennis rackets and hockey sticks - carbon fiber offers athletes a luxury combination of stiffness and light weight.
CFRP is even being embraced by civil infrastructure with seismic retrofitting (carbon fiber wraps/plates used to strengthen bridges and buildings) and lightweight architectural elements. These new and growing applications in energy, mobility, medical and infrastructure are generating new demand streams for composites that augment core aerospace/defense and auto spaces.
| Customer Pain Points | Potential Solutions for Players |
|---|---|
| High material costs | Improve logistics, increase production capacity, explore local sourcing |
| Inconsistent quality | Manufacture through its block copolymer and filament winding technologies. |
| Long lead times | Enhance logistics, augment production capacity, consider working with local suppliers |
| Process inefficiencies (slow autoclave curing) | Develop out-of-autoclave curing techniques, use faster manufacturing methods |
| Resin compatibility issues (delamination, weak bonding) | Enhance surface treatments, develop better resin systems |
| Limited recyclable/sustainable composite options | Experts recommend investing in recyclable composites, looking into closed-loop manufacturing |
| Lack of technical support for design and machining | Collaborate for R&D, offer training programs, improve customer serviceice |
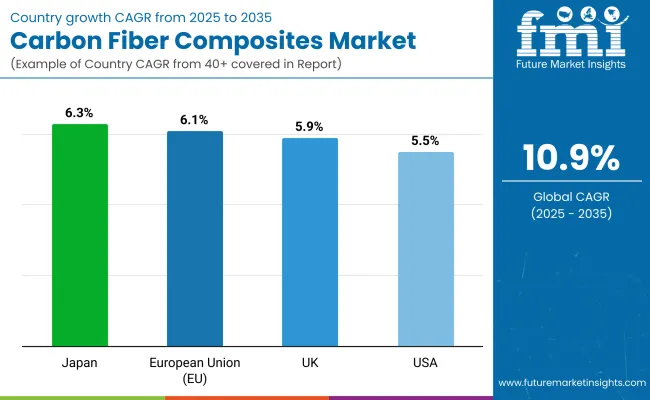
| Countries | CAGR (2025 to 2035) |
|---|---|
| USA | 5.5% |
| UK | 5.9% |
| European Union (EU) | 6.1% |
| Japan | 6.3% |
The USA leads the industry, influenced by aerospace (Lockheed Martin, Boeing), defense, and electric vehicle industries (Tesla, GM, Ford). Carbon fiber allows for higher aircraft fuel efficiency and longer-range electric vehicle battery capability. Investment in wind power fuel demand for lengthier, more lightweight turbine blades, with composites also finding use in bridge and seismic retrofitting applications as part of infrastructure projects.
The USA Department of Energy funds for the development of recyclable carbon fiber and automation to reduce costs and environmental footprint. Strict emissions controls also drive adoption. Even with expensive production and supply chain limitations, innovations in manufacturing processes are increasing applications across industries. FMI is of the opinion that the USA carbon fiber composites market is set to grow at 5.5% CAGR from 2025 to 2035.
Growth Factors in the USA
| Key Factors | Details |
|---|---|
| High Demand in Aerospace | Strong demand from Boeing & defense sector |
| Automotive Expansion | Growing use in EVs & lightweight vehicles |
| Government Support | Investments in clean energy & defense applications |
| Innovation & R&D | Advancements in resin and fiber technology |
| Renewable Energy | Increasing use in wind turbine blades |
The industry is driven by aerospace (Rolls-Royce, BAE, Airbus UK), automotive (Jaguar Land Rover, Formula 1, and renewable energy. The UK Aerospace Technology Institute sponsors lightweight material development to enhance cost-effectiveness. The EV industry is growing fast, where these composites increase vehicle performance. Wind energy investments are active with the UK's net-zero 2050 initiative, raising the demand for lightweight turbine blades. Building applications, such as bridge reinforcement, are developing. But excessive expenses restrict mass use. Efforts to create affordable and recyclable carbon fiber products are set to propel strong growth over the next few years. FMI is of the opinion that the UK industry is set to grow at 5.9% CAGR from 2025 to 2035.
Growth Factors in the UK
| Key Factors | Details |
|---|---|
| Sustainability Push | Carbon-neutral goals drive demand |
| Aerospace Leadership | Strong presence of Airbus & Rolls-Royce |
| Automotive Sector | Expansion of EVs & lightweight materials |
| Circular Economy Initiatives | Focus on recycling carbon fiber |
| Government Policies | Net-zero emissions strategy supports adoption |
The EU is a primary region for carbon fiber, with high demand in aerospace (Airbus), automotive (EVs, hybrids), and wind power (wind farms). Germany, France, and Italy dominate production and utilization. Conservative EU emissions regulations drive the adoption of lightweight materials to enhance fuel efficiency. Offshore wind power projects largely use carbon fiber for the durability and improving the performance of blades. The construction industry is using composites into making green buildings. FMI is of the opinion that the European Union market is set to grow at 6.1% CAGR from 2025 to 2035.
Growth Factors in European Union
| Key Factors | Details |
|---|---|
| Green Energy Transition | EU Green Deal promotes lightweight materials |
| Automotive Advancements | High demand from BMW, Volkswagen, and Tesla |
| Wind Energy Boom | Increasing use in turbine blades |
| Aerospace Innovation | Airbus & European space projects drive demand |
| Recycling & Sustainability | Strong focus on circular economy initiatives |
Japan leads the world in carbon fiber manufacturing, with industry giants Toray Industries and Mitsubishi Chemical based there. The aerospace industry partners with Boeing, and automakers (Toyota, Honda, and Nissan) use carbon fiber in EVs and hydrogen fuel cell vehicles. Carbon fiber is utilized by the robotics and electronics industries for lightweight, high-strength parts. Industry growth is fueled by Japan's emphasis on innovation, sustainability, and automation. Continued research into bio-based carbon fiber and recyclable composite material is in line with worldwide sustainability and follows Japan's role as a world leader in advanced carbon fiber technology and production. FMI is of the opinion that the Japanese carbon fiber composites market is set to grow at 6.3% CAGR from 2025 to 2035.
Growth Factors in Japan
| Key Factors | Details |
|---|---|
| Leading Manufacturers | Toray & Teijin drive global production |
| Automotive Lightweighting | High use in hybrid & EVs (Toyota, Honda) |
| Advanced Robotics | Demand from robotics & industrial automation |
| Government Support | R&D funding for high-performance composites |
| Sustainability Trends | Growing efforts in carbon fiber recycling |
The industry is characterized by fierce competition between key players vying for share through several portfolios for growth. The major companies in the industry include Toray Industries, Teijin Limited, Mitsubishi Chemical Group Corporation, Hexcel Corporation, and Solvay, and each company pursues a different strategy to ensure competitive advantage.
Toray Industries
Toray Industries bolsters its hold in the industry through vertical integration by strategic acquisitions. Its acquisition of Zoltek in 2014 brought an extension of its production facility for creating cost-effective carbon-fiber products, which are intended for a wider range of industrial applications beyond that of the composites market. The company continues to work on innovative research and development in line with the evolving sectors, such as aerospace and automotive.
Teijin Limited
Teijin Limited is emphasizing sustainability as well as technological advancement. In 2023, the company launched the green Tenax Carbon Fiber, which is produced from sustainable acrylonitrile as well as obtained from recycled raw materials and biomass-derived products. This is a clear indication of Teijin's conversion to environmental responsibility and the market need for high-performance materials.
Mitsubishi Chemical Group Corporation
Mitsubishi Chemical Group Corporation secured its position in the marketplace into further market share diversification through acquisitions and partnerships. For example, in 2022, the company entered into an agreement with the Japan Windsurfing Association in respect to promoting recycling activity for carbon fiber that has been utilized in windsurfing equipment, which showed the commitment of the company toward sustainability.
Hexcel Corporation
Hexcel Corporation is engaged in constant innovations and enters into strategic collaborations for bolstering its market stronghold. In 2021, Hexcel signed a contract with Dassault for providing carbon fiber prepreg for the Falcon 10X program, strengthening the presence of Hexcel in aerospace. Hexcel continues to invest in the expansion of manufacturing capabilities as evident from the inauguration of a carbon fiber plant in France to meet the increasing demand from aerospace and industrial markets.
Solvay
Solvay has moved along the development trajectory through product innovation and alliances toward expansion. The introduction of LTM 350, an advanced epoxy prepreg carbon fiber tooling material in 2022, seeks to result in the industry's experiencing time and cost savings, particularly in aerospace, automotive, and race car manufacturing. Solvay's undivided focus on developing advanced materials fits into the requirement of the industry for time and cost efficient and high-performance solutions.
The strategies adopted by these companies are a blend of innovation, sustainability, strategic partnerships, and expanding efforts that drive the competitive landscape.
By end use, the segmentation is as aerospace, automotive, wind turbines, sports & leisure, civil engineering, marine applications, and other end uses.
By matrix material, the segmentation is as polymer matrix (thermosetting and thermoplastics), carbon matrix, ceramics matrix, metal matrix, and hybrid matrix.
By region, the segmentation is North America, Latin America, Europe, the Middle East & Africa, and Asia Pacific.
In 2025 the market is estimated to be worth USD 25.6 billion.
The market is predicted to reach a size of USD 72.3 billion by 2035.
Some of the key companies include Toray + Zoltek, SGL Carbon, Toho, MRC, Hexcel Corporation, Rock West Composites, Hengshen, Mitsubishi Chemical Fiber Corporation, Teijin Limited, and Solvay.
Japan is slated to grow at 6.3% CAGR during the study period and is expected to emerge as a key hub for product manufacturers.
Epoxy is the largest segment in thermosetting carbon fiber composites.
Table 1: Global Market Value (US$ Million) Forecast by Region, 2018 to 2033
Table 2: Global Market Volume (Tons) Forecast by Region, 2018 to 2033
Table 3: Global Market Value (US$ Million) Forecast by Matrix Material, 2018 to 2033
Table 4: Global Market Volume (Tons) Forecast by Matrix Material, 2018 to 2033
Table 5: Global Market Value (US$ Million) Forecast by End Use, 2018 to 2033
Table 6: Global Market Volume (Tons) Forecast by End Use, 2018 to 2033
Table 7: North America Market Value (US$ Million) Forecast by Country, 2018 to 2033
Table 8: North America Market Volume (Tons) Forecast by Country, 2018 to 2033
Table 9: North America Market Value (US$ Million) Forecast by Matrix Material, 2018 to 2033
Table 10: North America Market Volume (Tons) Forecast by Matrix Material, 2018 to 2033
Table 11: North America Market Value (US$ Million) Forecast by End Use, 2018 to 2033
Table 12: North America Market Volume (Tons) Forecast by End Use, 2018 to 2033
Table 13: Latin America Market Value (US$ Million) Forecast by Country, 2018 to 2033
Table 14: Latin America Market Volume (Tons) Forecast by Country, 2018 to 2033
Table 15: Latin America Market Value (US$ Million) Forecast by Matrix Material, 2018 to 2033
Table 16: Latin America Market Volume (Tons) Forecast by Matrix Material, 2018 to 2033
Table 17: Latin America Market Value (US$ Million) Forecast by End Use, 2018 to 2033
Table 18: Latin America Market Volume (Tons) Forecast by End Use, 2018 to 2033
Table 19: Western Europe Market Value (US$ Million) Forecast by Country, 2018 to 2033
Table 20: Western Europe Market Volume (Tons) Forecast by Country, 2018 to 2033
Table 21: Western Europe Market Value (US$ Million) Forecast by Matrix Material, 2018 to 2033
Table 22: Western Europe Market Volume (Tons) Forecast by Matrix Material, 2018 to 2033
Table 23: Western Europe Market Value (US$ Million) Forecast by End Use, 2018 to 2033
Table 24: Western Europe Market Volume (Tons) Forecast by End Use, 2018 to 2033
Table 25: Eastern Europe Market Value (US$ Million) Forecast by Country, 2018 to 2033
Table 26: Eastern Europe Market Volume (Tons) Forecast by Country, 2018 to 2033
Table 27: Eastern Europe Market Value (US$ Million) Forecast by Matrix Material, 2018 to 2033
Table 28: Eastern Europe Market Volume (Tons) Forecast by Matrix Material, 2018 to 2033
Table 29: Eastern Europe Market Value (US$ Million) Forecast by End Use, 2018 to 2033
Table 30: Eastern Europe Market Volume (Tons) Forecast by End Use, 2018 to 2033
Table 31: South Asia and Pacific Market Value (US$ Million) Forecast by Country, 2018 to 2033
Table 32: South Asia and Pacific Market Volume (Tons) Forecast by Country, 2018 to 2033
Table 33: South Asia and Pacific Market Value (US$ Million) Forecast by Matrix Material, 2018 to 2033
Table 34: South Asia and Pacific Market Volume (Tons) Forecast by Matrix Material, 2018 to 2033
Table 35: South Asia and Pacific Market Value (US$ Million) Forecast by End Use, 2018 to 2033
Table 36: South Asia and Pacific Market Volume (Tons) Forecast by End Use, 2018 to 2033
Table 37: East Asia Market Value (US$ Million) Forecast by Country, 2018 to 2033
Table 38: East Asia Market Volume (Tons) Forecast by Country, 2018 to 2033
Table 39: East Asia Market Value (US$ Million) Forecast by Matrix Material, 2018 to 2033
Table 40: East Asia Market Volume (Tons) Forecast by Matrix Material, 2018 to 2033
Table 41: East Asia Market Value (US$ Million) Forecast by End Use, 2018 to 2033
Table 42: East Asia Market Volume (Tons) Forecast by End Use, 2018 to 2033
Table 43: Middle East and Africa Market Value (US$ Million) Forecast by Country, 2018 to 2033
Table 44: Middle East and Africa Market Volume (Tons) Forecast by Country, 2018 to 2033
Table 45: Middle East and Africa Market Value (US$ Million) Forecast by Matrix Material, 2018 to 2033
Table 46: Middle East and Africa Market Volume (Tons) Forecast by Matrix Material, 2018 to 2033
Table 47: Middle East and Africa Market Value (US$ Million) Forecast by End Use, 2018 to 2033
Table 48: Middle East and Africa Market Volume (Tons) Forecast by End Use, 2018 to 2033
Figure 1: Global Market Value (US$ Million) by Matrix Material, 2023 to 2033
Figure 2: Global Market Value (US$ Million) by End Use, 2023 to 2033
Figure 3: Global Market Value (US$ Million) by Region, 2023 to 2033
Figure 4: Global Market Value (US$ Million) Analysis by Region, 2018 to 2033
Figure 5: Global Market Volume (Tons) Analysis by Region, 2018 to 2033
Figure 6: Global Market Value Share (%) and BPS Analysis by Region, 2023 to 2033
Figure 7: Global Market Y-o-Y Growth (%) Projections by Region, 2023 to 2033
Figure 8: Global Market Value (US$ Million) Analysis by Matrix Material, 2018 to 2033
Figure 9: Global Market Volume (Tons) Analysis by Matrix Material, 2018 to 2033
Figure 10: Global Market Value Share (%) and BPS Analysis by Matrix Material, 2023 to 2033
Figure 11: Global Market Y-o-Y Growth (%) Projections by Matrix Material, 2023 to 2033
Figure 12: Global Market Value (US$ Million) Analysis by End Use, 2018 to 2033
Figure 13: Global Market Volume (Tons) Analysis by End Use, 2018 to 2033
Figure 14: Global Market Value Share (%) and BPS Analysis by End Use, 2023 to 2033
Figure 15: Global Market Y-o-Y Growth (%) Projections by End Use, 2023 to 2033
Figure 16: Global Market Attractiveness by Matrix Material, 2023 to 2033
Figure 17: Global Market Attractiveness by End Use, 2023 to 2033
Figure 18: Global Market Attractiveness by Region, 2023 to 2033
Figure 19: North America Market Value (US$ Million) by Matrix Material, 2023 to 2033
Figure 20: North America Market Value (US$ Million) by End Use, 2023 to 2033
Figure 21: North America Market Value (US$ Million) by Country, 2023 to 2033
Figure 22: North America Market Value (US$ Million) Analysis by Country, 2018 to 2033
Figure 23: North America Market Volume (Tons) Analysis by Country, 2018 to 2033
Figure 24: North America Market Value Share (%) and BPS Analysis by Country, 2023 to 2033
Figure 25: North America Market Y-o-Y Growth (%) Projections by Country, 2023 to 2033
Figure 26: North America Market Value (US$ Million) Analysis by Matrix Material, 2018 to 2033
Figure 27: North America Market Volume (Tons) Analysis by Matrix Material, 2018 to 2033
Figure 28: North America Market Value Share (%) and BPS Analysis by Matrix Material, 2023 to 2033
Figure 29: North America Market Y-o-Y Growth (%) Projections by Matrix Material, 2023 to 2033
Figure 30: North America Market Value (US$ Million) Analysis by End Use, 2018 to 2033
Figure 31: North America Market Volume (Tons) Analysis by End Use, 2018 to 2033
Figure 32: North America Market Value Share (%) and BPS Analysis by End Use, 2023 to 2033
Figure 33: North America Market Y-o-Y Growth (%) Projections by End Use, 2023 to 2033
Figure 34: North America Market Attractiveness by Matrix Material, 2023 to 2033
Figure 35: North America Market Attractiveness by End Use, 2023 to 2033
Figure 36: North America Market Attractiveness by Country, 2023 to 2033
Figure 37: Latin America Market Value (US$ Million) by Matrix Material, 2023 to 2033
Figure 38: Latin America Market Value (US$ Million) by End Use, 2023 to 2033
Figure 39: Latin America Market Value (US$ Million) by Country, 2023 to 2033
Figure 40: Latin America Market Value (US$ Million) Analysis by Country, 2018 to 2033
Figure 41: Latin America Market Volume (Tons) Analysis by Country, 2018 to 2033
Figure 42: Latin America Market Value Share (%) and BPS Analysis by Country, 2023 to 2033
Figure 43: Latin America Market Y-o-Y Growth (%) Projections by Country, 2023 to 2033
Figure 44: Latin America Market Value (US$ Million) Analysis by Matrix Material, 2018 to 2033
Figure 45: Latin America Market Volume (Tons) Analysis by Matrix Material, 2018 to 2033
Figure 46: Latin America Market Value Share (%) and BPS Analysis by Matrix Material, 2023 to 2033
Figure 47: Latin America Market Y-o-Y Growth (%) Projections by Matrix Material, 2023 to 2033
Figure 48: Latin America Market Value (US$ Million) Analysis by End Use, 2018 to 2033
Figure 49: Latin America Market Volume (Tons) Analysis by End Use, 2018 to 2033
Figure 50: Latin America Market Value Share (%) and BPS Analysis by End Use, 2023 to 2033
Figure 51: Latin America Market Y-o-Y Growth (%) Projections by End Use, 2023 to 2033
Figure 52: Latin America Market Attractiveness by Matrix Material, 2023 to 2033
Figure 53: Latin America Market Attractiveness by End Use, 2023 to 2033
Figure 54: Latin America Market Attractiveness by Country, 2023 to 2033
Figure 55: Western Europe Market Value (US$ Million) by Matrix Material, 2023 to 2033
Figure 56: Western Europe Market Value (US$ Million) by End Use, 2023 to 2033
Figure 57: Western Europe Market Value (US$ Million) by Country, 2023 to 2033
Figure 58: Western Europe Market Value (US$ Million) Analysis by Country, 2018 to 2033
Figure 59: Western Europe Market Volume (Tons) Analysis by Country, 2018 to 2033
Figure 60: Western Europe Market Value Share (%) and BPS Analysis by Country, 2023 to 2033
Figure 61: Western Europe Market Y-o-Y Growth (%) Projections by Country, 2023 to 2033
Figure 62: Western Europe Market Value (US$ Million) Analysis by Matrix Material, 2018 to 2033
Figure 63: Western Europe Market Volume (Tons) Analysis by Matrix Material, 2018 to 2033
Figure 64: Western Europe Market Value Share (%) and BPS Analysis by Matrix Material, 2023 to 2033
Figure 65: Western Europe Market Y-o-Y Growth (%) Projections by Matrix Material, 2023 to 2033
Figure 66: Western Europe Market Value (US$ Million) Analysis by End Use, 2018 to 2033
Figure 67: Western Europe Market Volume (Tons) Analysis by End Use, 2018 to 2033
Figure 68: Western Europe Market Value Share (%) and BPS Analysis by End Use, 2023 to 2033
Figure 69: Western Europe Market Y-o-Y Growth (%) Projections by End Use, 2023 to 2033
Figure 70: Western Europe Market Attractiveness by Matrix Material, 2023 to 2033
Figure 71: Western Europe Market Attractiveness by End Use, 2023 to 2033
Figure 72: Western Europe Market Attractiveness by Country, 2023 to 2033
Figure 73: Eastern Europe Market Value (US$ Million) by Matrix Material, 2023 to 2033
Figure 74: Eastern Europe Market Value (US$ Million) by End Use, 2023 to 2033
Figure 75: Eastern Europe Market Value (US$ Million) by Country, 2023 to 2033
Figure 76: Eastern Europe Market Value (US$ Million) Analysis by Country, 2018 to 2033
Figure 77: Eastern Europe Market Volume (Tons) Analysis by Country, 2018 to 2033
Figure 78: Eastern Europe Market Value Share (%) and BPS Analysis by Country, 2023 to 2033
Figure 79: Eastern Europe Market Y-o-Y Growth (%) Projections by Country, 2023 to 2033
Figure 80: Eastern Europe Market Value (US$ Million) Analysis by Matrix Material, 2018 to 2033
Figure 81: Eastern Europe Market Volume (Tons) Analysis by Matrix Material, 2018 to 2033
Figure 82: Eastern Europe Market Value Share (%) and BPS Analysis by Matrix Material, 2023 to 2033
Figure 83: Eastern Europe Market Y-o-Y Growth (%) Projections by Matrix Material, 2023 to 2033
Figure 84: Eastern Europe Market Value (US$ Million) Analysis by End Use, 2018 to 2033
Figure 85: Eastern Europe Market Volume (Tons) Analysis by End Use, 2018 to 2033
Figure 86: Eastern Europe Market Value Share (%) and BPS Analysis by End Use, 2023 to 2033
Figure 87: Eastern Europe Market Y-o-Y Growth (%) Projections by End Use, 2023 to 2033
Figure 88: Eastern Europe Market Attractiveness by Matrix Material, 2023 to 2033
Figure 89: Eastern Europe Market Attractiveness by End Use, 2023 to 2033
Figure 90: Eastern Europe Market Attractiveness by Country, 2023 to 2033
Figure 91: South Asia and Pacific Market Value (US$ Million) by Matrix Material, 2023 to 2033
Figure 92: South Asia and Pacific Market Value (US$ Million) by End Use, 2023 to 2033
Figure 93: South Asia and Pacific Market Value (US$ Million) by Country, 2023 to 2033
Figure 94: South Asia and Pacific Market Value (US$ Million) Analysis by Country, 2018 to 2033
Figure 95: South Asia and Pacific Market Volume (Tons) Analysis by Country, 2018 to 2033
Figure 96: South Asia and Pacific Market Value Share (%) and BPS Analysis by Country, 2023 to 2033
Figure 97: South Asia and Pacific Market Y-o-Y Growth (%) Projections by Country, 2023 to 2033
Figure 98: South Asia and Pacific Market Value (US$ Million) Analysis by Matrix Material, 2018 to 2033
Figure 99: South Asia and Pacific Market Volume (Tons) Analysis by Matrix Material, 2018 to 2033
Figure 100: South Asia and Pacific Market Value Share (%) and BPS Analysis by Matrix Material, 2023 to 2033
Figure 101: South Asia and Pacific Market Y-o-Y Growth (%) Projections by Matrix Material, 2023 to 2033
Figure 102: South Asia and Pacific Market Value (US$ Million) Analysis by End Use, 2018 to 2033
Figure 103: South Asia and Pacific Market Volume (Tons) Analysis by End Use, 2018 to 2033
Figure 104: South Asia and Pacific Market Value Share (%) and BPS Analysis by End Use, 2023 to 2033
Figure 105: South Asia and Pacific Market Y-o-Y Growth (%) Projections by End Use, 2023 to 2033
Figure 106: South Asia and Pacific Market Attractiveness by Matrix Material, 2023 to 2033
Figure 107: South Asia and Pacific Market Attractiveness by End Use, 2023 to 2033
Figure 108: South Asia and Pacific Market Attractiveness by Country, 2023 to 2033
Figure 109: East Asia Market Value (US$ Million) by Matrix Material, 2023 to 2033
Figure 110: East Asia Market Value (US$ Million) by End Use, 2023 to 2033
Figure 111: East Asia Market Value (US$ Million) by Country, 2023 to 2033
Figure 112: East Asia Market Value (US$ Million) Analysis by Country, 2018 to 2033
Figure 113: East Asia Market Volume (Tons) Analysis by Country, 2018 to 2033
Figure 114: East Asia Market Value Share (%) and BPS Analysis by Country, 2023 to 2033
Figure 115: East Asia Market Y-o-Y Growth (%) Projections by Country, 2023 to 2033
Figure 116: East Asia Market Value (US$ Million) Analysis by Matrix Material, 2018 to 2033
Figure 117: East Asia Market Volume (Tons) Analysis by Matrix Material, 2018 to 2033
Figure 118: East Asia Market Value Share (%) and BPS Analysis by Matrix Material, 2023 to 2033
Figure 119: East Asia Market Y-o-Y Growth (%) Projections by Matrix Material, 2023 to 2033
Figure 120: East Asia Market Value (US$ Million) Analysis by End Use, 2018 to 2033
Figure 121: East Asia Market Volume (Tons) Analysis by End Use, 2018 to 2033
Figure 122: East Asia Market Value Share (%) and BPS Analysis by End Use, 2023 to 2033
Figure 123: East Asia Market Y-o-Y Growth (%) Projections by End Use, 2023 to 2033
Figure 124: East Asia Market Attractiveness by Matrix Material, 2023 to 2033
Figure 125: East Asia Market Attractiveness by End Use, 2023 to 2033
Figure 126: East Asia Market Attractiveness by Country, 2023 to 2033
Figure 127: Middle East and Africa Market Value (US$ Million) by Matrix Material, 2023 to 2033
Figure 128: Middle East and Africa Market Value (US$ Million) by End Use, 2023 to 2033
Figure 129: Middle East and Africa Market Value (US$ Million) by Country, 2023 to 2033
Figure 130: Middle East and Africa Market Value (US$ Million) Analysis by Country, 2018 to 2033
Figure 131: Middle East and Africa Market Volume (Tons) Analysis by Country, 2018 to 2033
Figure 132: Middle East and Africa Market Value Share (%) and BPS Analysis by Country, 2023 to 2033
Figure 133: Middle East and Africa Market Y-o-Y Growth (%) Projections by Country, 2023 to 2033
Figure 134: Middle East and Africa Market Value (US$ Million) Analysis by Matrix Material, 2018 to 2033
Figure 135: Middle East and Africa Market Volume (Tons) Analysis by Matrix Material, 2018 to 2033
Figure 136: Middle East and Africa Market Value Share (%) and BPS Analysis by Matrix Material, 2023 to 2033
Figure 137: Middle East and Africa Market Y-o-Y Growth (%) Projections by Matrix Material, 2023 to 2033
Figure 138: Middle East and Africa Market Value (US$ Million) Analysis by End Use, 2018 to 2033
Figure 139: Middle East and Africa Market Volume (Tons) Analysis by End Use, 2018 to 2033
Figure 140: Middle East and Africa Market Value Share (%) and BPS Analysis by End Use, 2023 to 2033
Figure 141: Middle East and Africa Market Y-o-Y Growth (%) Projections by End Use, 2023 to 2033
Figure 142: Middle East and Africa Market Attractiveness by Matrix Material, 2023 to 2033
Figure 143: Middle East and Africa Market Attractiveness by End Use, 2023 to 2033
Figure 144: Middle East and Africa Market Attractiveness by Country, 2023 to 2033


Full Research Suite comprises of:
Market outlook & trends analysis
Interviews & case studies
Strategic recommendations
Vendor profiles & capabilities analysis
5-year forecasts
8 regions and 60+ country-level data splits
Market segment data splits
12 months of continuous data updates
DELIVERED AS:
PDF EXCEL ONLINE
Carbon Fiber Composites for Prosthetics Market 2025-2035
Carbon Capture and Sequestration Market Forecast Outlook 2025 to 2035
Carbon Dioxide Incubators Market Size and Share Forecast Outlook 2025 to 2035
Carbon Enhanced Lead Acid Battery Market Size and Share Forecast Outlook 2025 to 2035
Carbon-negative Cement Market Size and Share Forecast Outlook 2025 to 2035
Carbon Tetrabromide Market Size and Share Forecast Outlook 2025 to 2035
Carbon Steel Market Size and Share Forecast Outlook 2025 to 2035
Carbon Brush Market Size and Share Forecast Outlook 2025 to 2035
Carbon Offset Platform Market Size and Share Forecast Outlook 2025 to 2035
Carbon Tapes Market Size and Share Forecast Outlook 2025 to 2035
Carbon-Free Waste Gas Abatement System Market Size and Share Forecast Outlook 2025 to 2035
Carbon Labeled Packaged Meal Market Analysis - Size and Share Forecast Outlook 2025 to 2035
Carbon Dioxide Lasers Market Size and Share Forecast Outlook 2025 to 2035
Carbon-negative Packaging Market Size and Share Forecast Outlook 2025 to 2035
Carbon Credit Market Size and Share Forecast Outlook 2025 to 2035
Carbon-Dioxide Synthesis Cosmetics Market Size and Share Forecast Outlook 2025 to 2035
Carbon-Neutral Skincare Ingredients Market Analysis - Size and Share Forecast Outlook 2025 to 2035
Carbonate Market Size and Share Forecast Outlook 2025 to 2035
Carbon Textile Reinforced Concrete Market Size and Share Forecast Outlook 2025 to 2035
Carbon And Graphite Felt Market Size and Share Forecast Outlook 2025 to 2035

Thank you!
You will receive an email from our Business Development Manager. Please be sure to check your SPAM/JUNK folder too.
Chat With
MaRIA